The competitiveness of the residential real estate brokerage industry has attracted much attention. Anecdotal evidence suggests some local markets are concentrated, yet no systematic market structure study has been conducted. We collected cross-sectional data on real estate brokers in 90 diverse markets across the United States and collected longitudinal data for Louisville, Kentucky. In medium and large markets, no evidence exists that market concentration might create problems for competition. Small markets, on average, have higher Herfindahl-Hirschman Indexes than medium and large markets. The longitudinal data reveal that many small brokers sell a house or two one year and none the next year.
Recommended citation
Jason Beck, Frank Scott, and Aaron Yelowitz. “Concentration and Market Structure in Local Real Estate Markets.” Real Estate Economics 40(3) (2012): 422–460. https://doi.org/10.1111/j.1540-6229.2011.00322.x
Jason Beck, Frank Scott, and Aaron Yelowitz. “Concentration and Market Structure in Local Real Estate Markets.” Real Estate Economics 40(3) (2012): 422–460. https://doi.org/10.1111/j.1540-6229.2011.00322.x
Complete article reading edition. Tables and figures reproduce the published source; open an image for full resolution. The PDF retains the original page layout.
Affiliations: Jason Beck — Armstrong Atlantic State University; Frank Scott and Aaron Yelowitz — University of Kentucky.
Published author affiliations
Jason Beck: Department of Economics, Armstrong Atlantic State University, Savannah, GA 31419 or Jason.Beck@armstrong.edu.
Frank Scott: Department of Economics, University of Kentucky, Lexington, KY 40506 or fscott@uky.edu.
Aaron Yelowitz: Department of Economics, University of Kentucky, Lexington, KY 40506 or aaron@uky.edu.
Abstract
The competitiveness of the residential real estate brokerage industry has attracted much attention. Anecdotal evidence suggests some local markets are concentrated, yet no systematic market structure study has been conducted. We collected cross-sectional data on real estate brokers in 90 diverse markets across the United States and collected longitudinal data for Louisville, Kentucky. In medium and large markets, no evidence exists that market concentration might create problems for competition. Small markets, on average, have higher Herfindahl-Hirschman Indexes than medium and large markets. The longitudinal data reveal that many small brokers sell a house or two one year and none the next year.
Residential real estate brokerage is characterized by low barriers to entry and a large number of firms. Furthermore, the Multiple Listing Services (MLS) found in practically every local real estate market act to level the playing field because listings from small firms or new entrants receive equal exposure with those of large established firms. On the other hand, the compensation structure for real estate agents has exhibited a certain rigidity even in the face of technological changes that have dramatically altered the role and compensation of middlemen in other types of markets.
For this and other reasons, the competitiveness of real estate brokerage in the United States has been an ongoing concern of both federal and state governments. The Federal Trade Commission (FTC) and the U.S. Department of Justice (DOJ) conducted a joint study of competition in the real estate brokerage industry in 2007.1 The DOJ’s Antitrust Division maintains a Web site for consumers devoted to competition and real estate.2 While most states have real estate commissions that regulate and license real estate agents and brokers, efforts at the state level have not always promoted competition. A 2005 U.S. Government Accountability Office (GAO) study analyzed the potential anticompetitive effects of various state laws that prohibit rebates or set minimum service standards.3
On the other hand, the main industry trade group contends that there is little concentration in the real estate industry and that consumers benefit from competitively determined prices. A 2005 research report by the National Association of Realtors (NAR) concluded that “the residential real estate brokerage industry is fiercely competitive.” They analyzed the national market for real estate brokerage and found that the top 100 real estate firms (in 2004) held only 17% of the market share.4
The number and size distribution of firms are important determinants of the nature of competition in a market. At the national level, both the NAR and the FTC/DOJ reports point out that the industry is not concentrated.5 But as most observers agree, real estate markets are local, so national-level market structure information is not dispositive. To determine whether supplier concentration at the local market level creates the potential for softer competition and price rigidity, data on the number and size shares of firms in local markets are required.
Limited evidence on market structure in local real estate markets does exist. The FTC/DOJ report offered four examples of concentrated local markets: two firms with more than 50% of the northeastern Ohio market, one firm with more than 50% of the Des Moines, IA, market, two firms with more than 50% of the State College, PA, market and two firms with more than 75% of the Lincoln, NE, market.6 Forgey, Mullendore and Rutherford (1997) studied a medium-sized Texas city and found four-firm concentration ratios of 57% for listing firms and 46% for selling firms. Colwell and Marshall (1986) looked at market structure in Champaign, IL, and found lower levels of concentration.7
Concern over competition in residential real estate brokerage combined with a paucity of data on market concentration in local real estate markets provides the motivation for this article. We have collected information on the number and market shares of real estate brokers in a variety of small, medium and large cities throughout the United States. We collected these data from the NAR official Web site, www.realtor.com, in fall 2007 and then again in fall 2009. We find that in a minority of the small cities and in only a few of the medium-sized cities, Herfindahl-Hirschman Indexes (HHIs) fall into the range that would invite scrutiny by the FTC and DOJ under the 1997 Horizontal Merger Guidelines. In addition, individual firm market shares tend to be somewhat volatile and HHIs change nontrivially between 2007 and 2009 in a number of different markets.
To further explore the stability of market shares over time, we have also collected data for Louisville, KY, from 2000 to 2008. These data enable us to track firms over time from the smallest to the largest during a steady upswing and then through an abrupt downswing in the residential real estate market. Different measures of market structure yield very similar results whether looking at the selling side or the buying side of market transactions. HHI declines very slowly over time, and the identities of the top ten firms are very stable over time. In this market, firms do not seem to specialize in one side or the other of market transactions.
The next section of this article analyzes aspects of the market for residential real estate brokerage that affect the nature of competition. Following that, we discuss and analyze the cross-sectional data that we have collected on small, medium and large local real estate markets. Then, we discuss and analyze the time series data we have collected for Louisville, KY, for 2000–2008. We conclude the article with a further discussion of competition and market structure in real estate brokerage.
Aspects of Real Estate Brokerage that May Affect Competition
Residential real estate transactions usually involve middlemen. Sellers and buyers typically engage the services of professional real estate agents, many of whom are licensed Realtors®, that is, members of NAR. An early paper by Yinger (1981) discusses information and search in real estate markets and models the role of brokers in real estate transactions. Zumpano and Hooks (1988) analyze the market structure of real estate brokerage and discuss alternative hypotheses about the pricing of brokerage services.8 Some home sellers do not hire a professional real estate agent to help market their houses, but instead they choose the For Sale by Owner (FSBO) route.9 Similarly, some buyers do not directly employ the services of an agent to help in their search for a house. The range of services offered by real estate agents can vary considerably.10
The geographic scope of the market is local. There is general agreement on this matter. The 2007 FTC/DOJ report asserts that “competition among brokers is primarily local because real estate is fixed in a geographic location, and buyers and sellers want some in-person interaction with a broker who has experience and expertise relevant to that particular location.”11 This view is supported by NAR-funded research, which describes the real estate industry as a collection of many local real estate markets.12
The cost structure is such that there are some economies of scale and scope in real estate brokerage. That there are not sizeable economies of scale is not surprising, given the nature of the production process. The primary input is labor and human capital on the part of the seller’s agent and brokerage firm and the buyer’s agent and brokerage firm. Empirical estimation of cost functions for residential real estate brokerage confirms this basic intuition. Zumpano, Elder and Crellin (1993) estimated the production function of the residential brokerage industry and found a U-shaped cost curve with significant economies of scale at low output levels, constant unit costs over a substantial range of output, followed by diseconomies at higher output levels. Zumpano and Elder (1994) found economies of scope that allow small firms to compete effectively against larger ones given the shared input of the MLS. Anderson, Lewis and Zumpano (2000a) estimated efficient cost frontiers and calculated economies of scale, finding that a majority of firms were operating at increasing returns to scale; however, the same authors (Anderson, Lewis and Zumpano 2000b) analyzed X-efficiency by firm size and found that small firms are more efficient than larger firms, indicating a tradeoff between scale efficiency and productive efficiency.13 As the NAR (2005, Appendix 1) also points out, a survivor analysis of real estate brokerage indicates that small firms compete effectively with larger firms, as evidenced by stability of market shares of Entry into the real estate industry is relatively costless and agents and brokers enter and exit on a regular basis. States require real estate professionals to be licensed in order to operate. There are two types of licenses, sales associates and brokers. Sales associate licensure always precedes broker licensure and has lower requirements. These requirements vary from state to state, but usually involve classroom hours, an exam and a licensing fee.14 Brokerage licensure usually requires practicing as a sales associate for a specified time, additional classroom hours, an exam and a licensing fee. Brokers must also line up sales associates, set up an office and staff it and advertise. The FTC/DOJ report (2007, p. 33) did express the concern that brokerage entry appears to be more difficult than sales associate entry.
The advent of the Internet has drastically changed the role of the middleman in a number of markets, for example, travel agents and life insurance agents.15 And the Internet is playing an ever-increasing role in real estate transactions. The NAR’s Web site Realtor.com lists homes for sale in all 50 states and thousands of cities and towns representing over 800 MLSs. Because prospective buyers can directly access listing information themselves through Realtor.com and Web sites maintained by various individual brokers and agents, much of the search that used to be done with the assistance of an agent or broker no longer requires their labor input.
The Internet has also increased the viability of business models that differ from the traditional full-service brokerage. Various aspects of the real estate transaction can now be separated and performed in different ways, not necessarily involving real estate brokers and agents playing their traditional roles.16 The GAO (2005, pp. 19–20) described several alternative approaches that are now available to consumers: (1) full-service discount brokerages, (2) limited-service discount brokerages, (3) information and referral companies and (4) alternative listing Web sites. But despite playing an ever-increasing role in real estate markets, the Internet has not yet had any significant impact on commissions.
Real estate professionals have historically stifled price competition through their professional associations and local MLSs. The Supreme Court ruled in 1950 that MLSs could not require participating brokers to charge standard commission rates. After many MLSs switched to suggested fee schedules, the DOJ acted in the 1970s to halt this practice. So, formal policies to maintain uniform rates have disappeared.17
While the NAR claims that residential real estate markets are competitive, the GAO questions the degree of price competition and points out that commission rates have remained relatively uniform across markets and over time and do not reflect the costs of selling a house.18 Yinger (1981), Hsieh and Moretti (2003) and White (2006) argue that such fee rigidity is an indicator of a lack of competition. Competition in markets causes prices to approximate economic costs. The cost of selling a house has both a fixed component and a variable component (which may be nonlinear), and the slope of the variable component is less than one. So, competition would lead to a commission rate structure that is lower for higher-valued houses, instead of the rigid 6% rate that is observed. Carney (1982) points out that historic listed fees in California contained numerous tapered rate structures. He collected nationwide data on actual commission rates and sale prices in the late 1970s and found a statistically and economically significant negative relationship. Delcoure and Miller (2002) study brokerage fees charged in a variety of other countries around the world. In many countries, sellers and buyers each pay a portion of the total commission. Advertising and other services are commonly unbundled,19 and tapered rate structures are also commonly observed.20
The NAR (2005, pp. 6–8) claims that collusion to set commission rates at the agent level is impossible, because brokers and not agents set commission rates. Brokers negotiate the split of commissions with their agents, with more successful agents being able to claim a larger proportion. Brokers compete vigorously to retain good agents, so agents are able to extract surplus from brokers competing for their services. If collusion is the reason for the persistent uniformity in commission rates, it must occur at the broker level.
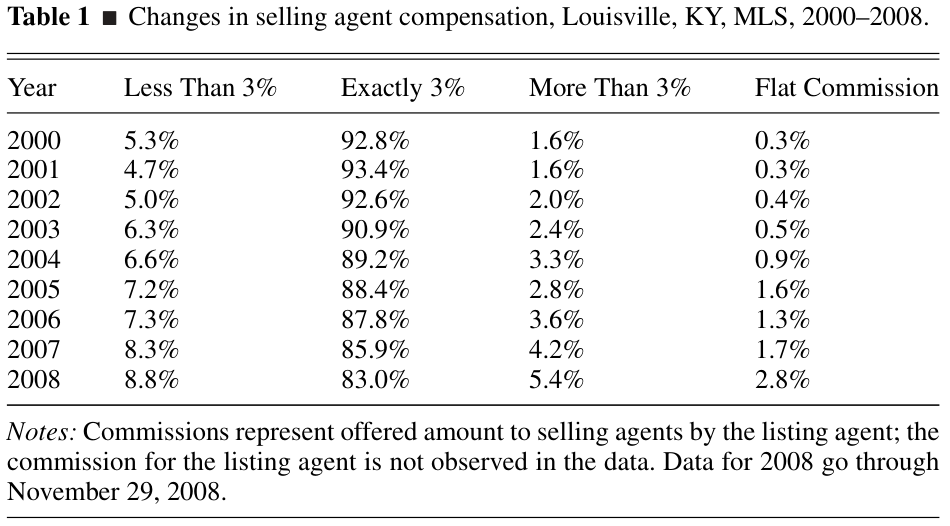
Notes:Notes: Commissions represent offered amount to selling agents by the listing agent; the commission for the listing agent is not observed in the data. Data for 2008 go through November 29, 2008.
White (2006, pp. 5–6) points out two structural features of real estate markets that facilitate collusion. First, the MLS has natural monopoly aspects that enable the collective members of an MLS to exclude “maverick” rivals who are price-cutters.21 Second, real estate agents operate on both the sell-side and buy-side of the market, and so must continually cooperate with other agents in order to complete transactions. Such a social climate may facilitate the maintenance of high fee levels.
Levitt and Syverson (2008) also analyze collusion on the part of real estate professionals as a possible explanations why the industry has been successful in preserving its position at the center of real estate transactions and for the resistance to changes in prices or services rendered. They offer the necessity of cooperation as a reason, something that sets real estate transactions apart from travel agents, stock brokers, etc . They model the collusive equilibrium and discuss the role of the number of firms in the market. Such collusion is obviously easier to achieve if the market for real estate brokerage is highly concentrated.
There is evidence that commissions have shown increased variation in the United States over the past decade. Table 1 contains data from the Louisville, KY, MLS from 2000 until 2008 on the percentage of residential housing transactions where the selling agent’s commission was listed as being less than, equal to or greater than 3% for percentage-based commissions, or a flat dollar-value commission.22 As can be seen, the prevalence of a 3% commission for the selling agent has declined markedly over the 2000–2008 period, from 93% to 83% of all transactions. Even more deviation from the evenly split 6% norm apparently occurs on the listing agent side. A Consumer Reports (2008) survey found that 46% of respondents who sold a home using real estate agents attempted to negotiate a lower commission, and roughly 71% of that group succeeded.23
Cross-Sectional Analysis of Market Concentration
Now, we turn our attention to market concentration. A nationally consistent source of data on local real estate markets is available from the NAR, which maintains a Web site that assembles homes listed on regional MLSs. This Web site, www.realtor.com, allows users to search/browse through listings practically anywhere in the country by city or ZIP code.24 For a given listing, basic housing characteristics such as number of bedrooms, number of bathrooms, age of the home, ZIP code, square footage, listing price and type of home (condominium vs. single-family dwelling) are usually available along with a number of photographs. Importantly for our purposes, the brokerage firm through which the house is being listed is also reported. As such, it is possible to record all the listings in a city at a given point in time and use this to analyze local market structure.25
Realtor.com contains all the houses in a given geographic market where the listing real estate agent uses the MLS.26 We ultimately collected data on 90 diverse markets based on market size. Data were initially collected from Realtor.com between October 17 and December 21, 2007. We used the 2005 Rand McNally Atlas and the American Community Survey: American Fact Finder to select the cities.27 We used a stratified sample approach, selecting 17 cities at random from the nation’s 50 largest, 30 cities from among those having populations between 40,000 and 362,850 and 43 cities from among those having populations less than 40,000.28 To ensure geographically separate markets, small towns within 20 miles of a city with over 200,000 residents were excluded.
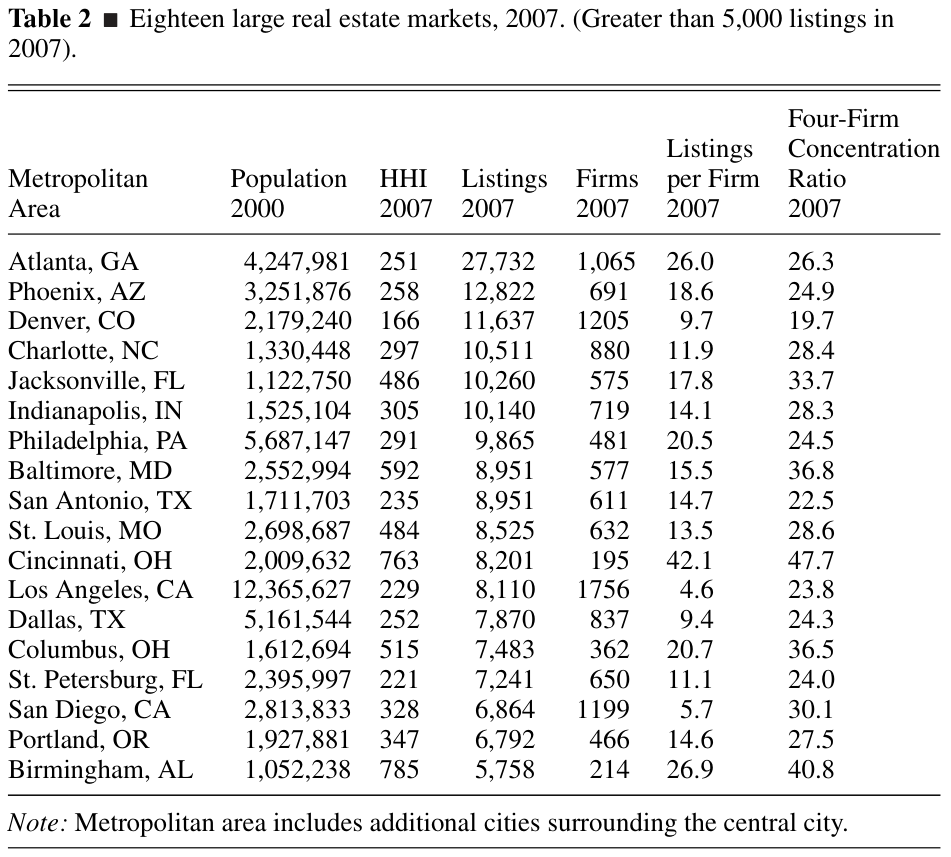
The collection process for an individual market was typically completed within a three-day window, the exceptions being a few very large markets like Atlanta and Los Angeles, which took up to five days. Individual market Web sites were scraped by hand. This process was very labor intensive, which perhaps explains the limited evidence previously collected on local market structures. Table 2 presents a list of the observed markets in the data set. For ease of exposition, the table has been subdivided into three categories based on the number of listings observed. This brought us up to 18 large markets (greater than 5,000 listings), 30 medium markets (between 1,000 and 4,999 listings) and 42 small markets (less than 1,000 listings).
The total number of listings across markets ranged from 103 (Montpelier, VT) to 27,732 (Atlanta, GA), with an average of 3,086 listings per market. There were 20,798 different firms operating with a fairly wide breadth of size, measured by number of listings. Around 35% of observed real estate brokers had only a single home listing, and around half had either one or two listings. Note that in the data only firms with a positive number of listings are visible; thus, firms that were operating but had zero listings on the day of data collection cannot be accounted for. Ninety-nine percent of all firms had fewer than 200 listings and only about 0.1% of all firms had over 1,000 listings. The largest firm, which happened to operate in the largest market (Atlanta, GA), held 2,485 listings at the time of data collection. This firm operated several branches differentiated by geographical focus throughout the Atlanta metropolitan statistical area (MSA) with a wide variety of types of listings.
Table 2. Eighteen large real estate markets, 2007. (Greater than 5,000 listings in 2007)
Notes: Note: Metropolitan area includes additional cities surrounding the central city.
After analyzing the 2007 data, we decided to rescrape the medium and small markets. In fall 2009, we collected data from each of the medium and small markets so that we could analyze changes in market structure over time. 29 Because scraping and cleaning data from the large markets involved such a significant time cost, and because large markets were uniformly unconcentrated, we did not revisit them.
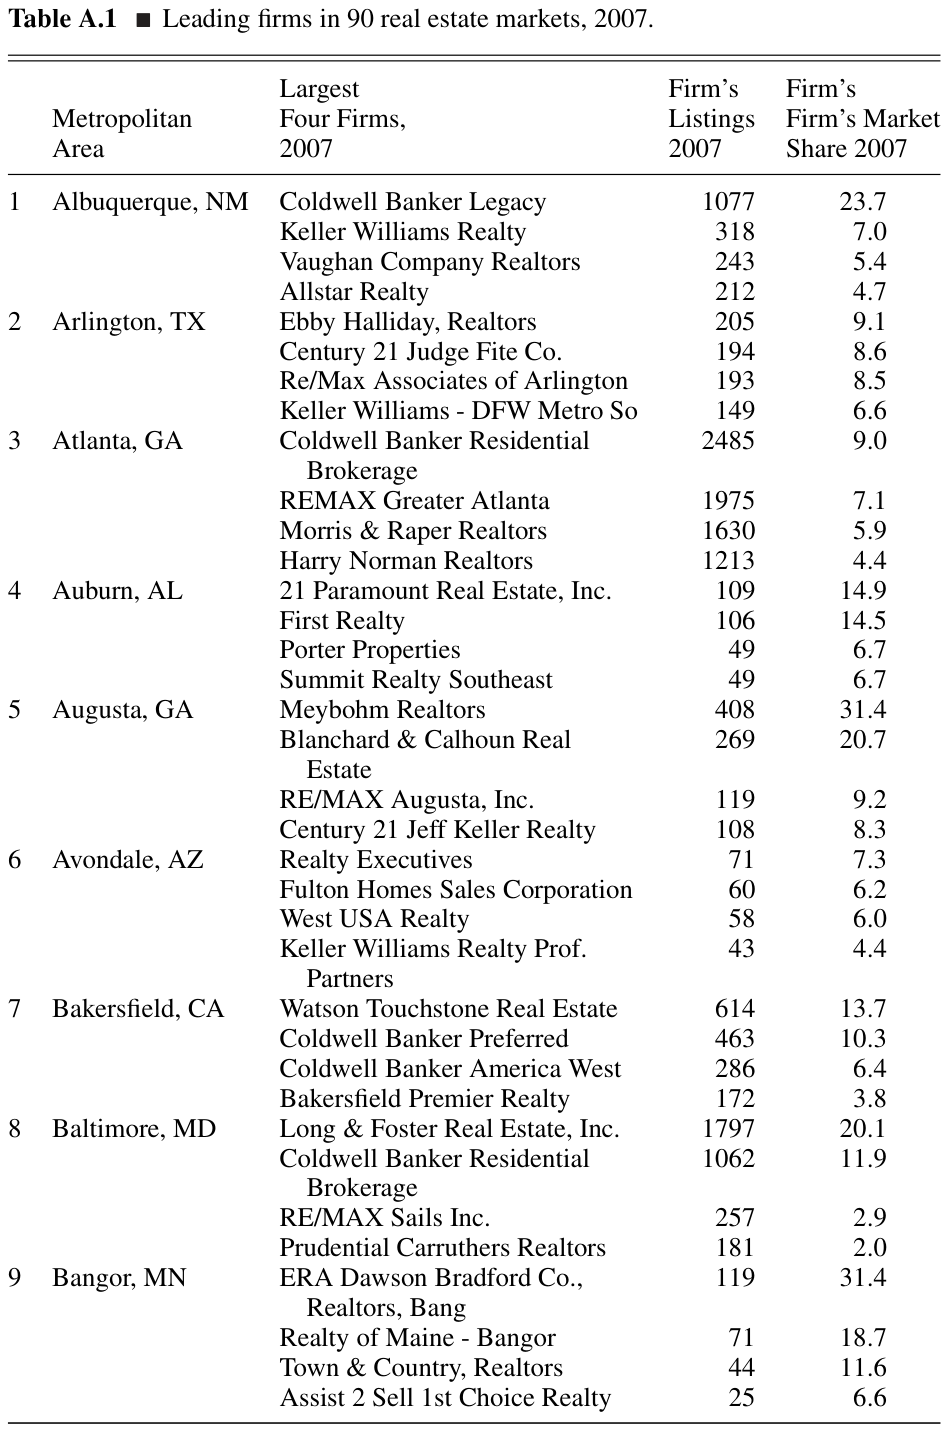
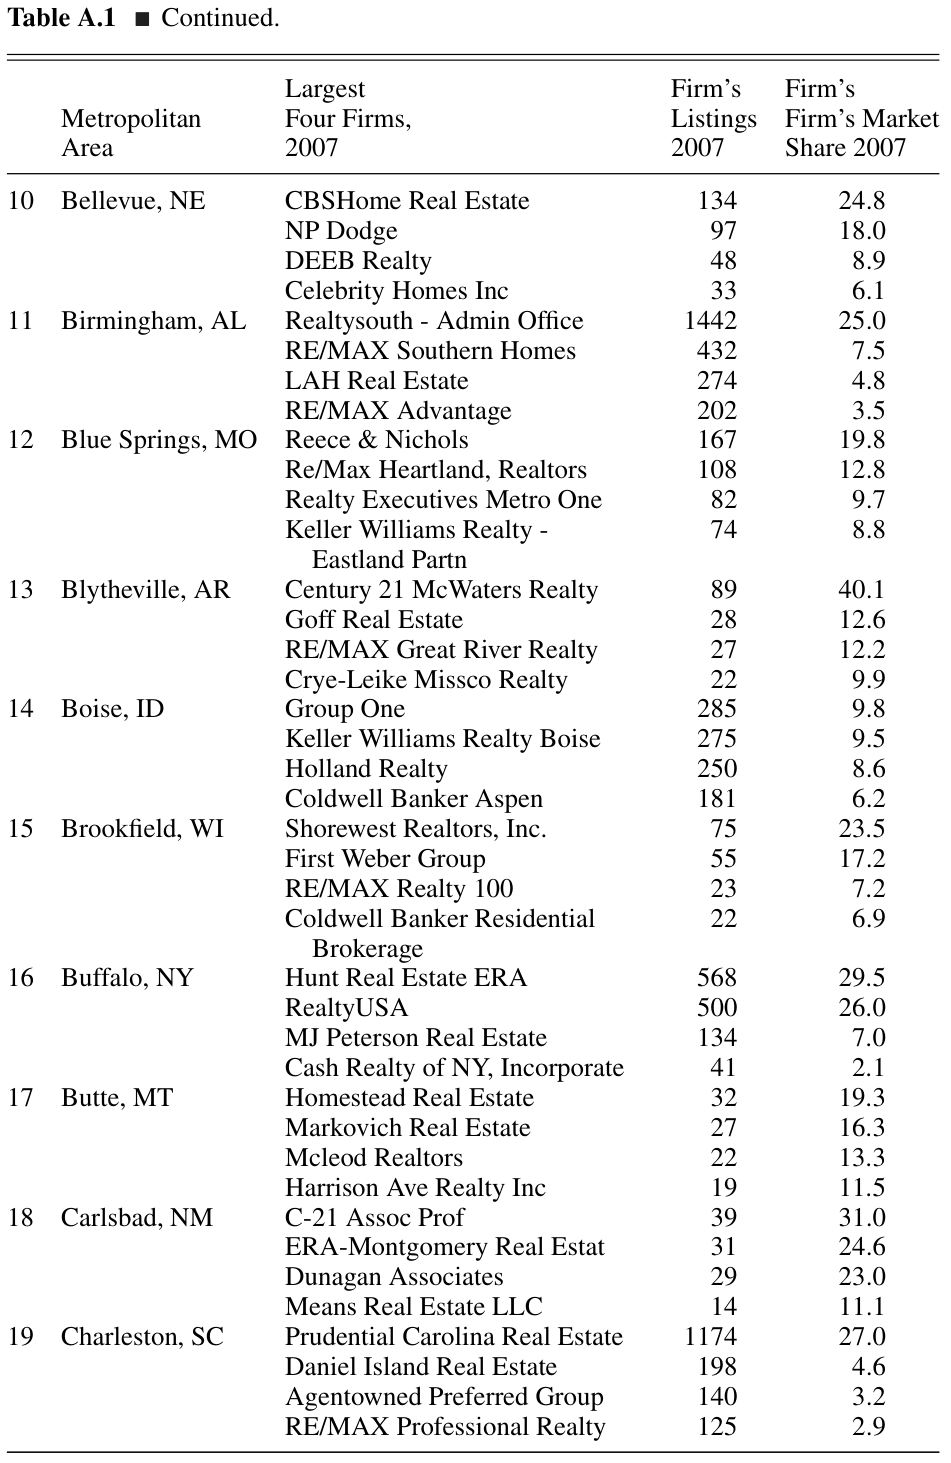
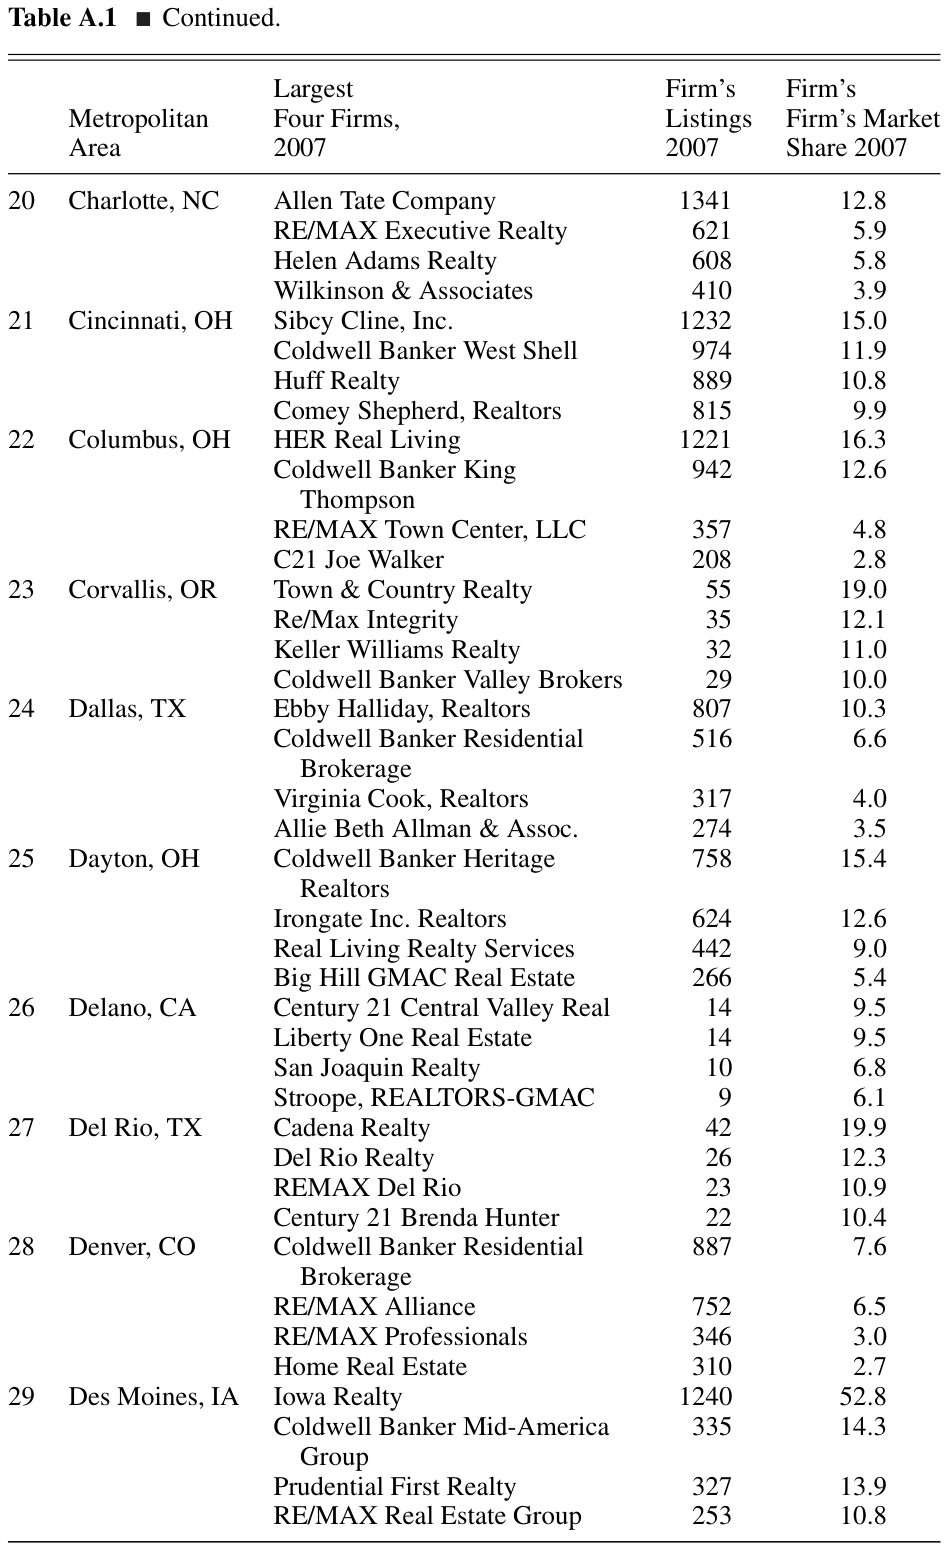
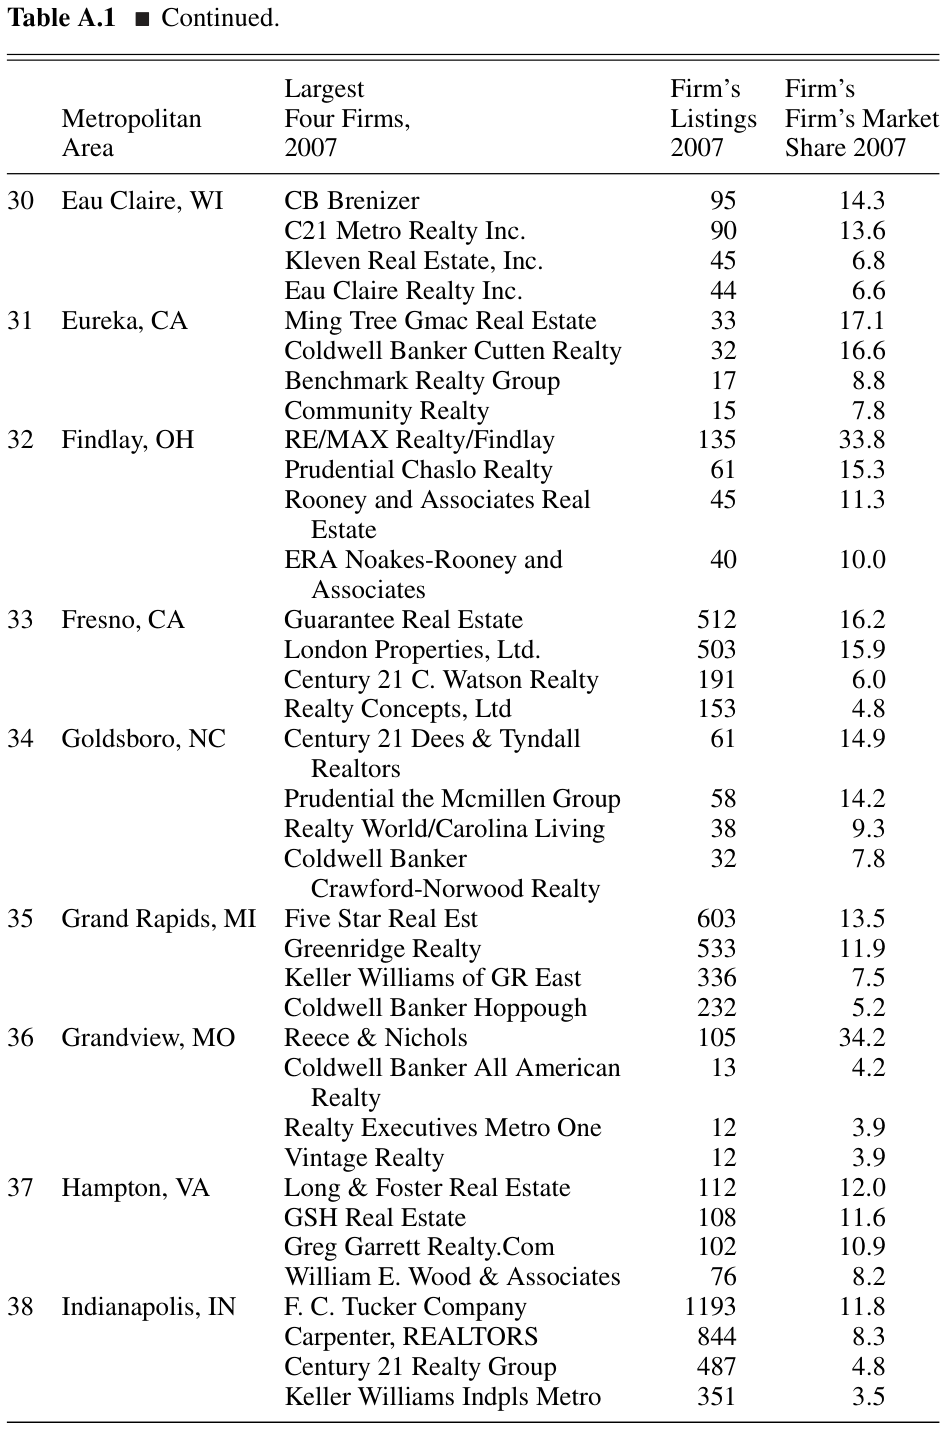
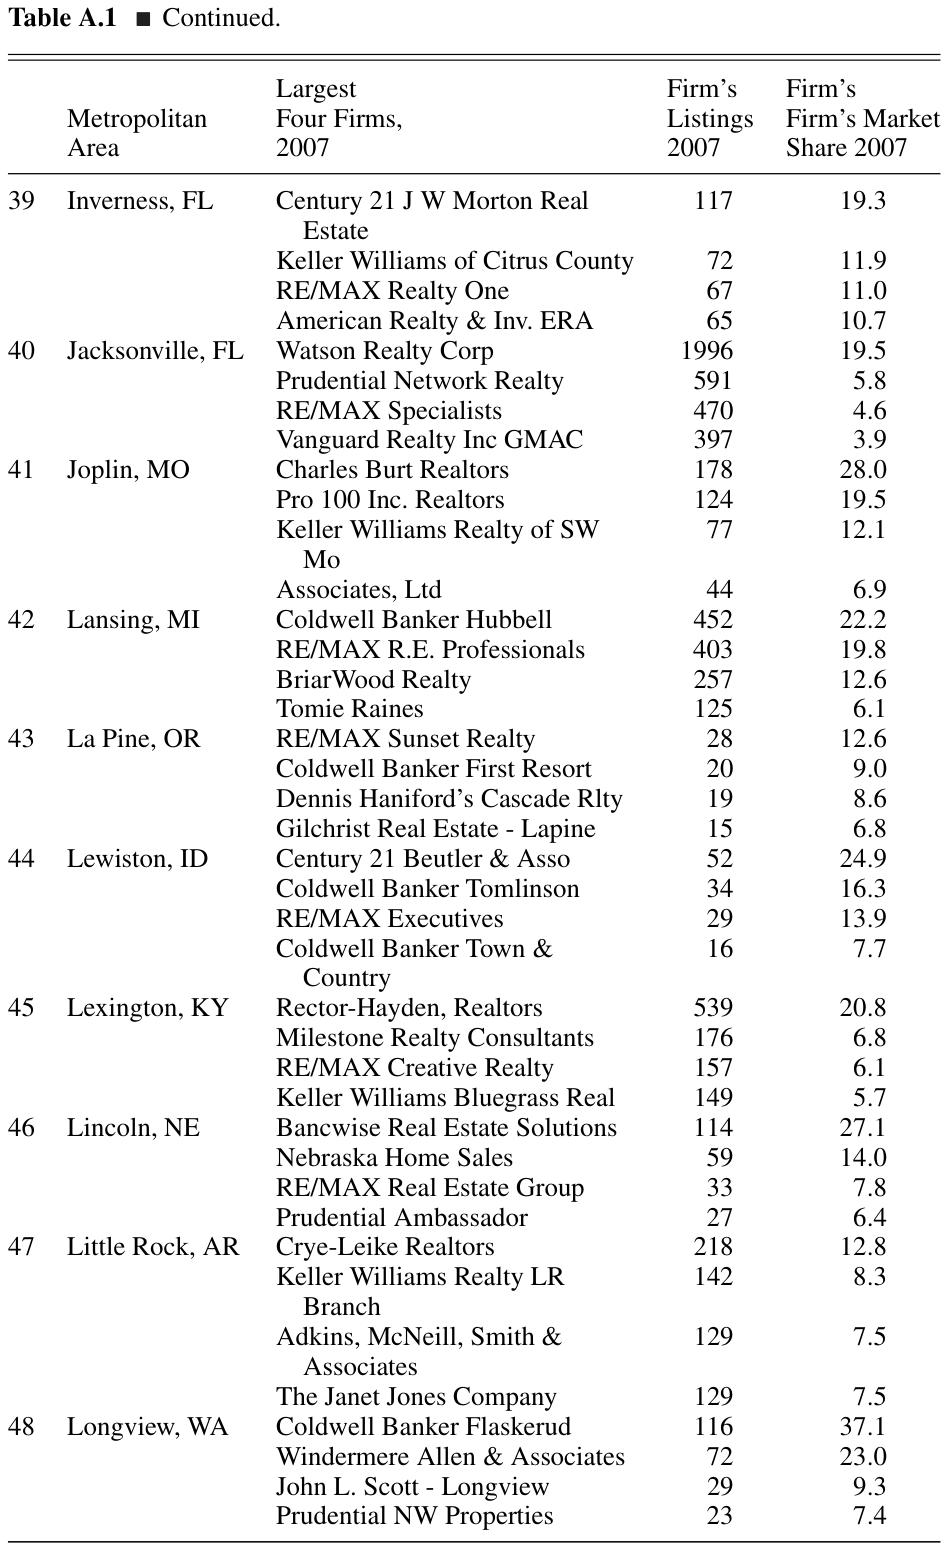
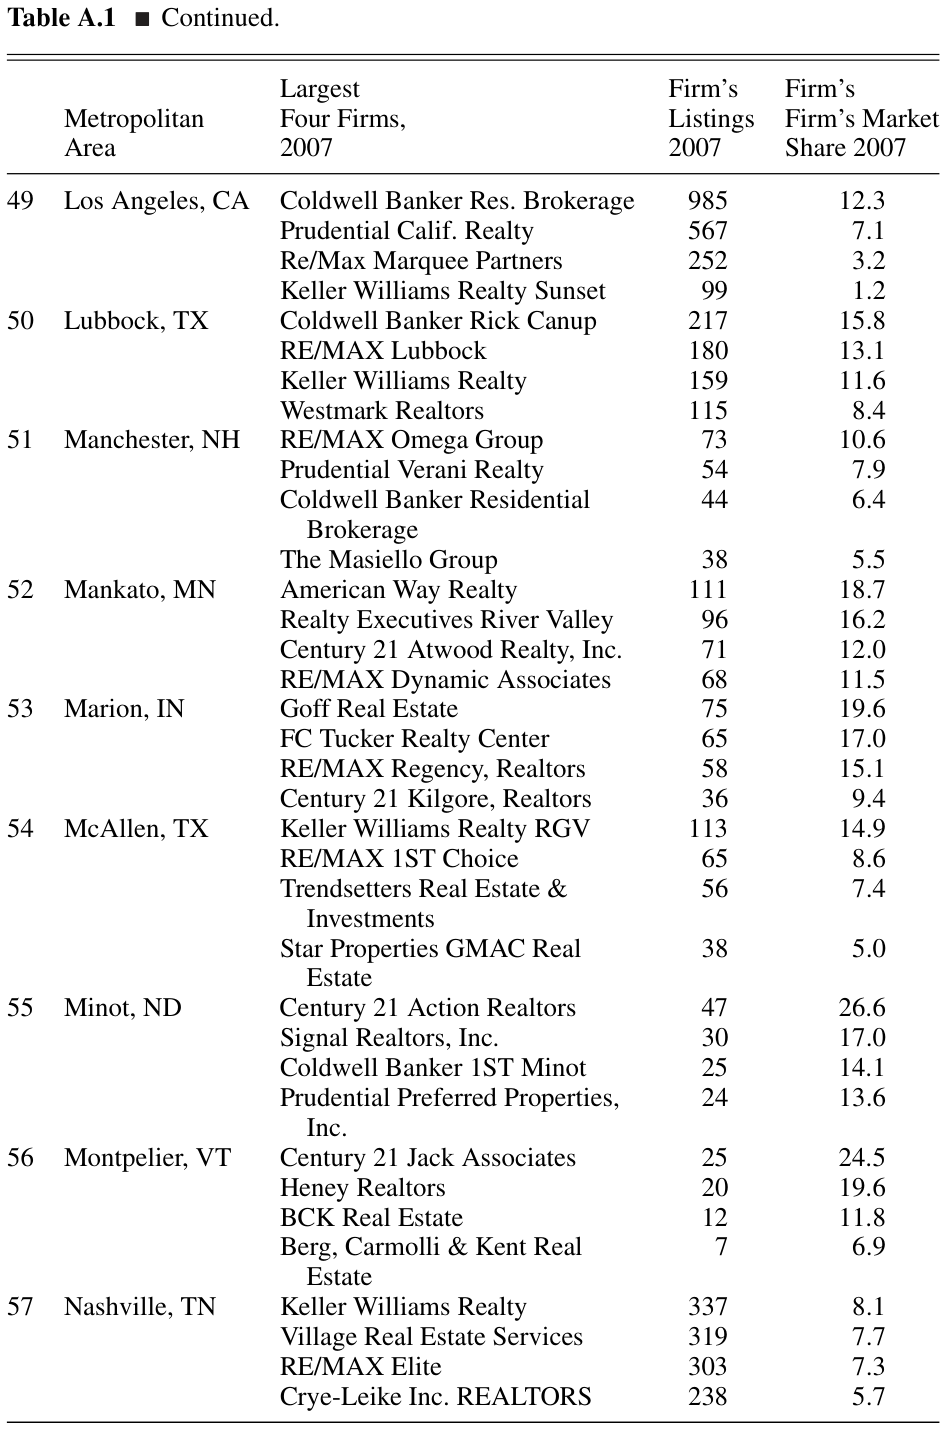
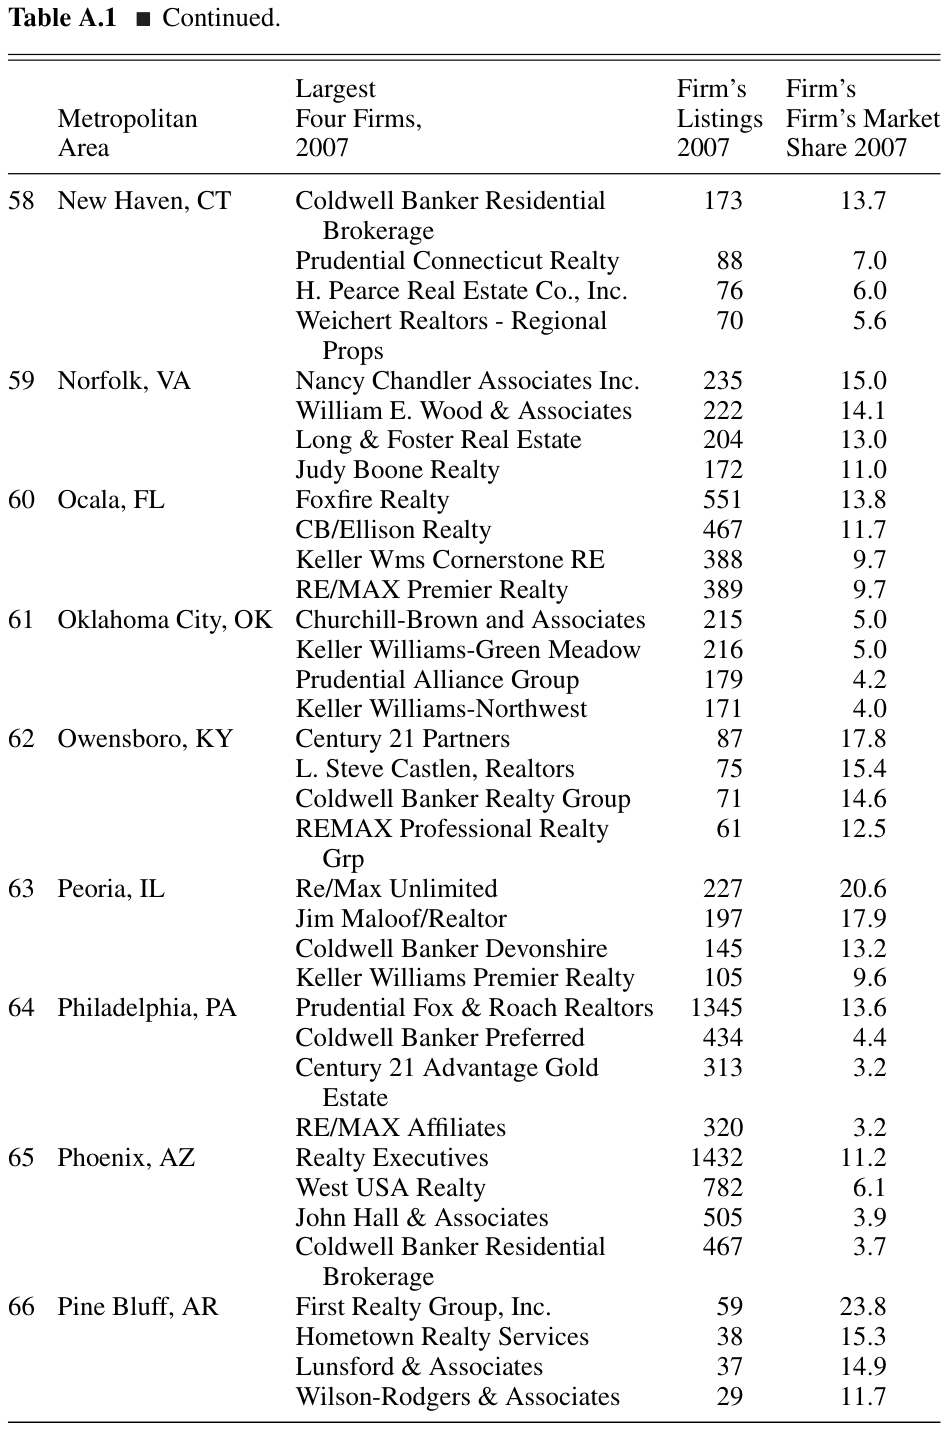
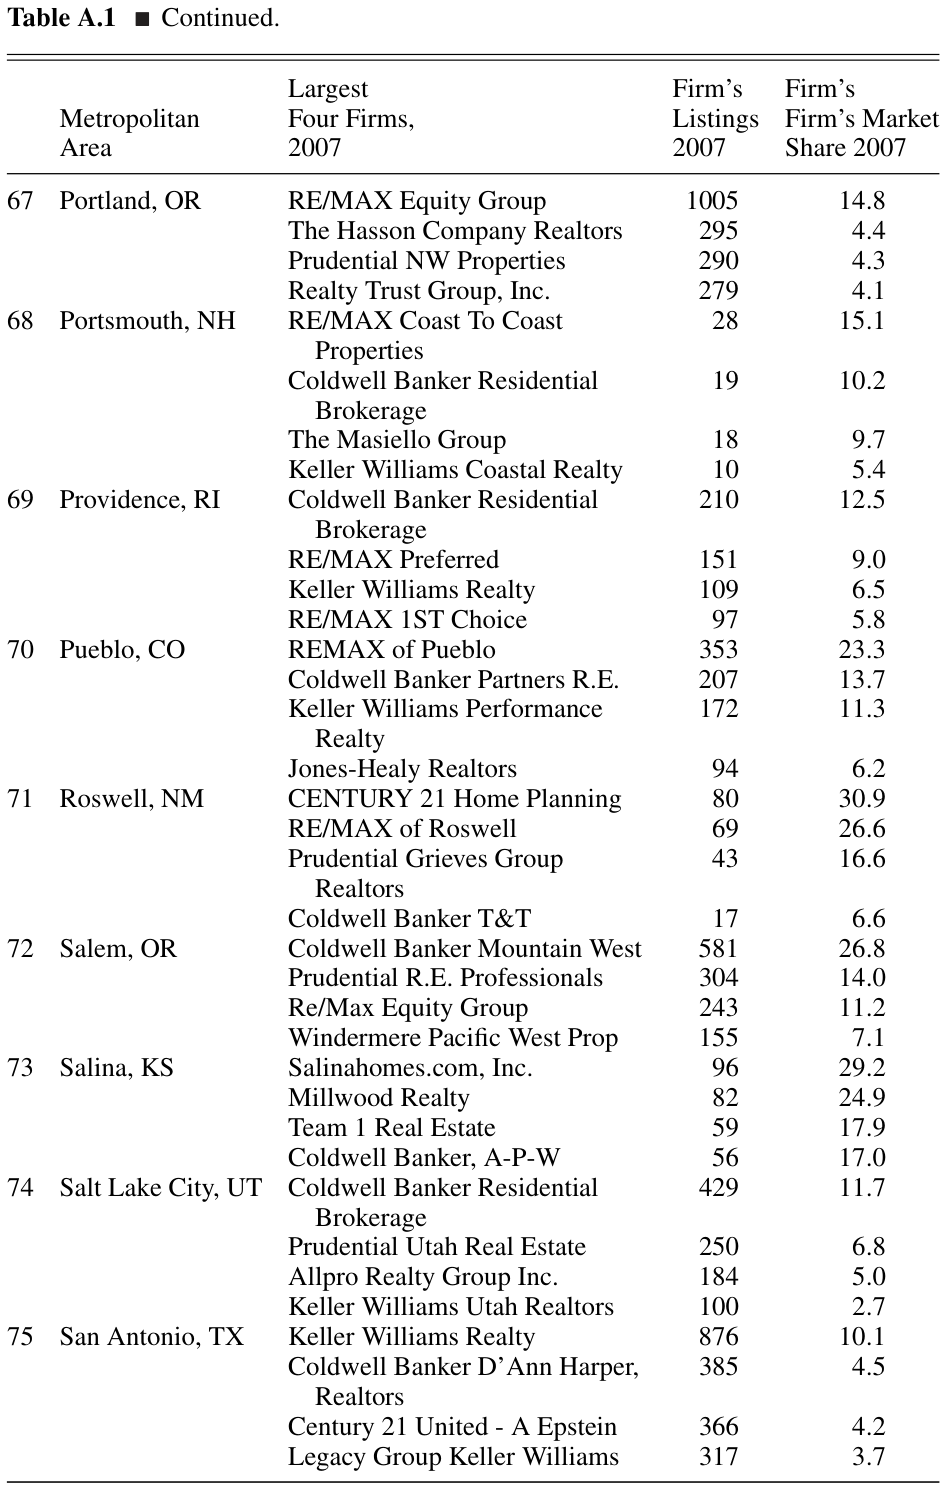
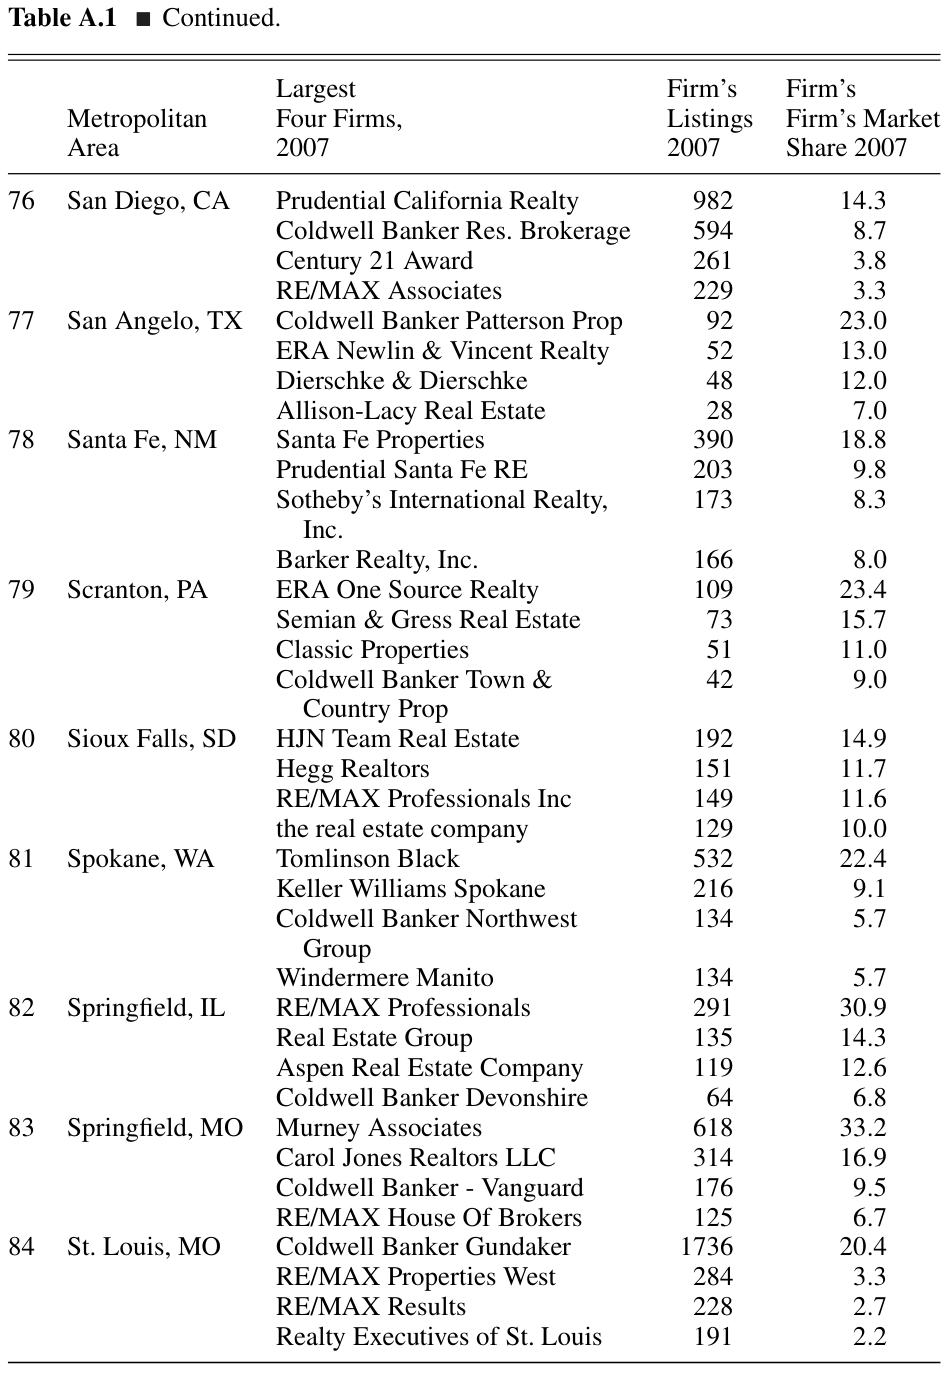
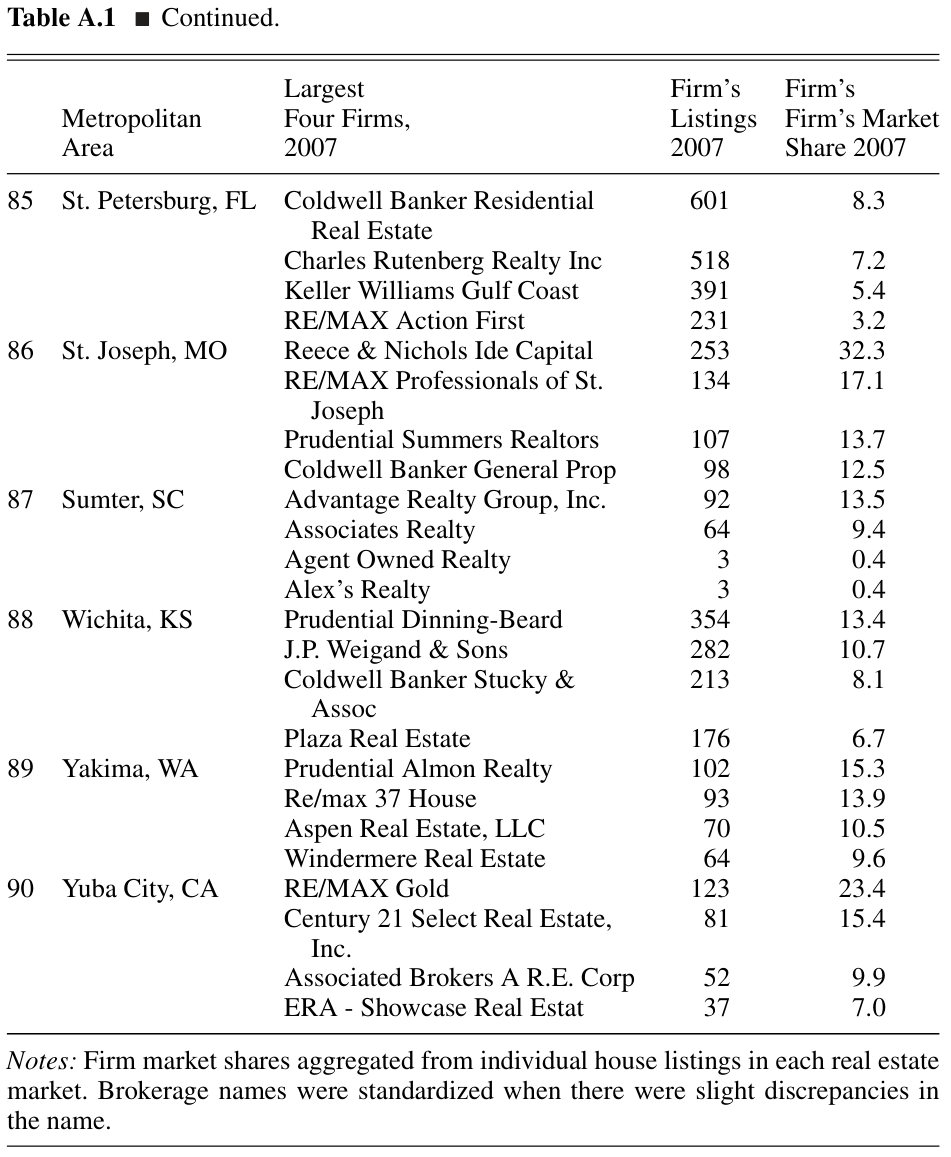
Table 2 contains information for 18 large markets in 2007 on MSA population, number of listings, number of firms, average listings per firm, HHI and four-firm concentration ratio. Table A1. presents additional information for each market on the four largest brokerage agencies, their total listings and their market shares. As can be seen, none of these markets have an HHI that would have invited scrutiny by the DOJ or the FTC if a merger between two brokers had been proposed, that is, these markets all fall into the competitive category because .30 The average HHI across the 18 large markets in 2007 was 378.
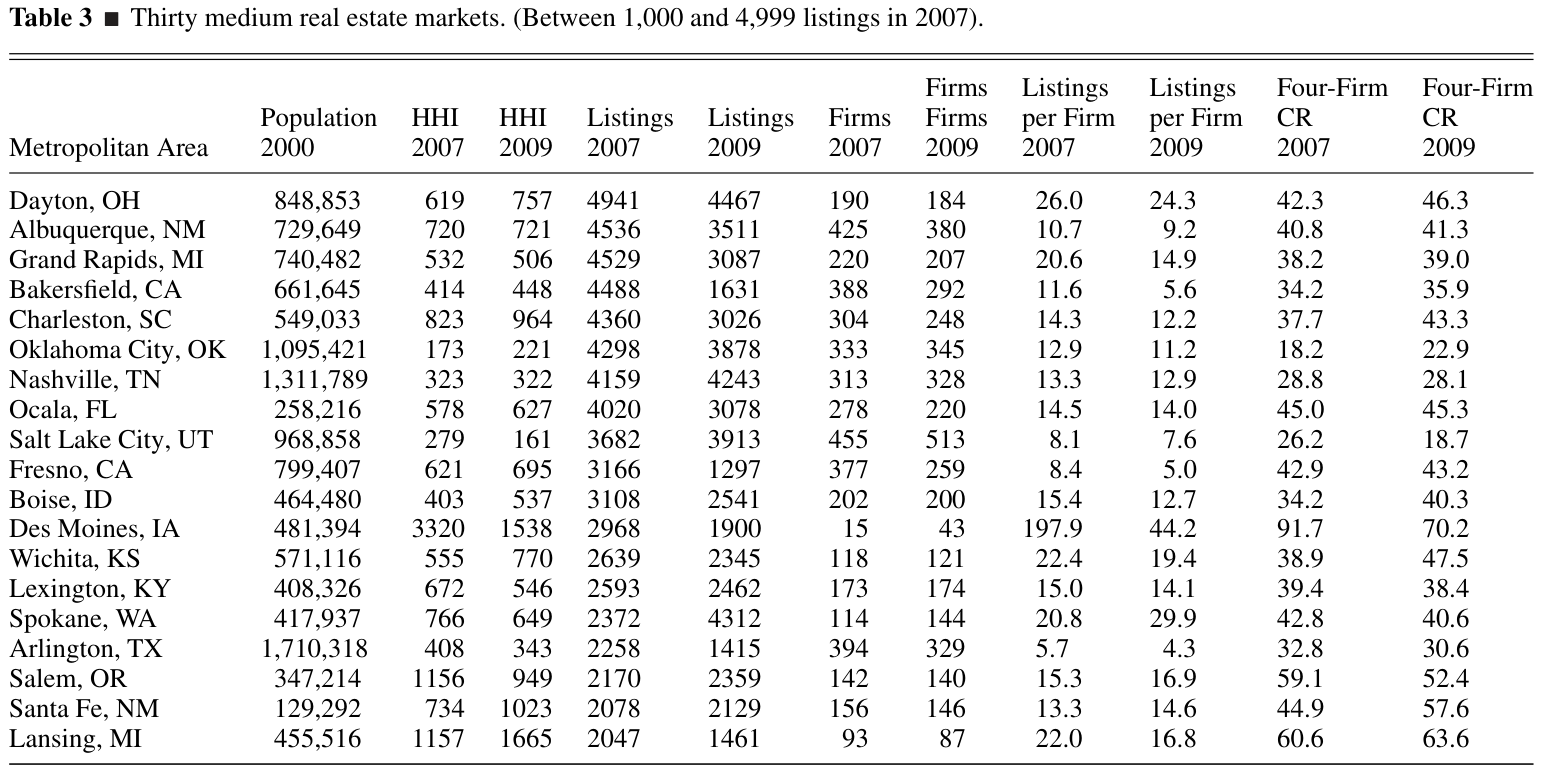
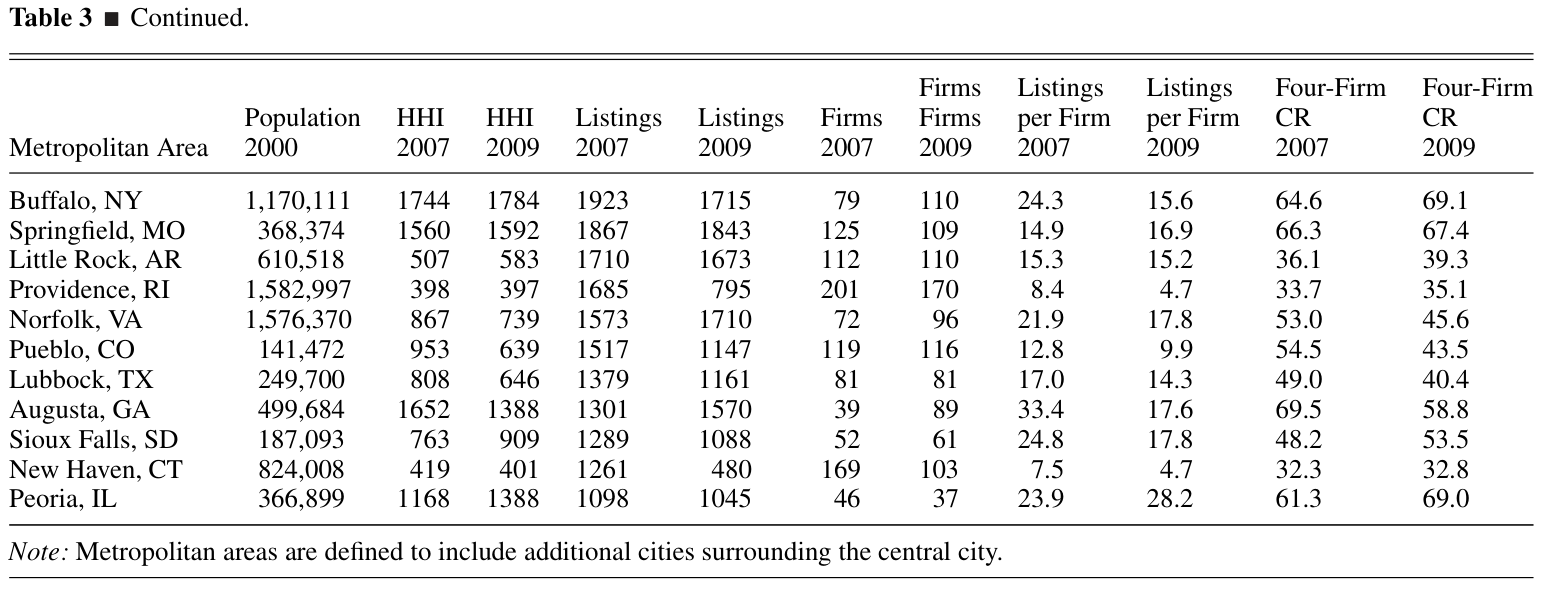
Table 3 contains information for 30 medium-sized markets, that is, markets having between 1,000 and 4,999 listings for 2007. Again, MSA population, number of listings, number of firms, average listings per firm, HHI and four-firm concentration ratio are included. The average HHI in these medium-sized markets in 2007 was 837, falling to 797 in 2009. In 2007, seven of the 30 markets had HHIs greater than 1,000: Des Moines, IA, Salem, OR, Lansing, MI, Buffalo, NY, Springfield, MO, Augusta, GA and Peoria, IL. Only Des Moines, IA, had an HHI that exceeded 1,800, which in 2007 would have been classified as highly concentrated according to the DOJ/FTC Horizontal Merger Guidelines.31 Interestingly, the HHI in Des Moines declined from 3,320 to 1,538 between 2007 and 2009. Our scraping approach, in this particular market, corroborates the concentration findings of the 2007 FTC/DOJ report.
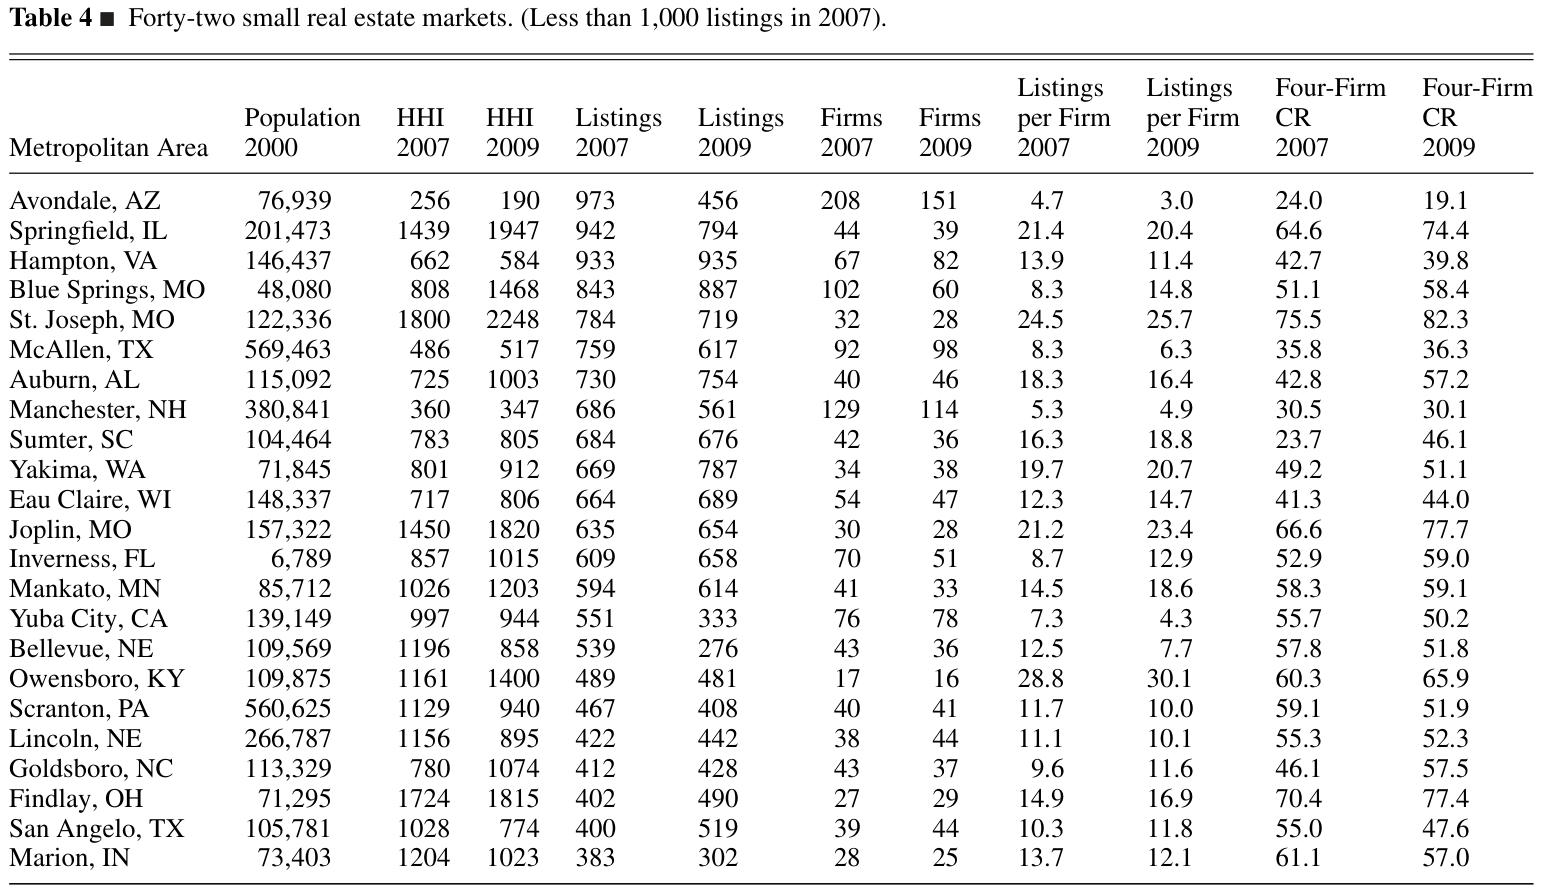
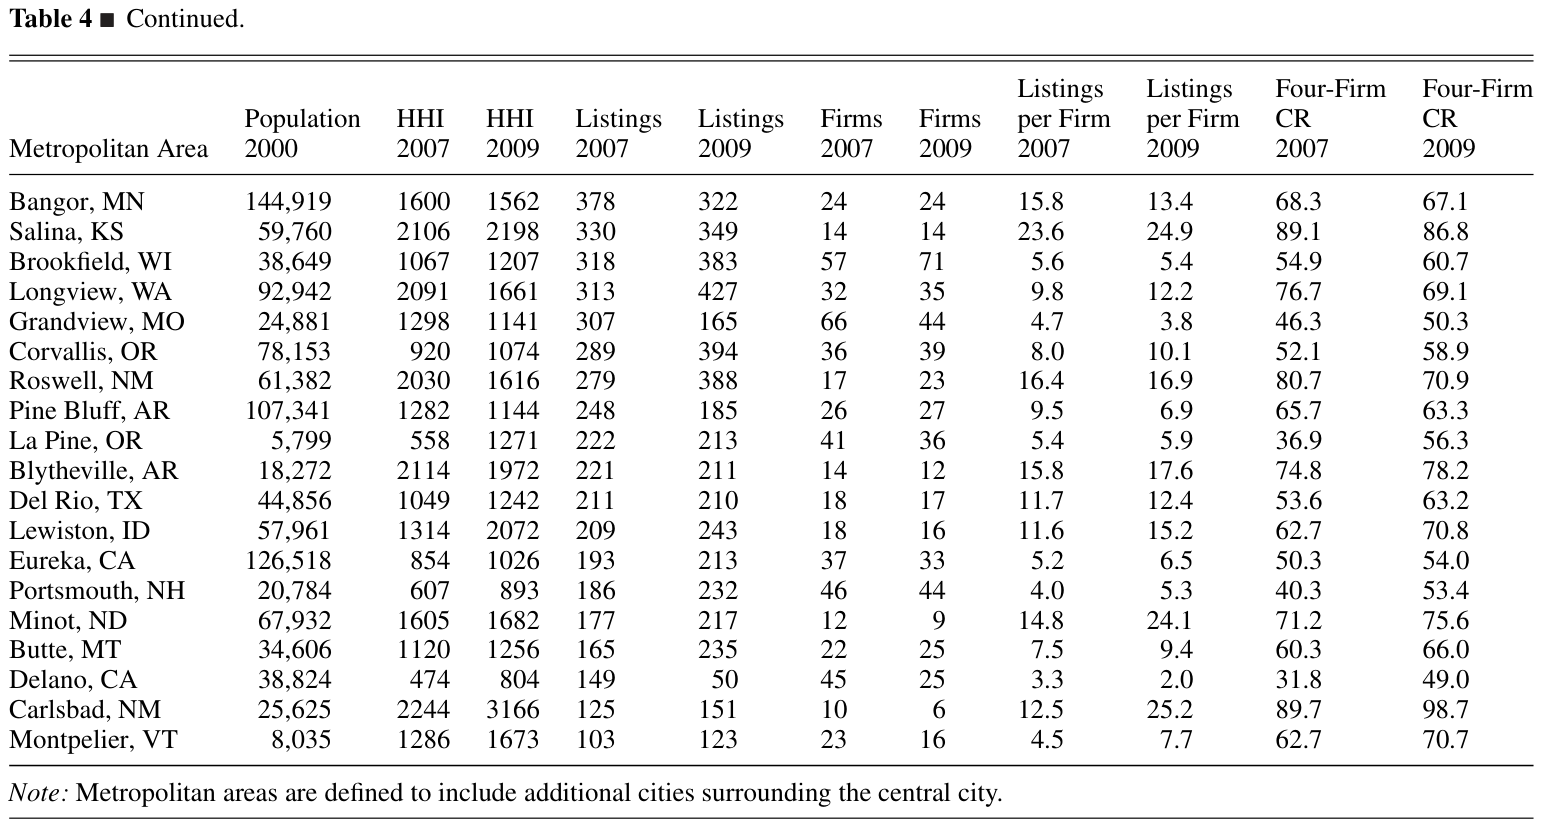
Other medium-sized markets experienced significant changes in market structure over the two-year interval in our sample. The HHI increased from 734 to 1,023 in Santa Fe, NM, and from 1,157 to 1,665 in Lansing, MI. The HHI decreased from 953 to 639 in Pueblo, CO, and from 1,652 to 1,388 in Augusta, GA. Considerable variation in individual brokerage firm market shares and market ranks also occurred over the two-year observation period.32 The most extreme change occurred in Des Moines, IA, where market leader Iowa Realty saw its market share decline from 53% in 2007 to 29% in 2009. Iowa Realty was apparently the firm singled out by the FTC/DOJ in their 2007 report (p. 32), which offered Des Moines as an example of a highly concentrated market. Table 4 contains information for 42 small markets, that is, markets having fewer than 1,000 listings, for 2007. If concentration is a problem in residential real estate brokerage, it is in smaller markets where we would expect to observe it.33 The average HHI in small markets was 1,177 in 2007 and 1,308 in 2009, indicating that smaller markets are considerably more concentrated than larger markets. In 2007, 25 of the 42 small markets had HHIs greater than 1,000, with the HHI exceeding 1,800 in six markets. The highest levels of market concentration occurred in Blytheville, AR, with an HHI of 2,114, and Carlsbad, NM, with an HHI of 2,244. Both are very small markets, with 221 and 125 total listings in 2007, respectively. Lincoln, NE—another market singled out by the FTC/DOJ report—had an HHI of 1,156 in 2007 and 895 in 2009.
Table 3. Thirty medium real estate markets. (Between 1,000 and 4,999 listings in 2007)
Notes: Note: Metropolitan areas are defined to include additional cities surrounding the central city.
Overall, market structures fluctuated considerably between 2007 and 2009 in the small market sample. In Carlsbad, NM, for example, the HHI increased from 2,244 to 3,166, while in Roswell, NM, the HHI decreased from 2,030 to 1,616. Sizable changes also occurred in individual firm market shares. In Blue Springs, MO, for example, Reece & Nichols increased their market share from 19.8% in 2007 to 34.0% in 2009. In La Pine, OR, RE/MAX Sunset Realty increased their market share from 12.6% to 30.5% over the same period.
There is evidence from these data of concentration in some small markets, but not in medium and large markets. And, market shares are fluid, in that there are nontrivial changes from 2007 to 2009, especially in a few instances when the market leader had a sizable share in 2007. These results suggest that further longitudinal analysis of market structure in residential real estate brokerage would be useful.
Longitudinal Analysis of Market Concentration
Results from the cross-sectional analysis raise the following question: How stable are firm market shares over time? One new contribution we are able to make is to look at the size distribution of firms in a single market over an extended period of time. We have collected extensive data on market transactions and the dollar volume of sales, for both the listing broker and the buying-side broker, for Louisville, KY, from January of 2000 through November of 2008.
Table 4. Forty-two small real estate markets. (Less than 1,000 listings in 2007)
Notes:Note: All calculations based on transactions in Louisville MLS data. The 2008 data go through November 29, 2008.
These data allow us to track firms from the smallest to the largest over the entire time period. We are thus able to understand changes in the market positions of industry leaders, as well as survival and growth of firms on the competitive fringe.
We obtained these data from the MLS of Louisville, KY, which has a population of roughly 500,000 residents, with an additional 700,000 in the metro area. Information was available for all homes sold through the MLS from January 1, 2000, through November 29, 2008.34 Observations with a missing firm identifier variable, either on the listing or the selling side, were not included in the analysis. The primary data set used for analysis begins with 113,014 sold houses. The average house was 1,880 square feet, was 30.7 years old and had three bedrooms, two full baths, a basement and central air-conditioning. It was on the market for 74 days and sold for a nominal price of $162,457. The median selling price was lower, at $118,000, indicating that the distribution of sales prices is skewed.
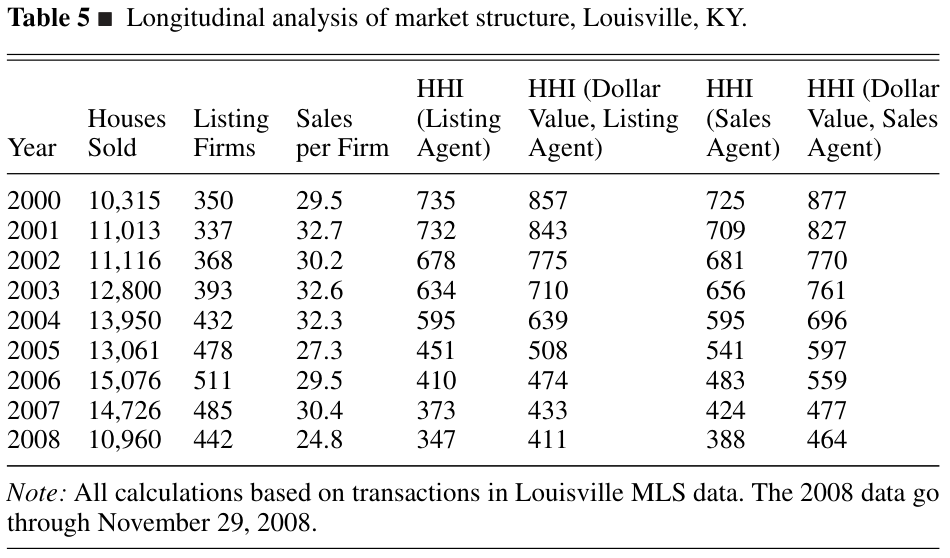
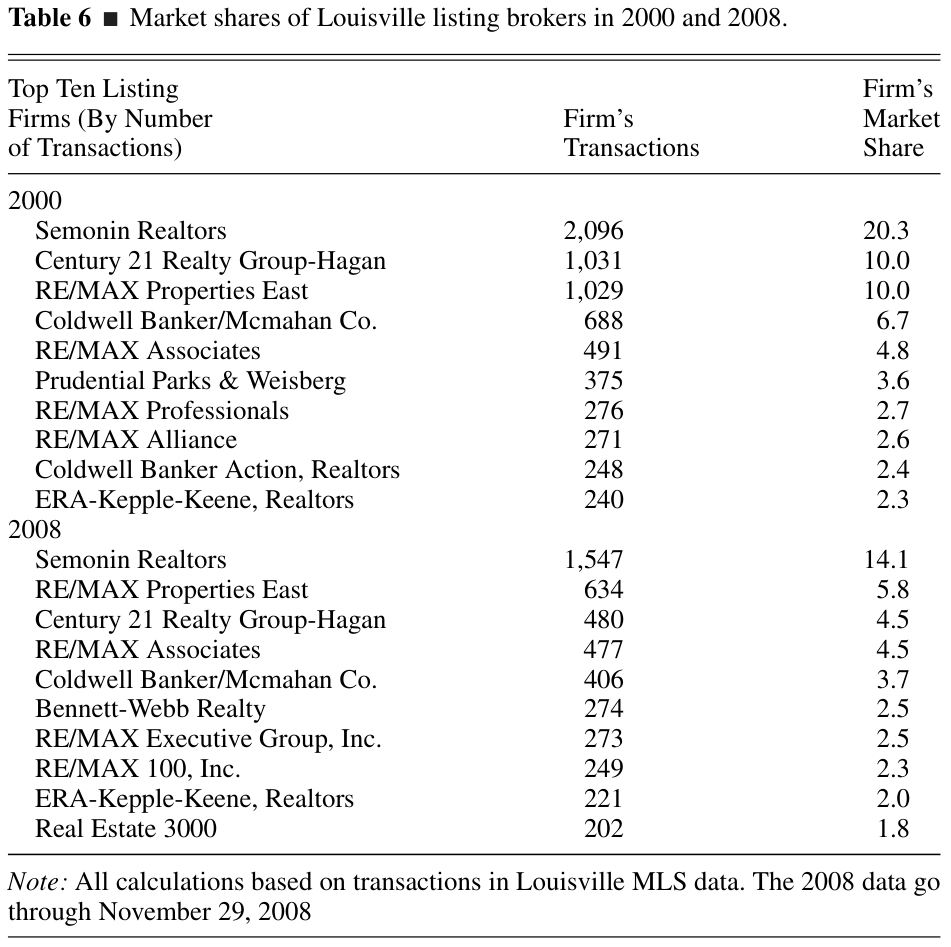
Table 5 contains information for each year from 2000 through 2008 on the number of transactions, the number of listing firms, the average number of sales per firm and the HHI. We calculate HHIs for both the selling side and the buying side, based on both the number and the dollar volume of sales. Table 6 includes the identity and market share for 2000 and for 2008 of the top ten residential brokerage firms based on the number of transactions in which the firm was the listing broker. 35 The residential real estate boom and bust are immediately evident in these data.
Table 6. Market shares of Louisville listing brokers in 2000 and 2008
Notes: Note: All calculations based on transactions in Louisville MLS data. The 2008 data go through November 29, 2008
The number of houses sold increases steadily from 10,315 in 2000 to 15,076 in 2006. The number of real estate brokers with at least one listing increased from 350 to 511 over the same period.36 The average number of sales per firm stayed fairly steady, hovering around 30 transactions per year. After the 2006 peak, the number of houses sold in the first 11 months of 2008 declined sharply to 10,960. The number of listing brokers fell to 442, and the average transactions per firm fell to 24.8.
The market became increasingly less concentrated over the 2000 to 2008 period, through both boom and bust. We have computed HHIs using market shares of listing brokers (seller side), calculated by both number of transactions and dollar volume of transactions. We have also calculated HHIs using market shares of buyer-side brokers by number of transactions and dollar volume of transactions. The steady decline in concentration when the housing market was thriving and when the market declined is clearly evident regardless of which of the four measures is used.
Closer scrutiny of the different measures turns up several interesting findings. HHIs using the number of transactions are smaller than HHIs using the dollar volume of sales. This result implies that higher-priced houses are disproportionately handled by larger real estate brokerage firms. HHIs declined most sharply in the years immediately before and immediately after the peak year of 2006. This result suggests that larger firms lost market share to smaller firms and new entrants during years of rapid market growth, but when the market turned down sharply these smaller firms and new entrants were able to hold on to their business relatively better than the larger firms.
Market shares and rank of the largest real estate firms are fairly stable over the entire period of observation, even though market concentration was declining overall. From 2000 until 2002, the identities of the top ten listing firms do not change. In each of the years 2003, 2004, 2006 and 2007, one new firm cracks the top ten. Two new entrants show up in 2005. Only in 2008, a year of considerable turmoil in residential real estate, is there any significant movement in and out of the top of the market. One other observation is that the largest firms generally do not seem to specialize in representing either sellers or buyers. For example, nine of the top ten top listing firms in 2000 were also among the top ten firms representing buyers in housing transactions.
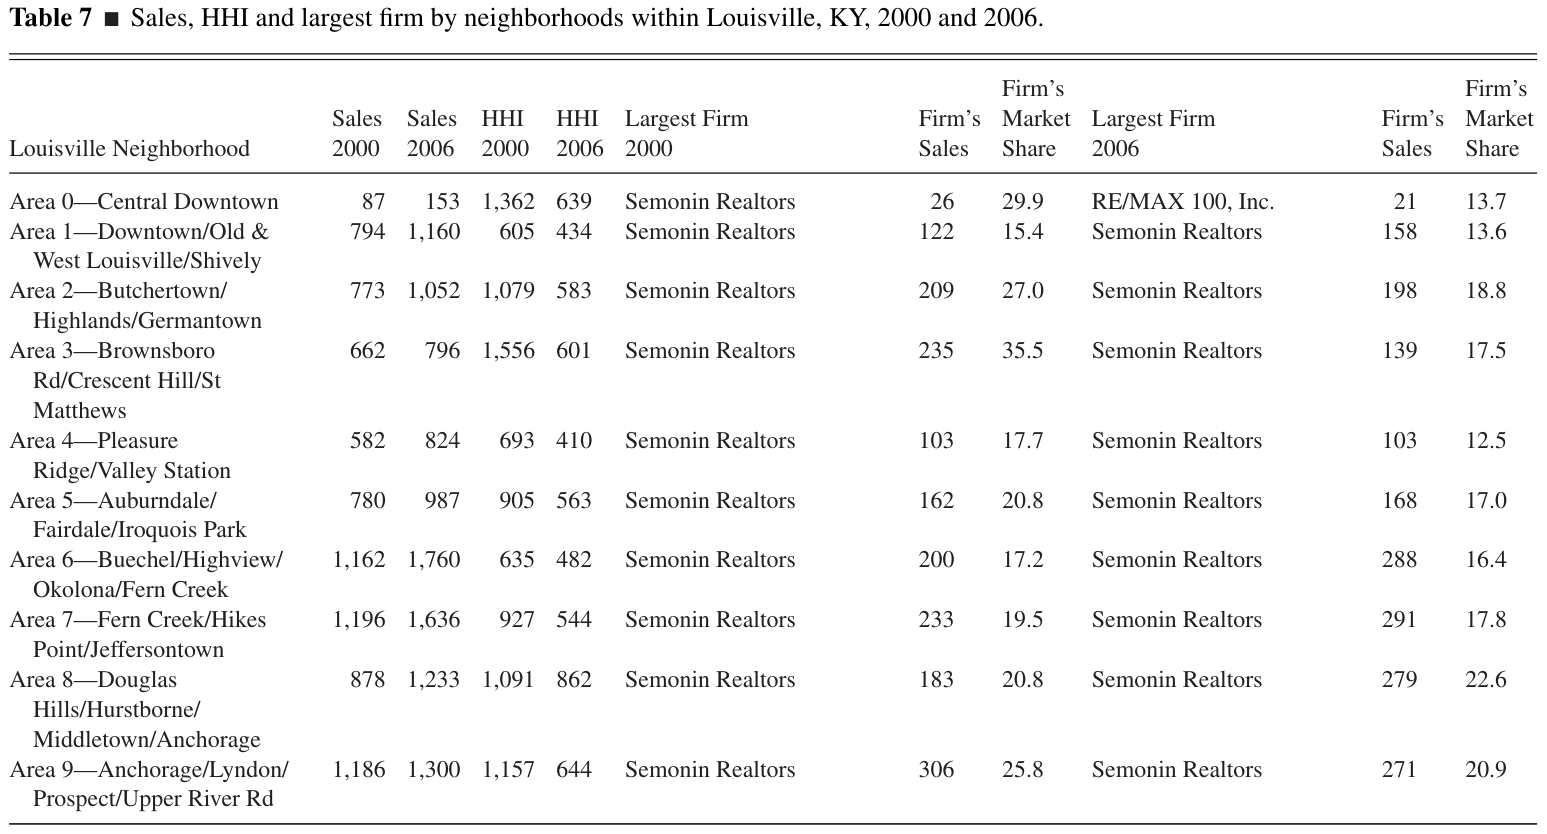
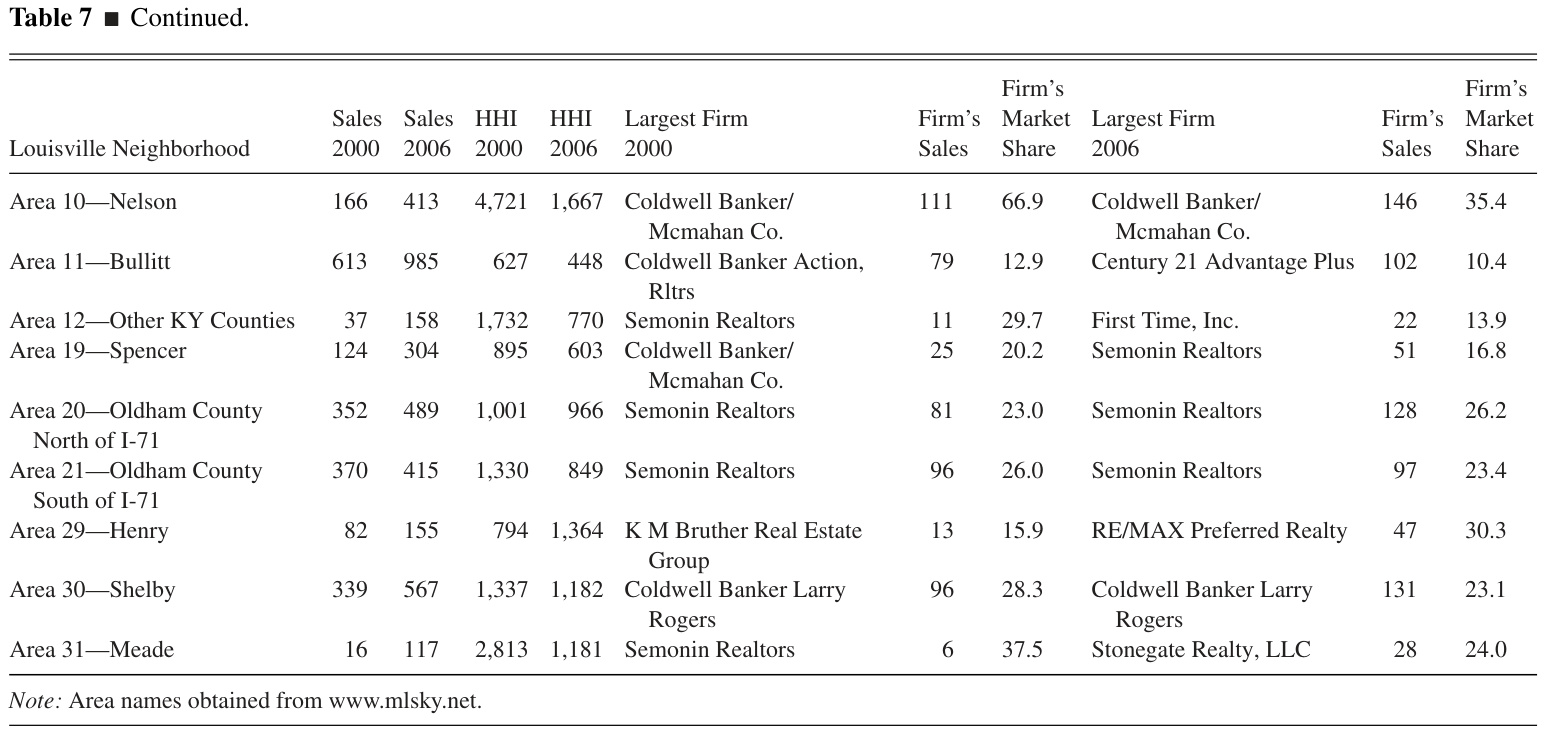
The overall geographic market is fairly unconcentrated; however, it is possible that distinct submarkets exist and that real estate brokers specialize by geographic region within the greater metropolitan area. To determine whether concentrated submarkets exist, we analyzed sales in distinct areas within the city.37 Table 7 contains data on the number of sales, HHI and identities and market shares of the top firm for 2000 and 2006 in 19 different geographic areas within the greater Louisville metropolitan area. This information allows us to analyze whether there are significant geographic submarkets within the area covered by the MLS, where tacit collusion might evolve if significant pockets of concentration exist.
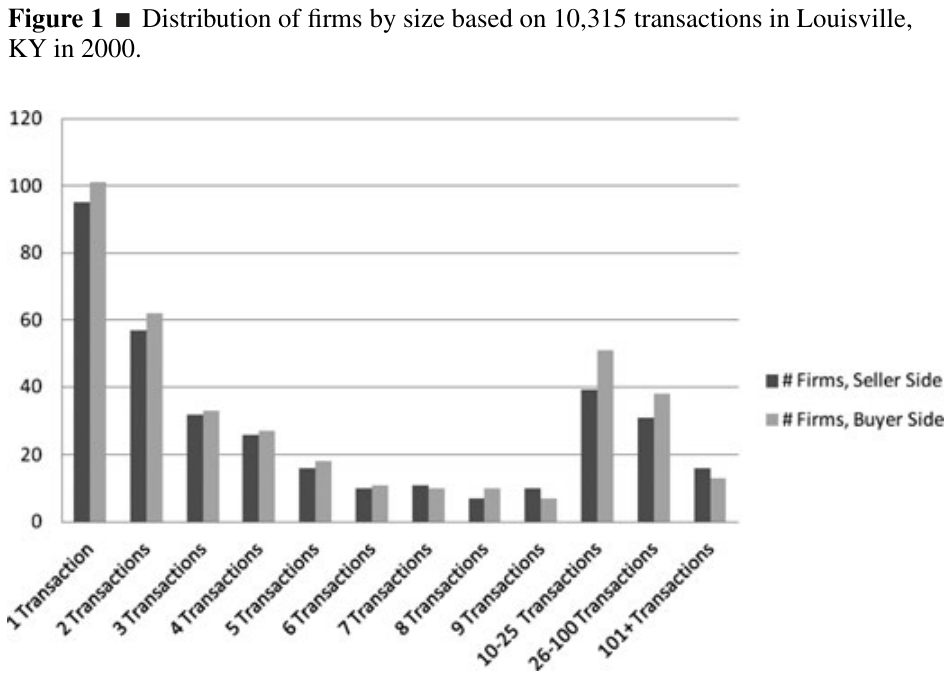
Figure 1. Distribution of firms by size based on 10,315 transactions in Louisville, KY in 2000
Caption: Distribution of firms by size based on 10,315 transactions in Louisville, KY in 2000.
While several of these smaller geographic areas exhibit greater concentration than the entire urban area, they also exhibit much greater fluidity in market shares over time. For example, in Area 10 (Nelson County) the HHI in 2000 was 4,721 and the largest firm had a market share of 66.9%. That area experienced considerable growth in the number of transactions between 2000 and 2006, the HHI declined to 1,667 and the largest firm’s market share dropped to 35.4%. Similarly, in Area 31 (Meade County), the number of transactions increased almost by an order of magnitude from 2000 to 2006, the HHI declined from 2,812 to 1,181 and the largest firm’s market share dropped from 37.5% to 9.4%. Based on this volatility, it is no evidence that these smaller areas constitute distinct geographic markets.
Table 7. Sales, HHI and largest firm by neighborhoods within Louisville, KY, 2000 and 2006
Notes: Note: Area names obtained from www.mlsky.net.
So far, we have focused on market shares and changes in those shares for the largest firms in the market. With this data set, we can also gain some understanding of the market behavior of smaller firms, including those who show up in market transactions data in one year but are absent because they had no transactions in the next. Figure 1 presents a histogram of the number of listing brokers having one sale, two sales, three sales, etc . in 2000, along with the number of brokers representing the buyer side having one sale, two sales, etc . A large majority of residential real estate brokerage firms are fairly small. Among the 350 brokers having at least one listing, 95 (27%) had just one listing and 57 (16%)
had just two listings for the entire year.
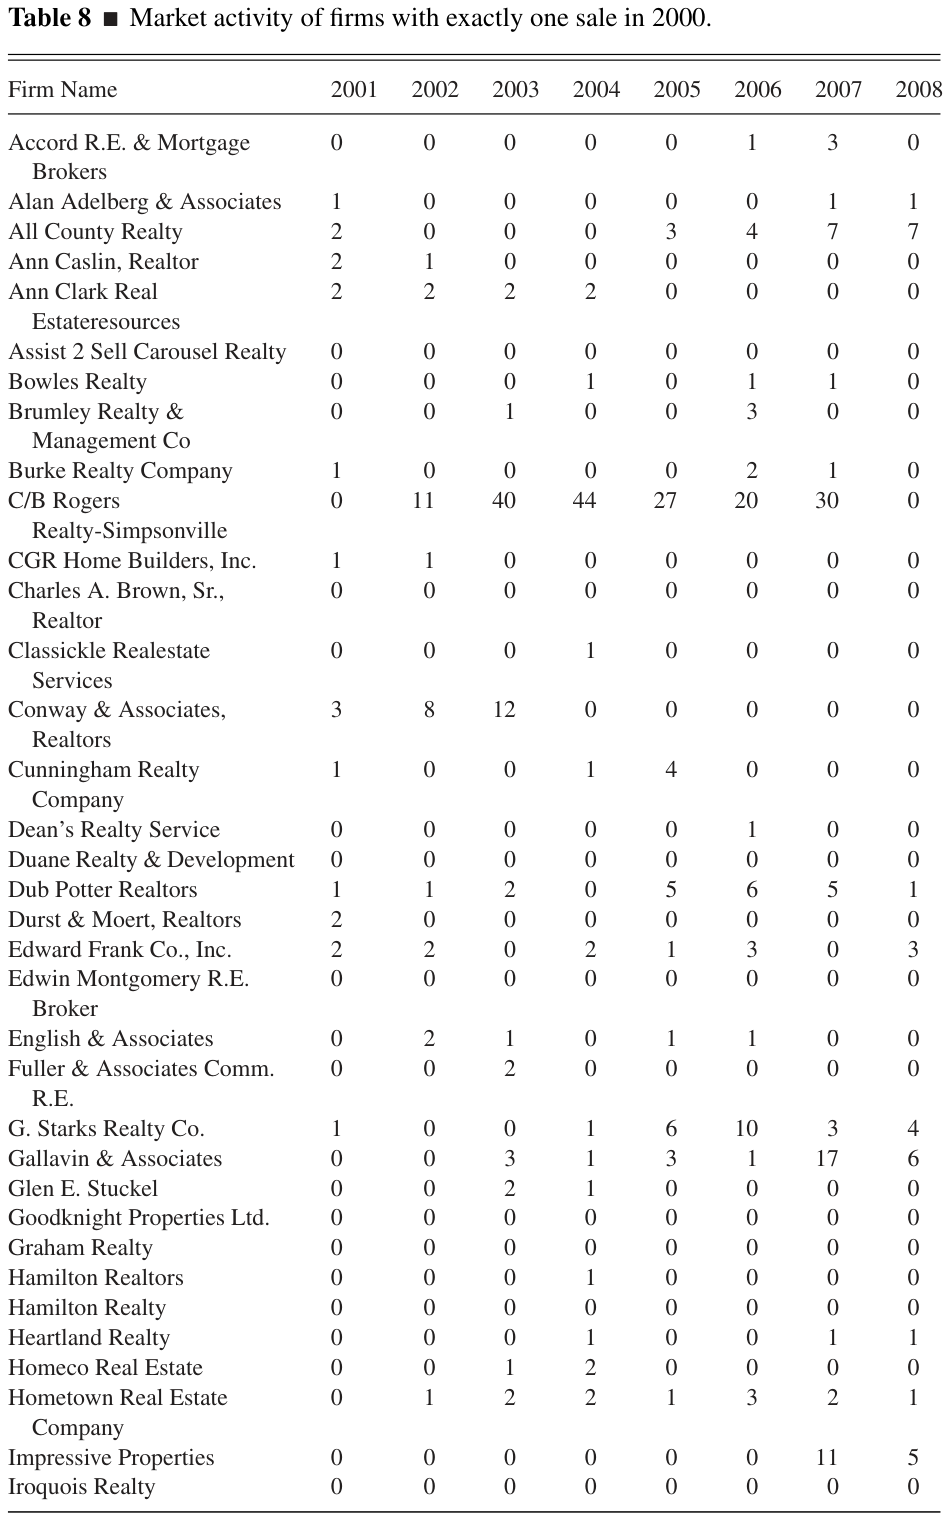
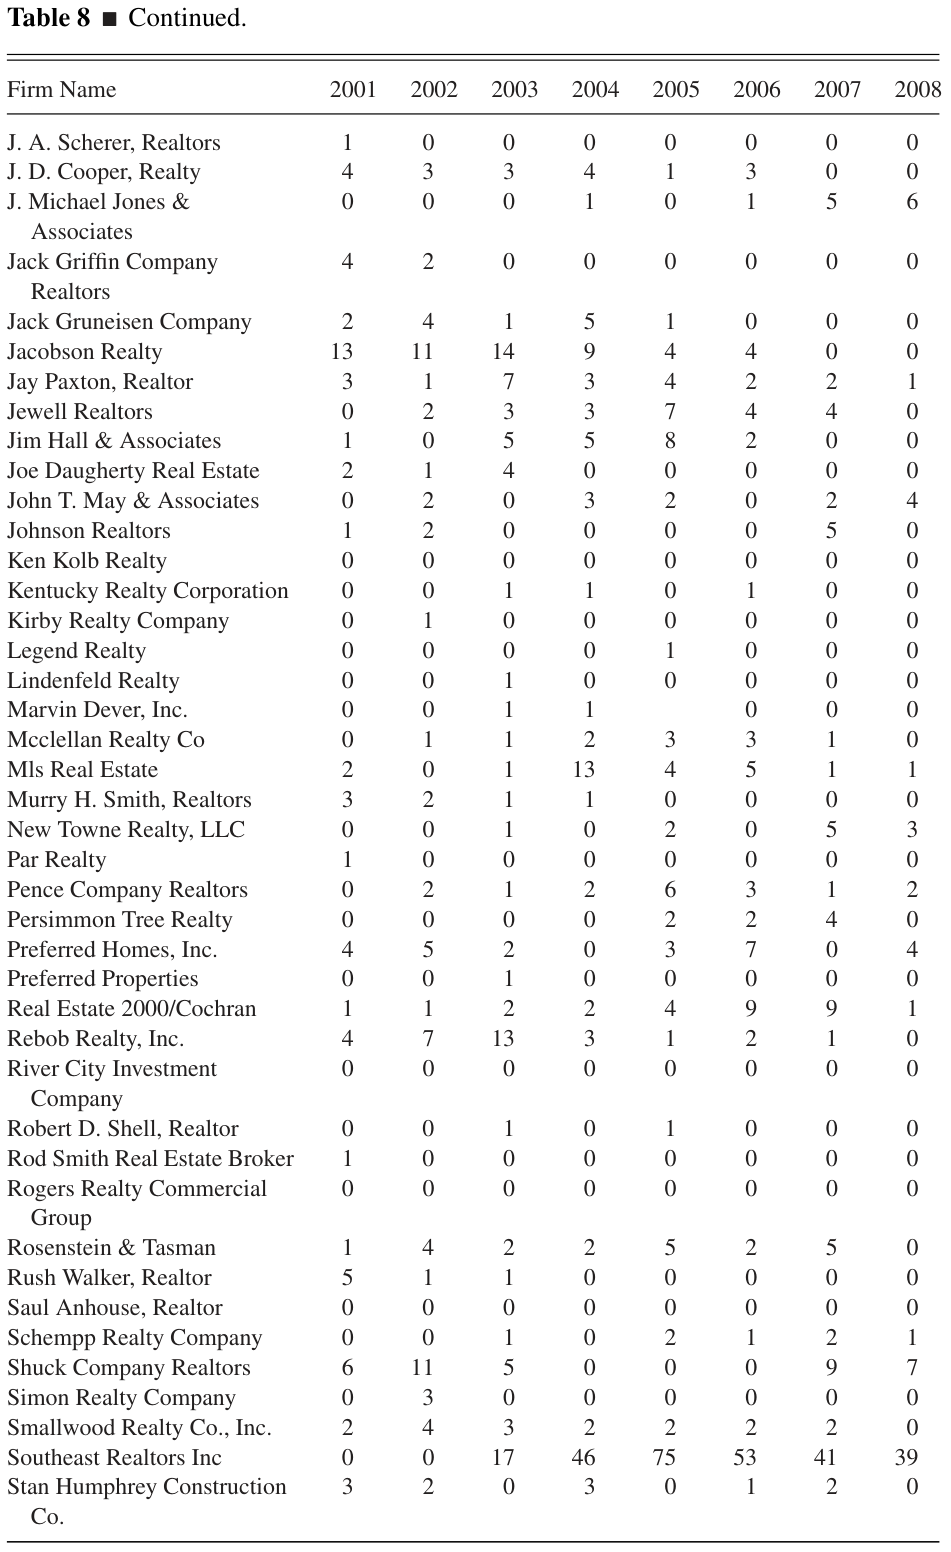
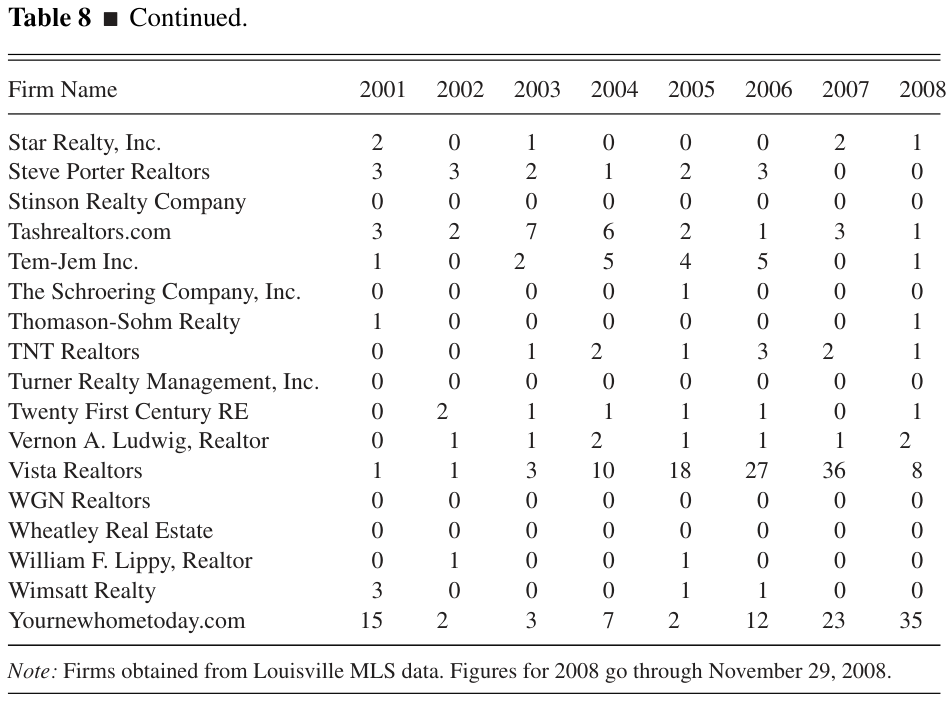
To further understand survival and growth of smaller brokers, we identified all the firms in the sample that only had one listing transaction in 2000. We then tracked the listings of these firms over the 2000 to 2008 period. Table 8 contains information on sales in subsequent years of the 95 real estate brokers who had exactly one sale in 2000. Sixteen of the 95 firms disappeared completely from the market, that is, had zero listings in any of the following eight years. Thirty-one firms grew on average over the 2000 to 2008 period, that is, averaged more than one transaction per year. Of these firms, however, only five brokers had at least one transacted listing in each of the succeeding eight years. It is clear from these data that a large number of small brokers are in and out of the market, selling a house or two in one year and then selling zero houses in the next year.
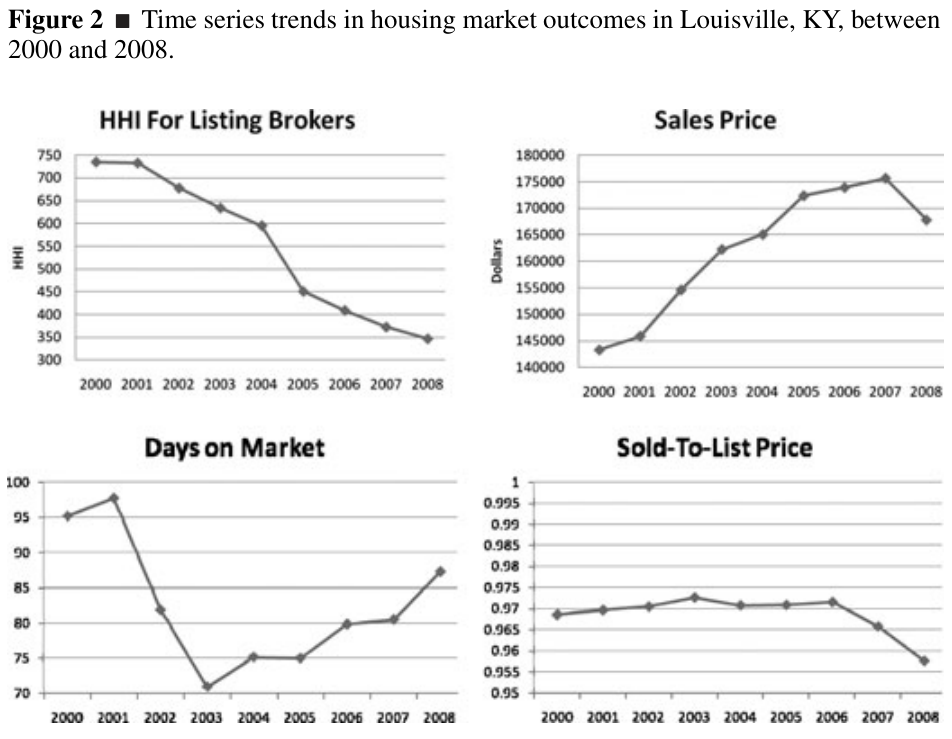
With our data, we are also able to analyze whether market concentration measures are correlated with market housing outcomes. Figure 2 illustrates listing agent and selling agent HHIs alongside days on market, sales price and the ratio of sold-to-list price for Louisville from 2000 until 2008. While HHIs decline steadily throughout the period, days on market declines slightly and then remains steady, mean sales price increases slightly and sold-to-list price ratio is fairly steady and then declines significantly in 2007 and 2008. From visual inspection, it appears that the link between market concentration and housing market outcomes is quite weak.
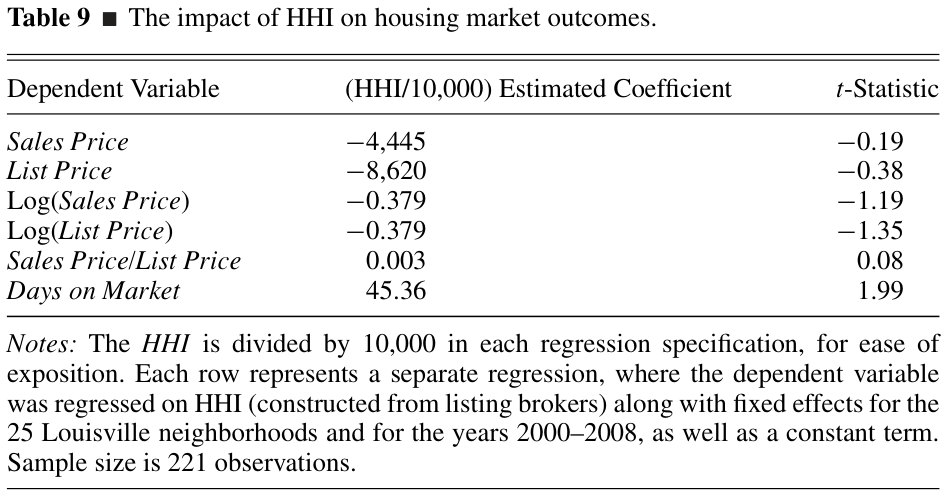
We can probe this finding more formally by using our panel of areas within Louisville over time. We regress the above market outcome variables on HHI in each of 25 areas for the years 2000–2008. We include fixed effects for each area and each year, meaning our analysis relates the change in housing market outcomes within an area over time to the change in the HHI in that area over time. Results of these regressions are contained in Table 9. Neither sales price nor sales price/list price are significantly correlated with HHI. The HHI does significantly affect days on market, but surprisingly the correlation is positive, not negative. In any case, the economic effect is small—a 1,000-point increase in the HHI is associated with 4.5 extra days on the market. In summary, our analysis of Louisville suggests market concentration, or changes in market concentration over time, have very little effect on housing market outcomes like list price or sales price.
Table 8. Market activity of firms with exactly one sale in 2000
Notes:Notes: The HHI is divided by 10,000 in each regression specification, for ease of exposition. Each row represents a separate regression, where the dependent variable was regressed on HHI (constructed from listing brokers) along with fixed effects for the 25 Louisville neighborhoods and for the years 2000–2008, as well as a constant term. Sample size is 221 observations.
Conclusion
While there is anecdotal evidence that some local real estate markets are fairly concentrated, no systematic study of market structures has been conducted. We have collected primary data on the number and market shares of real estate brokers in a variety of small, medium and large real estate markets across the United States for 2007 and 2009. In addition to these cross-sectional data, we have also collected longitudinal data on the size distribution of firms for Louisville, KY, for a nine-year period.
In our cross-sectional analysis of medium and large markets, we find no evidence that market concentration might create problems for competition. Among 18 large markets and 30 medium markets in 2007, only Des Moines, IA, had an HHI that exceeded 1,800, the level, which would have caused it to be categorized as highly concentrated according to the FTC/DOJ Horizontal Merger Guidelines. And two years later, the HHI in Des Moines declined from 3,320 to 1,538.
If concentration is a problem in real estate brokerage, we would expect it to be most prevalent in small markets. We do find that small markets on average have higher HHIs than medium and large markets. But in only six out of 42 small markets did the HHI in 2007 exceed 1,800. Small markets also exhibited considerable volatility in HHIs, as individual firm market shares often changed significantly between 2007 and 2009.
The volatility in market shares we observed in our 2007 and 2009 snapshots prompted us to follow firms in one particular market for an extended period of time. We tracked real estate brokers from smallest to largest in Louisville, KY, from 2000 to 2008. Overall, concentration declined steadily over the entire period. The identities and market shares of the top ten firms were very stable in this particular market. At the other end of the spectrum, among the 350 brokers having at least one listing in 2000, 95 had just one listing and 57 had just two listings for the entire year. When we tracked the 95 firms having just one listing for the next eight years, 16 firms disappeared completely while only five firms had at least one transacted listing every year. The longitudinal analysis reveals that many small brokers are in and out of the market, selling a house or two one year and selling zero houses the next year.
The competitiveness of real estate brokerage in the United States has been an ongoing concern at both the federal and state level. The DOJ, FTC and GAO have expressed concern over an apparent lack of price competition in the industry. A lack of competition may arise in an industry for a variety of reasons, but one explanation that our research refutes is a concentrated size distribution of firms in local real estate brokerage markets.
We thank Bill Hoyt, the editor and two anonymous referees for helpful feedback.
References
Anderson, R., D. Lewis and L. Zumpano. 2000a. Residential Real Estate Brokerage Efficiency from a Cost and Profit Perspective. The Journal of Real Estate Finance and Economics 20: 295–310.
———. 2000b. X-Inefficiencies in the Residential Real Estate Market: A Stochastic Frontier Approach. Journal of Real Estate Research 20: 93–103.
Bernheim, B.D. and J. Meer. 2008. Do Sellers’ Brokers Raise Or Reduce Home Prices? Evidence of Agency Costs from an Unusual Real Estate Market. Working Paper No. 13796. National Bureau of Economic Research: Cambridge, MA.
Brown, J.R. and A. Goolsbee. 2002. Does the Internet Make Markets More Competitive? Evidence from the Life Insurance Industry. The Journal of Political Economy 110: 481–507.
Carney, M. 1982. Costs and Pricing of Home Brokerage Services. Journal of the American Real Estate and Urban Economics Association 10: 331–354.
Colwell, P.F. and D. Marshall. 1986. Market Share in the Real Estate Brokerage Industry. Journal of the American Real Estate and Urban Economics Association 14: 583–599.
Consumer Reports . 2008. Buying, Selling, Remodeling. September: 16–21. Delcoure, N. and N. Miller. 2002. International Residential Real Estate Brokerage Fees and Implications for the US Brokerage Industry. International Real Estate Review 5: 12–39.
Dietrich, M. and P. Holmes. 1990. The Market Structure of the Real Estate Agency Industry in the 1980s: An Empirical Investigation. Applied Economics 22: 629–638. Federal Trade Commission and U.S. Department of Justice. 2007. Competition in the Real Estate Brokerage Industry . Washington, DC.
Forgey, F.A., W.E. Mullendore and R.C. Rutherford. 1997. Market Structure in the Residential Real Estate Brokerage Market. Journal of Real Estate Research 14: 107–115. Hendel, I., A. Nevo and F. Ortalo-Magne. 2009. The Relative Performance of Real Estate Marketing Platforms: MLS versus FSBOMadision.com. American Economic Review 99: 1878–1898.
Hsieh, C.T. and E. Moretti. 2003. Can Free Entry Be Inefficient? Fixed Commission and Social Waste in the Real Estate Industry. Journal of Political Economy 111: 1076–1122. Levitt, S.D. and C. Syverson. 2008. Antitrust Implications of Outcomes when Home Sellers Use Flat-Fee Real Estate Agents. Brookings-Wharton Papers on Urban Affair 9: 47–88.
National Association of Realtors. 2005. Structure, Conduct, and Performance of the Real Estate Brokerage Industry . Chicago.
Sawyer, S. 2005. Local Real Estate Market Competition: Evidence and Insight from an Analysis of 12 Local Markets. Working Paper. The Pennsylvania State University: University Park, PA.
U.S. Government Accountability Office. 2005. Real Estate Brokerage: Factors That May Affect Price Competition . Washington, DC.
Weicher, J.C. 2006. The Price of Residential Real Estate Brokerage Services: A Review of the Evidence, Such As It Is. Real Estate Law Journal 35: 119–144.
White, L. 2006. The Residential Real Estate Brokerage Industry: What Would More Vigorous Competition Look Like? Working Paper. New York University: New York, NY.
Yinger, J. 1981. A Search Model for Real Estate Broker Behavior. American Economic Review 71: 591–605.
Zumpano, L.V. 2002. The Possible Consequences of Bank Entry into the Real Estate Brokerage Market: What the Research Tells Us. Journal of Real Estate Literature 10: 243–261.
Zumpano, L.V. and H. Elder. 1994. Economies of Scope and Density in the Market for Real Estate Brokerage Services. Journal of the American Real Estate and Urban Economics Association 22: 497–513.
Zumpano, L.V., H. Elder and R.I. Anderson. 2000. The Residential Real Estate Brokerage Industry: An Overview of Past Performance and Future Prospects. Journal of Real Estate Research 19: 189–207.
Zumpano, L.V., H. Elder and G.E. Crellin. 1993. The Market for Residential Real Estate Brokerage Services: Costs of Production and Economies of Scale. The Journal of Real Estate, Finance and Economics 6: 237–250.
Zumpano, L.V. and D.L. Hooks. 1988. The Real Estate Brokerage Market: A Critical Reevaluation. AREUEA Journal 16: 1–16.
Appendix
Table A1. Leading firms in 90 real estate markets, 2007
Notes: Notes: Firm market shares aggregated from individual house listings in each real estate market. Brokerage names were standardized when there were slight discrepancies in the name.
1. FTC/DOJ, Competition in the Real Estate Brokerage Industry , April 2007.
2. http://www.justice.gov/atr/public/real_estate/index.htm. A primary emphasis is the commission rates charged by real estate brokers.
3. GAO, Real Estate Brokerage: Factors That May Affect Price Competition, August 2005.
4. NAR (2005), pp. 1, 9.
5. NAR (2005), pp. 8–9; FTC/DOJ (2007), pp. 30–32.
6. FTC/DOJ (2007), p. 32.
7. Dietrich and Holmes (1990) found the Tyneside area in Great Britain to be relatively unconcentrated in the late 1980s.
8. See also Zumpano, Elder and Anderson (2000).
9. FSBO sales constituted 14% of home sales in 2004 (NAR 2005, p. 5). See Hendel, Nevo and Ortalo-Magne (2009) for a comparison of outcomes when owners marketed their homes themselves versus when they marketed their homes using a traditional agent and the MLS.
10. See the 2007 FTC/DOJ report for a description of a typical real estate transaction and the range of services offered by different brokers.
11. FTC/DOJ (2007), p. 30.
12. See Sawyer (2005).
13. Zumpano (2002) summarizes the empirical research on production and costs in real estate brokerage.
14. Kentucky is a typical case. Prospective agents must spend 96 hours in real estate courses, pass the state real estate licensing exam and pay the state licensing fee of $55. Private accredited real estate courses tend to range from $500 to $750, and the licensing exam fee is $75. See www.krec.ky.gov.
15. Brown and Goolsbee (2002) find that Internet comparison shopping has reduced term life insurance prices by as much as 15%.
16. See, for example, Bernheim and Meer (2008).
17. See the discussion and references in GAO (2005), pp. 12–13.
18. GAO (2005, pp. 9–10, especially fn. 12). Weicher (2006) reviews the empirical evidence on brokerage commission rates and comments on the paucity of research, primarily because of the difficulty in getting data.
20. For example, see http://www.assignmentscanada.ca/buyingincanada.html for evidence from Canada and http://nfn.com.au/selling-property/commission-rates/ for evidence from Australia.
21. Zumpano and Hooks (1988, pp. 9–10) point out that in 1980 the NAR adopted policies to prohibit publishing the total commission on MLS listings. Because only information on the selling broker’s share is publicly available on the MLS, pricing coordination on the listing agent’s compensation is made more difficult.
22. The offered commissions to selling agents in the MLS data occasionally had mistakes; we used a number of decision rules to clean up these mistakes. For example, we converted a commission of 0.03% to 3%, because we believe that the listing agent did not mean to offer a commission of three one-hundredths of a percent to the selling agent. The full set of decision rules is available from the authors.
23. “Buying, Selling, Remodeling,” Consumer Reports , September 2008, pp. 16–21. There were 9,141 responses to Consumer Reports’ annual survey about selling or trying to sell homes using real estate agents from 2004 to 2007.
24. Realtor.com provides information on approximately 95% of all homes listed on MLSs around the country (GAO 2005, p. 18).
25. We focus on the brokerage of existing homes because the selling process for newly built homes is often drastically different. In a new development, the relative homogeneity of the homes likely makes the marginal effort to sell a house different than for an existing house, and so it is common for one listing agent or firm to handle the entire development. Also, we noted that it is common for new housing developments to post a single representative listing for the multiple homes available. Furthermore, it is quite common for new home builders to vertically integrate and have a hand in the brokerage and financing of their own homes. A home’s construction status is available in the data, and those designated as new construction were excluded from the analysis.
26. By 2005, Web-based brokers had emerged who often made available information about listings to potential customers via Web sites. The NAR gave individual agents the right to opt out of having their listings displayed by particular Web sites. In response to imminent legal action by the DOJ in September 2005, the NAR changed the policy to a blanket opt-out allowing realtors to prohibit their listings from appearing on any Web site other than Realtor.com.
27. See http://factfinder.census.gov/home/saff/main.html?_lang=en.
28. Our middle group of cities was defined as having a population too small to be counted as one of the 50 largest (less than 362,850) but greater than 40,000 inhabitants. Cities were selected randomly except for Lexington, KY, Des Moines, IA, and Lincoln, NE. The former was chosen because of the authors’ familiarity with local market conditions, and the latter two were chosen to permit comparison with earlier research.
30. Market shares can also be calculated based on dollar volume of sales. We find, unsurprisingly, HHIs based on listings are highly correlated with HHIs based on dollar volume of sales.
31. The DOJ and FTC recently issued revised HHI classifications. Markets with are classified as unconcentrated, markets with HHI between 1,500 and 2,500 are classified as moderately concentrated and markets with are classified as highly concentrated. See http://www.justice.gov/atr/public/guidelines/hmg-2010.html#5c. The old cutoffs were <1,000 for unconcentrated, between 1,000 and 1,800 for moderately concentrated and >1,800 for highly concentrated.
32. Table A1 contains the number of listings and market shares of the four largest brokerages in each market.
33. If the long-run average cost curve has a unique minimum, then HHI will vary somewhat mechanically with market size. Given the empirical evidence of economies of scale in real estate brokerage, it is not surprising that we find greater concentration in smaller markets than larger markets.
34. To check for consistency, we compared 100 randomly selected sold homes from the MLS data with local county property records (http://jeffersonpva.ky.gov/). While these records were much less detailed than the MLS data, no inconsistencies were found.
36. The combination of increased broker participation and flat sales is consistent with the findings of Hsieh and Moretti (2003).
37. The Louisville MLS divides the city into 26 areas. Of the 26, several were very inactive and had relatively few recorded transactions. We therefore included only those areas with at least 100 recorded transactions in 2006. Specific definitions of the areas and a map can be found at www.MLSKY.net.
Additional printed notes
19. Both the FTC/DOJ (2007) and GAO (2005) reports emphasize the negative impact that minimum service requirements can have on competition in real estate brokerage markets. The DOJ has actively discouraged state legislatures from adopting such measures.
29. Note that these data only permit a picture of brokerage markets from the perspective of listings. The number of transactions is probably a better measure of market size, especially if the primary interest is the size distribution of firms in the market. Because listings and not transactions are available from realtor.com, we use data from the Louisville, KY , MLS in the next section to analyze the size distribution of brokerage firms by market transactions.
35. While a firm wishing to list a client’s home on the MLS must be a dues paying member, browsing the listings is an option available to anyone. As such, real estate agents who specialize in representing buyers may not join the MLS, but they can still participate in an MLS transaction as the selling agent. In the MLS data, all nonmember firms were all coded identically and thus are indistinguishable from one another. We therefore lump these firms together in our analysis. In 2000, nonmember firms accounted for less than 1% of transactions. That number steadily increased until 2006 when the percentage of transactions involving nonmember offices reached 3.4%. If each of those transactions were associated with an atomistic nonmember office, our calculation of the buying-side HHI would be slightly lower.