Health insurance reform in Massachusetts lowered the cost of both pregnancy (by increased coverage of pregnancy-related medical events) and pregnancy prevention (by increasing access to reliable contraception). We empirically examine fertility responses and find no overall effect from increased coverage due to the Massachusetts reform. This finding, however, masks substantial heterogeneity. For married women aged 20 to 34—with high latent fertility and pregnancy wantedness—fertility increased by approximately 1%. For unmarried women in the same age range—for whom pregnancies are typically unwanted—fertility declined by 8%.
JEL classifications: I13; I18; J13
Recommended citation
Maria Apostolova-Mihaylova and Aaron Yelowitz. “Health Insurance, Fertility, and the Wantedness of Pregnancies: Evidence from Massachusetts.” Contemporary Economic Policy 36(1) (2018): 59–72. https://doi.org/10.1111/coep.12235
Author note: We are grateful for the helpful comments from Frank Scott, Chris Bollinger, Jenny Minier, Jim Ziliak, Tom Ahn, Glen Mays, Beth Munnich, Gordon Dahl, Lisa Schulkind, Madeline Zavodny, Charles Courtemanche, Matthew Niedzwiecki, Tim Harris, and participants at the Ball State University, University of Cincinnati, University of North Carolina—Charlotte, the Southern Economic Association, and the Eastern Economic Association. M.A.M. acknowledges the generous dissertation support from the Horowitz Foundation for Social Policy. Author information: Maria Apostolova-Mihaylova — Assistant Professor, Department of Economics, Centre College, Danville, KY 40422; phone (859) 238-5426; email maria.apostolova@centre.edu. Aaron Yelowitz — Associate Professor, Department of Economics, University of Kentucky, Lexington, KY 40506; phone (859) 257-7634; fax (859) 323-1920; email aaron@uky.edu.
Abstract
Health insurance reform in Massachusetts lowered the cost of both pregnancy (by increased coverage of pregnancy-related medical events) and pregnancy prevention (by increasing access to reliable contraception). We empirically examine fertility responses and find no overall effect from increased coverage due to the Massachusetts reform. This finding, however, masks substantial heterogeneity. For married women aged 20 to 34—with high latent fertility and pregnancy wantedness—fertility increased by approximately 1%. For unmarried women in the same age range—for whom pregnancies are typically unwanted—fertility declined by 8%.
JEL classification: I13; I18; J13
I. INTRODUCTION
Although the Patient Protection and Affordable Care Act (ACA) of 2010 is the first successful attempt in the United States to provide near-universal health insurance coverage at the national level, similar policies have been implemented at state and local levels in prior years.1 Among these regional reforms, the Massachusetts health care law of 2006—which includes an individual mandate requiring all state residents to obtain health insurance—is the most prominent. Over the years, researchers have used the Massachusetts experience to determine how
its new health care law affected health coverage, outcomes, costs, and other critical issues. Given that the Massachusetts legislation served as a model for the design of the ACA, the answers to these questions have broader implications at the national level.
It has been shown that coverage rates increased and out-of-pocket costs from expensive medical events (like pregnancy) decreased due to the Massachusetts reform (Long, Stockley, and Yemane 2009).2 Thus, the reduced cost of pregnancy may have incentivized women of childbearing age who were previously uninsured to plan and carry out a pregnancy. In addition to lowering the out-of-pocket costs of having a baby, the Massachusetts law also lowered the costs of preventing a pregnancy by increasing access to reliable contraception and family planning services. As a result, women who did not want to get pregnant might have increased their use of reliable birth control and thus decreased their fertility rates.
ABBREVIATIONS
ACA: Affordable Care Act ACS: American Community Survey CDC: Centers for Disease Control and Prevention CPS: Current Population Survey DD: Difference-in-Differences FPL: Federal Poverty Line PUMS: Public Use Microdata Sample
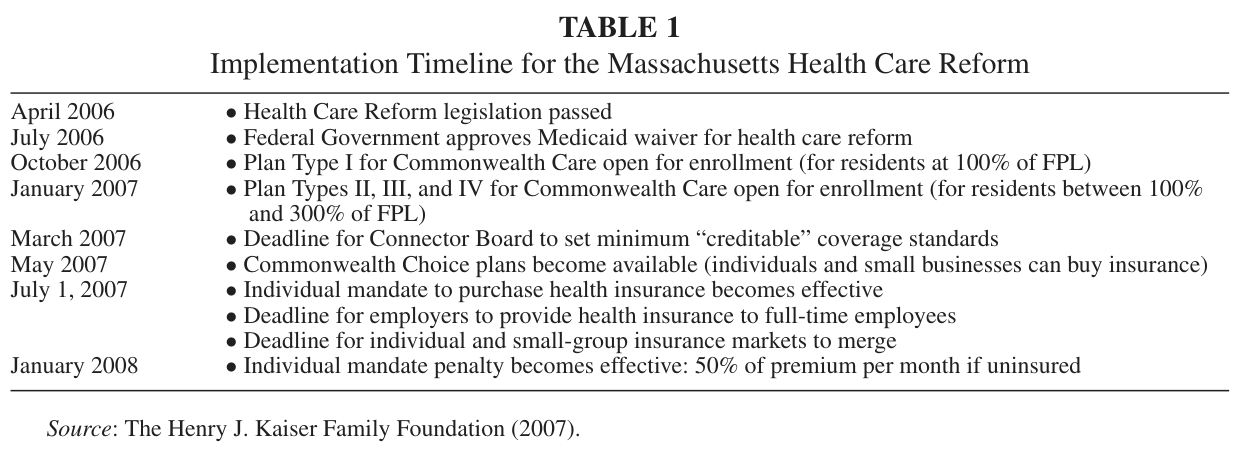
Table 1. Implementation Timeline for the Massachusetts Health Care Reform
In this paper, we use the exogenous changes generated by Massachusetts’ health care reform to identify the effect of insurance coverage on fertility. We rely on the American Community Survey (ACS), which explicitly asks questions on fertility. Straightforward difference-in-differences estimates reveal no substantive change in fertility. Since baseline insurance coverage rates varied based on socioeconomic characteristics (rather than just by state and year), we further parameterize the changes in insurance coverage. Even with this parameterized specification, we do not find an effect on realized fertility when we examine all women or stratify the sample by age alone. Our key finding emerges when we stratify by both age and marital status: insurance coverage increased
fertility for married women aged 20–34 by roughly 1% and decreased fertility for unmarried women of the same age by 8%. These opposite-signed results are consistent with different degrees of pregnancy wantedness and different behavioral responses to insurance coverage. These effects cancel out in the aggregate. Fertility for teenagers and older women did not change, which is unsurprising because teenagers experienced small gains in insurance coverage (hence, identification is more difficult) and older women have low fertility rates (hence, there is a heterogeneous behavioral response). The results are fairly robust to the inclusion of different sets of control variables and a variety of specification checks.
We also examine and confirm some of the underlying assumptions regarding pregnancy wantedness, physician access, and contraceptive use—all necessary conditions for finding opposite-signed fertility effects. Unlike the fertility results, where we exploit the quasi-experiment of the Massachusetts reform, our analysis cannot establish causality and is thus
inherently more speculative due to limited data. Nonetheless, the correlations are consistent with our explanation of fertility patterns, and the overall magnitudes mirror the fertility findings.
II. LITERATURE REVIEW
This paper contributes to a literature evaluating the Massachusetts health care reform, in which insurance coverage and health care utilization are two principal outcomes.3 Our study is the first to examine fertility behavior in this setting. Moreover, unlike existing studies evaluating the fertility effect of insurance mandates, we recognize that marital status (which is broadly consistent with pregnancy wantedness) may differentially affect individuals’ responses to newly found health insurance and test this hypothesis in the context of the Massachusetts health reform.
Several studies examine the effect of the Massachusetts reform on insurance coverage (i.e., Long, Stockley, and Yemane 2009). There is consensus that coverage rates increased, although there is disagreement on the magnitude.4 The gains in health insurance coverage varied with socioeconomic characteristics because of heterogeneous baseline coverage: effects were large among young and low-income adults while modest for older and wealthier individuals (Niedzwiecki 2014). The reform caused little change in coverage for children and teenagers because they were already overwhelmingly eligible under a parent’s plan or through Medicaid (Long, Stockley, and Yemane 2009). The reform also affected health care utilization and increased efficiency: the use of preventive health care services increased (Kolstad and Kowalski 2012) and the use of emergency rooms fell (Miller 2012).5
Most work focusing on fertility-related moral hazard effects examines Medicaid expansions from the 1980s and 1990s and largely finds a heterogeneous response based on demographics. Several studies find different responses by white women (Yelowitz 1994) and typically no population-wide effect (DeLeire, Lopoo, and Simon 2011). Some also find racial differences in terms of abortion rates (Zavodny and Bitler 2010). Insurance coverage mandates have also been found to increase the utilization and outcomes of infertility treatments but these results are restricted to older women (Bitler and Schmidt 2012).
The increased availability of health insurance also lowers the individual’s cost of preventing pregnancy, because almost all health plans cover contraception (and some plans cover abortion). The publicly subsidized “Commonwealth Care” plan in Massachusetts covers a full range of family planning services, including abortion care. Dennis et al. (2012) found that, after the reform, access to affordable contraception improved for low-income women even though they faced new challenges in navigating the system. By providing particular subgroups with a source of entry into the formal health care system, family planning community centers helped overcome such navigation obstacles (Gold 2009).
Noting that Medicaid has covered contraception since 1972, Kearney and Levine (2009) examined the impact of Medicaid eligibility for family planning services on birth rates and contraceptive use among different demographic groups. They find the largest effects among 20- to 24-year-old women, where birth rates declined by up to 5.1 percentage points (almost 15%) due to higher contraceptive use. Moreover, many studies have shown significant disparities in unintended pregnancies not only by age but also by marital status, education, and income (Finer and Zolna 2011). This literature provides motivation for analyzing fertility responses separately by demographic group because
latent fertility (the propensity of a woman to give birth) and pregnancy wantedness vary by sociodemographic characteristics.
III. PREDICTED EFFECTS OF EXPANDING HEALTH INSURANCE COVERAGE ON FERTILITY
To predict the effects of health insurance reform on pregnancy, we have to account for several other elements, such as latent fertility (proxied by age) and wantedness of children (proxied by marital status), which factor into the decision to have a baby. Our hypothesis is that, all else equal, expanding insurance coverage will decrease the fertility of single women (unwanted pregnancies) due to better access to reliable contraception, while increasing the fertility of married women (wanted pregnancies) due to lowering the out-of-pocket cost of pregnancy. In addition, as health insurance becomes more widely available, births by younger women should increase more than those by older women due to the former group’s higher latent fertility rates.
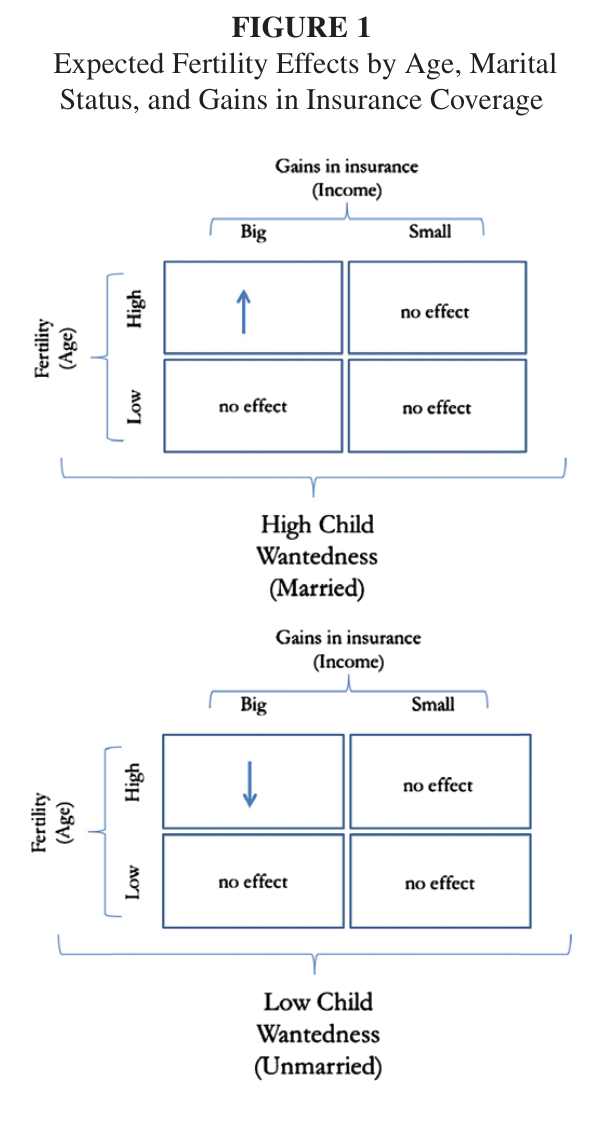
The insurance coverage gains in Massachusetts (relative to the rest of New England) after the reform varied by family income: some groups experienced minimal gains in insurance (such as relatively affluent women who were often covered by private insurance), while others experienced much larger gains (such as poor and “near-poor” women). Larger gains in coverage should lead to larger fertility responses within each age-marital status cell (Figure 1). A woman who is young, single (married), and near-poor, would experience larger relative gains in insurance coverage and would be relatively less (more) likely to have a baby after the reform than her more affluent counterpart.6
IV. DATA DESCRIPTION: ACS, CURRENT POPULATION SURVEY (CPS), AND VITAL STATISTICS
Our primary data source is the Census Bureau’s 1-year sample of the ACS Public Use Microdata Sample (PUMS) for the years 2003–2011 (excluding 2007). Starting with the 2005 PUMS, approximately 1% of all households in the United States were surveyed (in 2003 and 2004, the samples are approximately 40% the size of subsequent years), which allows us to examine the fertility responses in Massachusetts relative to other New England states for narrow demographic groups, for which we can more accurately characterize the wantedness of pregnancies and latent fertility. Unlike most household surveys, respondents are required by law to participate in the ACS.7
Figure 1. Expected Fertility Effects by Age, Marital Status, and Gains in Insurance Coverage
Expected Fertility Effects by Age, Marital Status, and Gains in Insurance Coverage.
Relevant for our purposes, the ACS directly asks fertility questions for each woman of childbearing age. Specifically, the survey asks, “Has this person given birth to any children in the past 12 months?” Other datasets do not directly ask about fertility; instead, one might
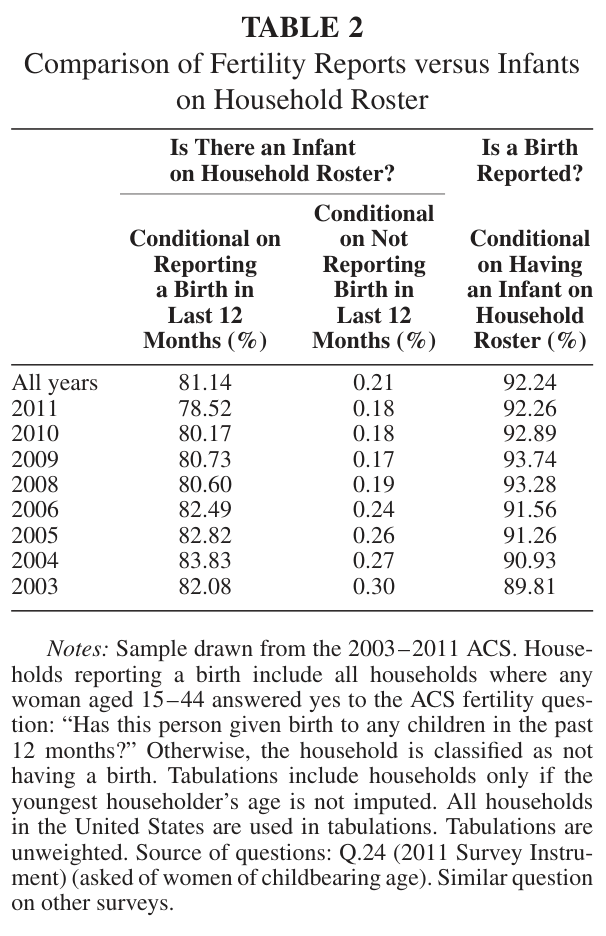
impute fertility from the presence of an infant on the household roster. Such an imputation strategy would encounter difficulty in assigning a given infant to a given mother if there was more than one woman of childbearing age in the household. Perhaps more importantly, the ACS reveals that many infants are not living with their mothers (Table 2). While this nonpresence can be attributed in large part to socioeconomic circumstances, some of it simply reflects confusion about the wording of the survey question.8 Nonetheless, an important difference exists between births and the presence of very young children.
Table 2. Comparison of Fertility Reports versus Infants on Household Roster
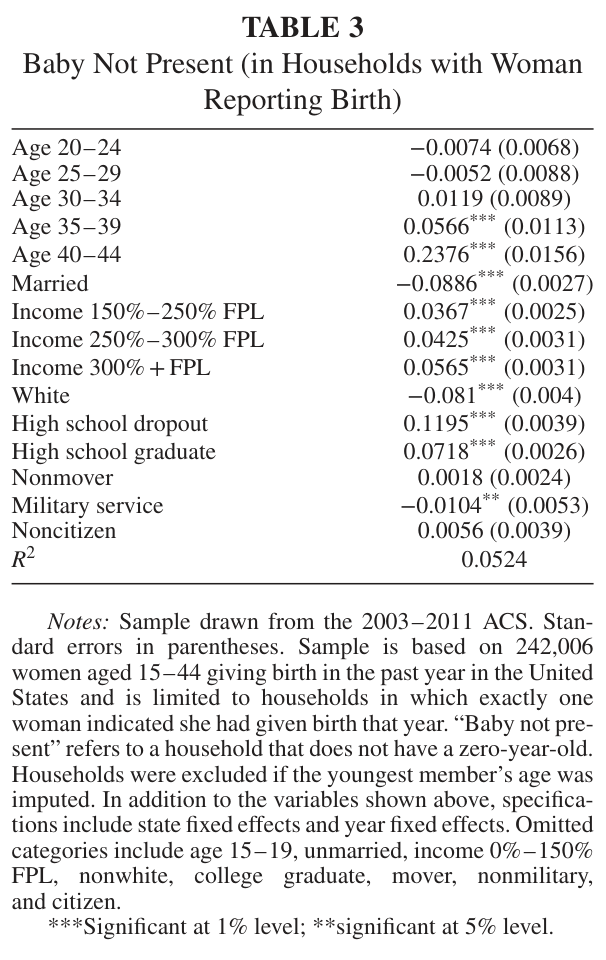
In Table 3, we show that the modest disconnect between reported births and presence of infants is related to socioeconomic circumstances. The outcome of interest is whether an infant (defined as age zero) is missing on the household roster, conditional on a birth being reported in the household. Unmarried, nonwhite, and less-educated women are far more likely to not have a baby present in the household. This may be unsurprising if the father lives in a separate household or if members of the extended family, such as grandparents, typically take care of the child. More surprisingly, the likelihood of missing infants increases sharply with age. These age results should be interpreted differently than the socioeconomic results, however. Fertility is quite low among these age groups and many of the affirmative responses to the fertility question could be related to infant mortality, miscarriage, stillbirth (more likely for older women), or to reporting errors. Given this possibility, we break out our empirical analysis by age group. Another surprising result relates to income.
Table 3. Baby Not Present (in Households with Woman Reporting Birth)
Those with higher levels of income also are more likely to not report a child on the household roster. It is possible—much like the intuition for the coefficients on older age—that this reflects some sort of measurement error. However, it is more difficult to say this conclusively with income than it is with age.
The ACS has one unfortunate drawback: it did not start asking questions on health insurance until 2008, which is the beginning of the “post” period. We rely, instead, on the Current Population Survey (CPS) to derive insurance rates, and append these rates to each woman in the ACS sample. Using the 2004–2012 CPS March Supplements, which cover calendar years 2003–2011 (excluding 2007), we compute coverage rates for women by demographic category, region, and time.9 Our demographic categories are based on six age groups (15–19, 20–24, 25–29, 30–34, 35–39, and 40–44), four income groups ( of the Federal Poverty Line or FPL, 150%–250% FPL, 250%–300% FPL, FPL), and two marital statuses (married and unmarried). For each demographic group, we create coverage rates for two regions (Massachusetts and the rest of New England, which combines
Connecticut, Vermont, Maine, Rhode Island, and New Hampshire) and two periods (the “before” period including calendar years 2003–2006 and the “after” period including calendar years 2008–2011).10 The total number of groups is therefore 192 (6 ages × 4 incomes × 2 marital statuses × 2 regions × 2 periods). A woman is defined as “uninsured” if she is not covered by private health insurance, Medicare, Medicaid, or CHAMPUS/Tricare military health insurance. The insurance coverage rate is then the ratio of the number of insured women in each cell to the total number of women in the cell.
Our specification includes raw, unconditional estimates of the percentage uninsured, which we compute for each of the 48 demographic categories for four region/time periods. Our motivation for doing so follows three recent studies that adopt the “universal coverage” approach (Courtemanche et al. 2017; Finkelstein 2007; Miller 2012). In contrast, in the Medicaid literature, eligibility expansions do not get to universal coverage (due to means-testing and lack of an individual mandate) and different states often simultaneously change their programs to different degrees. Hence, authors typically create a “simulated” eligibility measure (Gruber and Yelowitz 1999) to help characterize the “bite” of the eligibility rules.
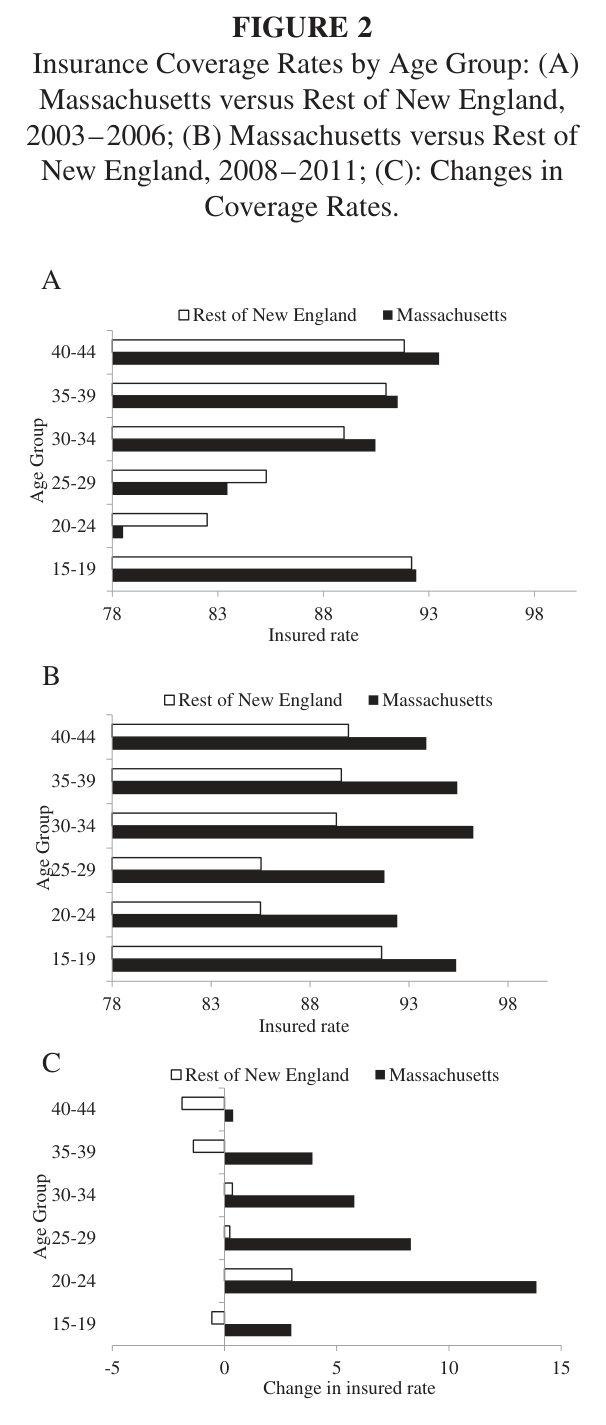
Insurance coverage rates were highest among teenagers (15- to 19-year-olds) and older women (aged 35–44) both in Massachusetts and the rest of New England in 2003–2006 (Figure 2A). This is expected because teenagers are typically covered under their parents’ health insurance plan or Medicaid and older adults are more likely to be insured due to improved economic circumstances. The age groups with lowest coverage rates were 20- to 24- and 25- to 29-year-olds because young adults leaving college were often no longer covered on a parent’s plan and less likely to have a job that provides health insurance coverage. The gains in insurance coverage in Massachusetts following the reform, therefore, were most pronounced for these age groups (Figures 2B and 2C). The changes among teens and
older adults were quite modest in comparison. In contrast to Massachusetts, the rest of New England experienced relatively small gains and even reductions in coverage rates for some age groups.
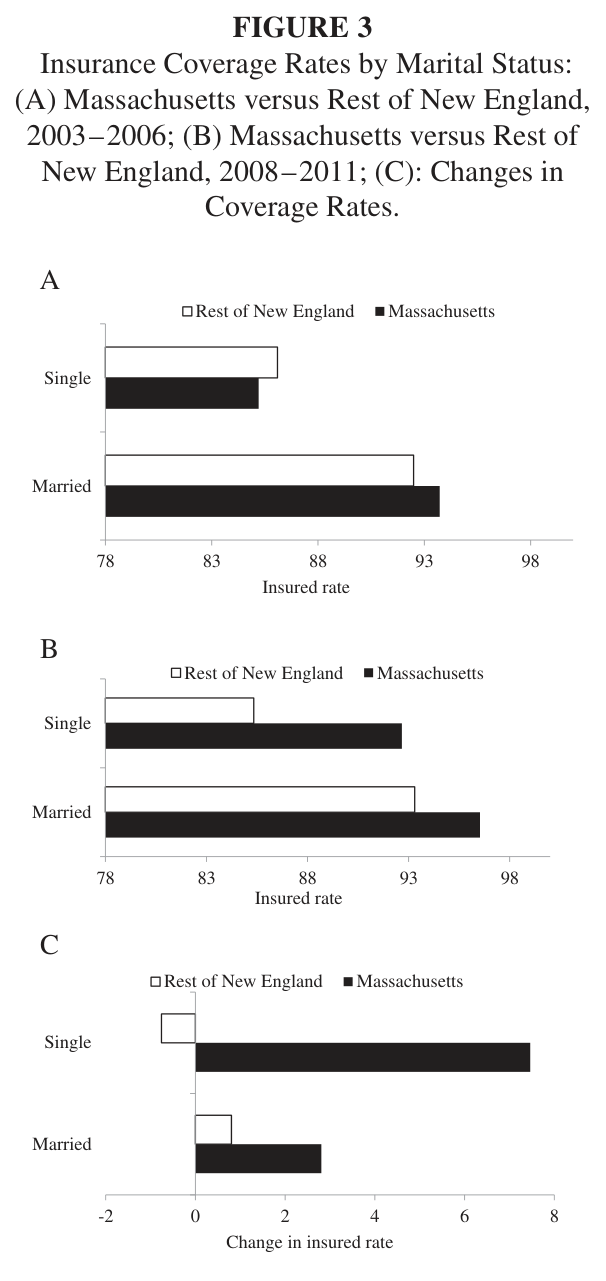
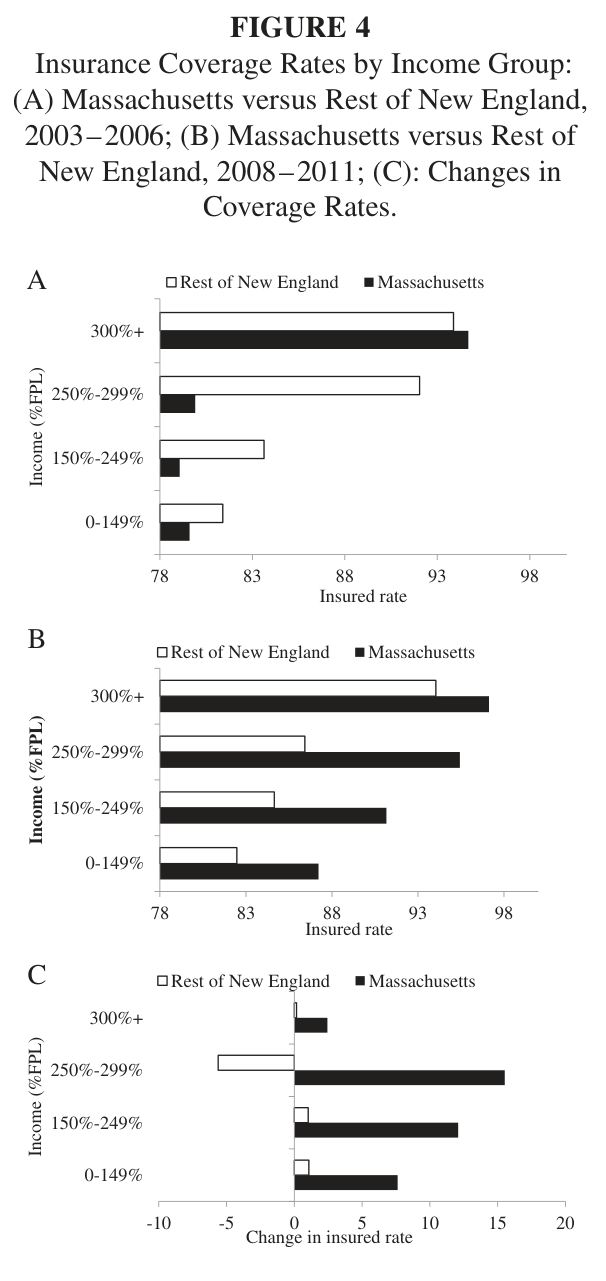
Figure 3 shows that coverage rates are higher for married women than unmarried women, because of the availability of spousal health insurance coverage (Bernstein et al. 2008). Massachusetts’ reform had an equalizing effect for unmarried women: insurance coverage increased by almost 8 percentage points. Figure 4 illustrates the changes in coverage rates by income. Insurance coverage was initially highest for women with incomes 300% of FPL or more, and the coverage gains were very small. They were also somewhat limited for women with incomes less than 150% of FPL because many had health insurance through Medicaid (Sommers et al. 2012). In contrast, the group with incomes between 150% and 299% of FPL saw large increases in insurance coverage.
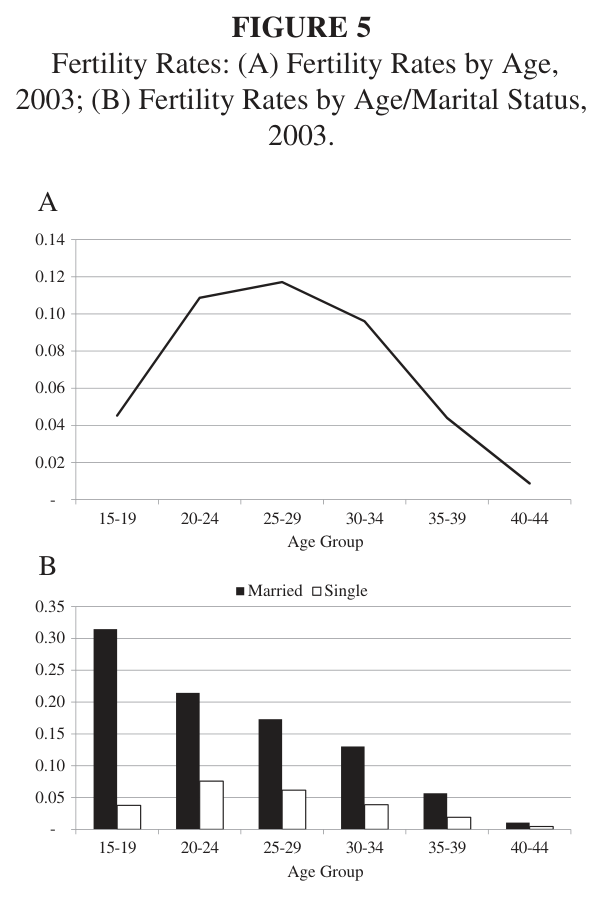
Finally, although women aged between 15 and 44 are often categorized as being of childbearing age, birth rates vary tremendously by age group. Older women in the sample are more likely to have reached their desired number of children and, as such, one may not expect the same fertility response to insurance coverage that younger women would demonstrate. Figure 5A
illustrates wide variations in the propensity for having a baby, with women aged 20–34 being most likely to give birth.11 Birth rates among married women are significantly higher for each age group than for unmarried women (Figure 5B). These fertility rates provide strong motivation for stratifying the sample, both by age alone and by age and marital status.
Figure 2. Insurance Coverage Rates by Age Group: (A) Massachusetts versus Rest of New England, 2003–2006; (B) Massachusetts versus Rest of New England, 2008–2011; (C): Changes in Coverage Rates
Insurance Coverage Rates by Age Group: (A) Massachusetts versus Rest of New England, 2003–2006; (B) Massachusetts versus Rest of New England, 2008–2011; (C): Changes in Coverage Rates.
Figure 3. Insurance Coverage Rates by Marital Status: (A) Massachusetts versus Rest of New England, 2003–2006; (B) Massachusetts versus Rest of New England, 2008–2011; (C): Changes in Coverage Rates
Insurance Coverage Rates by Marital Status: (A) Massachusetts versus Rest of New England, 2003–2006; (B) Massachusetts versus Rest of New England, 2008–2011; (C): Changes in Coverage Rates.
Figure 4. Insurance Coverage Rates by Income Group: (A) Massachusetts versus Rest of New England, 2003–2006; (B) Massachusetts versus Rest of New England, 2008–2011; (C): Changes in Coverage Rates
Insurance Coverage Rates by Income Group: (A) Massachusetts versus Rest of New England, 2003–2006; (B) Massachusetts versus Rest of New England, 2008–2011; (C): Changes in Coverage Rates.
As is well recognized, the Massachusetts reform creates a quasi-experiment to evaluate the impact of expanding health insurance coverage. The natural starting point for our examination of fertility is a difference-in-differences (DD) estimator estimated from a linear probability model:
Equation (1):
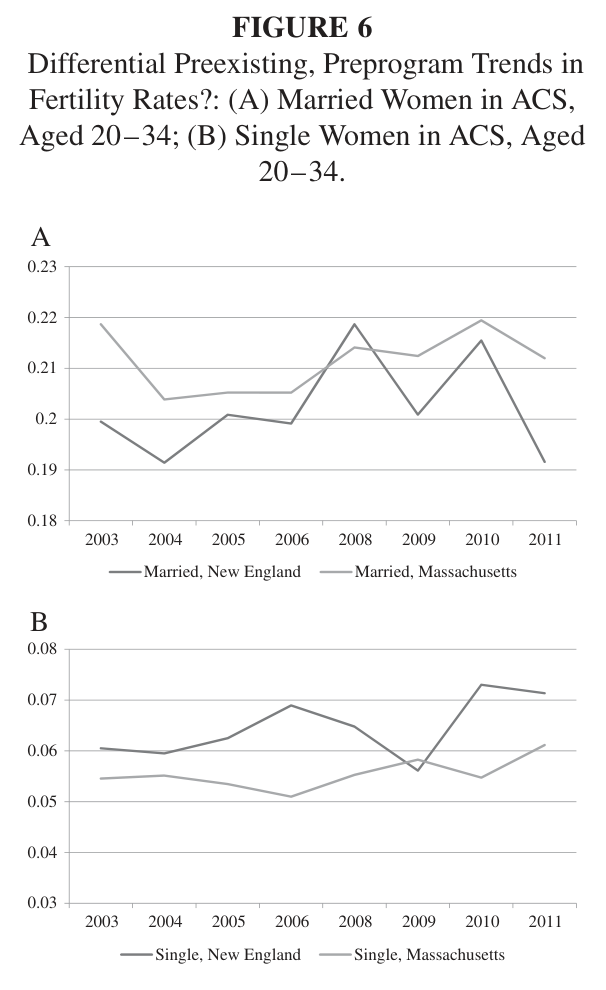
where is a dummy variable equal to one if woman i in state j at time period t had a child in the past 12 months. The variables and are dummy variables if the woman lives in Massachusetts or is in the post reform period, respectively. The vector includes controls for the woman’s education, whether the woman has changed residence in the past year, whether she has served in the military, race/ethnicity, and whether she is a non-U.S. citizen. We include preexisting trends in fertility, , similar to the approach taken by Chakrabarti and Roy (2016). Figure 6 illustrates fertility rates for married and single women, aged 20–34, and there appear to be some differences prior to the health insurance reform. We also include the age-specific unemployment rate for women in each state-year cell, , created from the ACS; transitory changes in wages can affect the timing of fertility (Dehejia and Lleras-Muney 2004). We also include fixed effects for demographic group interacted with state () as well as year fixed effects (). The coefficient estimate on is then interpreted as the DD estimator. Standard errors are clustered at the state level.
Figure 5. Fertility Rates: (A) Fertility Rates by Age, 2003; (B) Fertility Rates by Age/Marital Status, 2003
Fertility Rates: (A) Fertility Rates by Age, 2003; (B) Fertility Rates by Age/Marital Status, 2003.
Although transparent, there are reasons to go beyond the specification in Equation (1). Most importantly, although the near-universal health reform in Massachusetts leveled coverage rates across groups, there were very different gains based on a woman’s initial socioeconomic circumstances. Thus, we create a parameterized version of Equation (1) by attaching to each woman the insurance coverage rate based on her region (Massachusetts or the rest of New England),
time period, and demographic group.1213 Thus, Equation (2), which forms our baseline specification of insurance gains on fertility, is:
Equation (2):
where is the fraction of demographic group d covered in region r in period t. The other variables are defined as before (and use state rather than regional definitions). The estimate of the impact of insurance coverage, , is identified from how Massachusetts’ changing health insurance landscape over time interacted with different demographic groups. Since the identification of the insurance effect comes from the interaction of state, time, and demographics, we present further specifications that show the conclusions are relatively robust to including finer sets of controls.
Figure 6. Differential Preexisting, Preprogram Trends in Fertility Rates?: (A) Married Women in ACS, Aged 20–34; (B) Single Women in ACS, Aged 20–34
Differential Preexisting, Preprogram Trends in Fertility Rates?: (A) Married Women in ACS, Aged 20–34; (B) Single Women in ACS, Aged 20–34.
One key drawback to Equation (1) is that such a specification imposes an equal marginal impact on fertility for gains in insurance coverage. There are clearly reasons to think this should not be the case. Older women are likely to have reached their desired number of children; as a consequence, one might not expect much impact on fertility for them. Moreover, gains in insurance coverage not only reduce the cost of having a baby, but also reduce the cost of preventing or aborting a pregnancy. One would expect that pregnancies are much more likely to be unwanted for single women, and wanted for married women. Thus, the estimate from Equation (1) above could combine both positive and negative fertility responses. As a
consequence, in addition to examining the full sample, we separately stratify by age group, and also age group and marital status. In both Equations (1) and (2), we include women with incomes above 300% of the FPL. While they had very little gain in insurance coverage due to the reform, they serve as a control group for other factors that might affect fertility and may be correlated with the rollout of the health insurance reform. This may explain the different findings between the two specifications. For example, the rollout of emergency contraception (“Plan B”) was occurring during this period, and could have spread faster in Massachusetts relative to the rest of New England (and perhaps differently by demographic category).
B. Basic Results
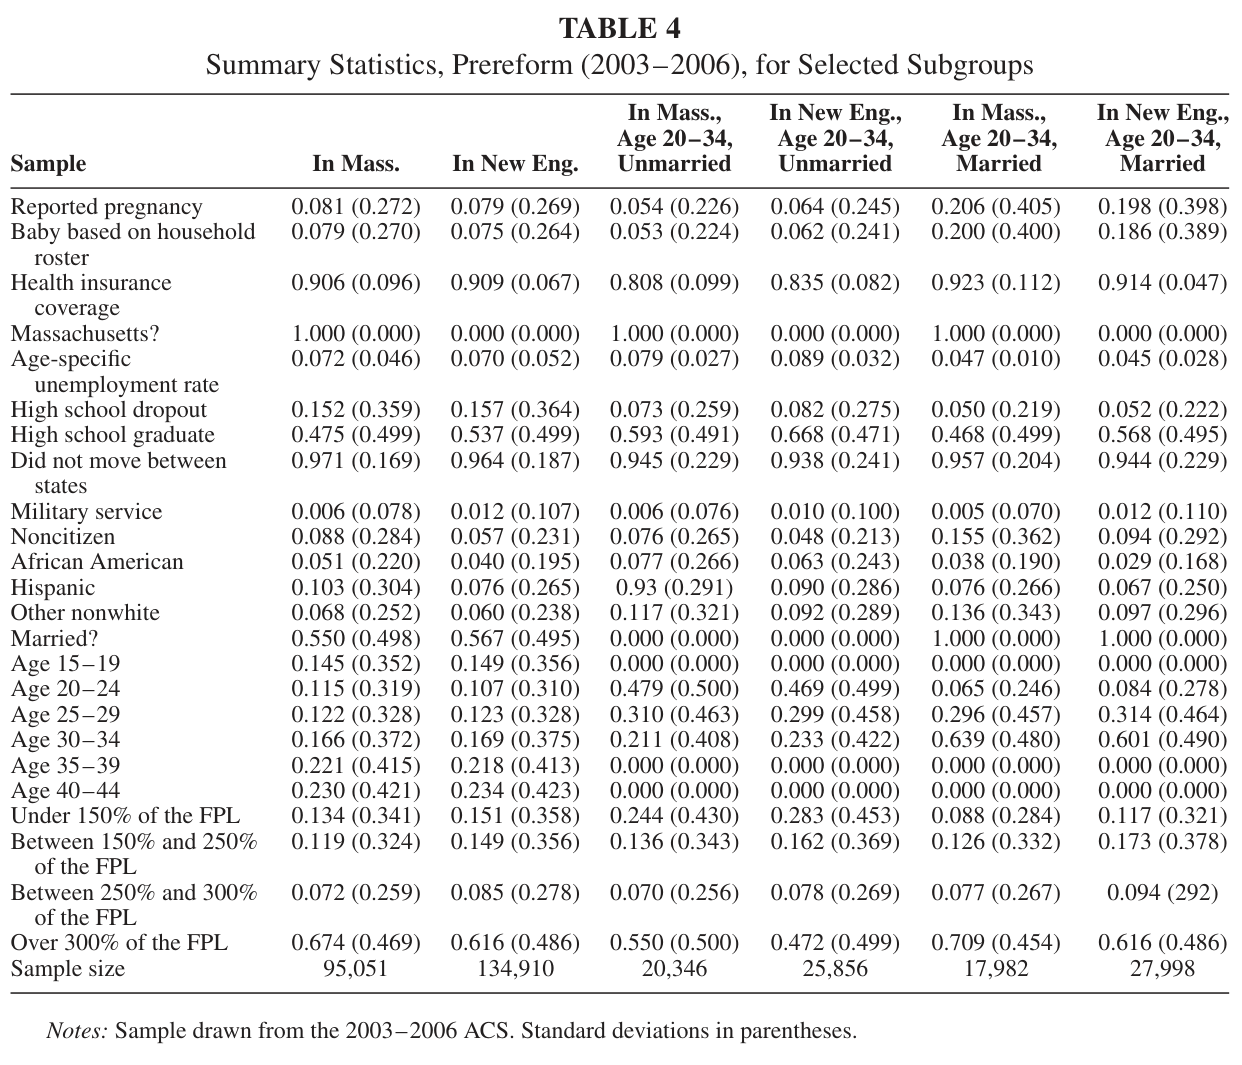
The full sample consists of 507,000 women aged 15–44 in Massachusetts and surrounding states. Summary statistics are shown in Table 4 for relevant subgroups while Table S1 presents summary statistics for the full sample. We observe significant fertility differences by marital status where up to 20% of married women aged 20–34 reported having a baby, which is between three and four times the rate of unmarried women in the same age group. The summary statistics show that prior to reform, the samples in Massachusetts and the remaining states are extremely similar. Pregnancy rates were roughly 8% in both areas, insurance coverage was 91%, and the unemployment rate was 7%. Postreform pregnancy rates remained quantitatively similar to their prereform levels, while insurance coverage increased to 95% in Massachusetts and remained virtually the same in neighboring states. There are small differences in racial composition, marital status, and the age distribution. Income and education levels in Massachusetts are somewhat higher than other states, but all regression specifications will control for those factors.
Table 4. Summary Statistics, Prereform (2003–2006), for Selected Subgroups
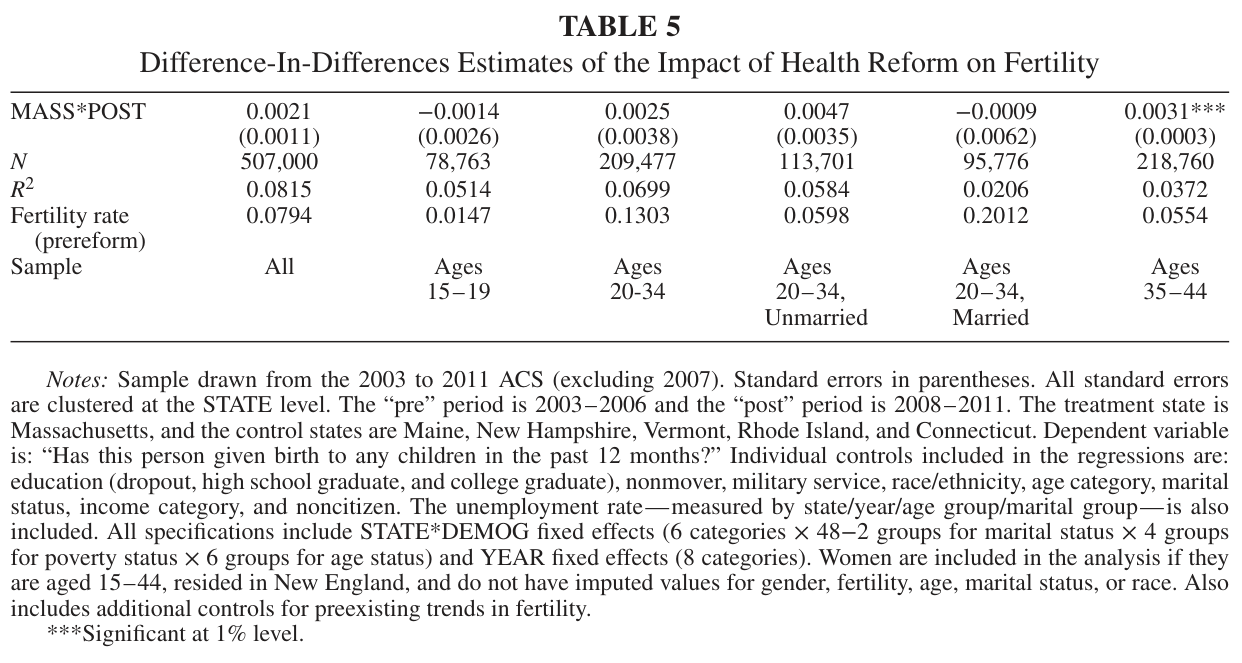
Our first attempt at estimating the impact of insurance coverage on fertility is shown in Table 5, corresponding to the DD specification in Equation (1). For both the full sample, as well as each age group, one would conclude that the expansions in insurance had little effect on fertility. In all cases, the coefficient estimate is substantively small and, with the exception of 35–44-year-old women, statistically insignificant. As noted, however, this specification ignores many important aspects about the fertility decision and the Massachusetts reform: in particular, the uneven gains in insurance coverage, the different latent fertility rates by age group, and the differential wantedness of pregnancies between married and unmarried women.
Table 5. Difference-In-Differences Estimates of the Impact of Health Reform on Fertility
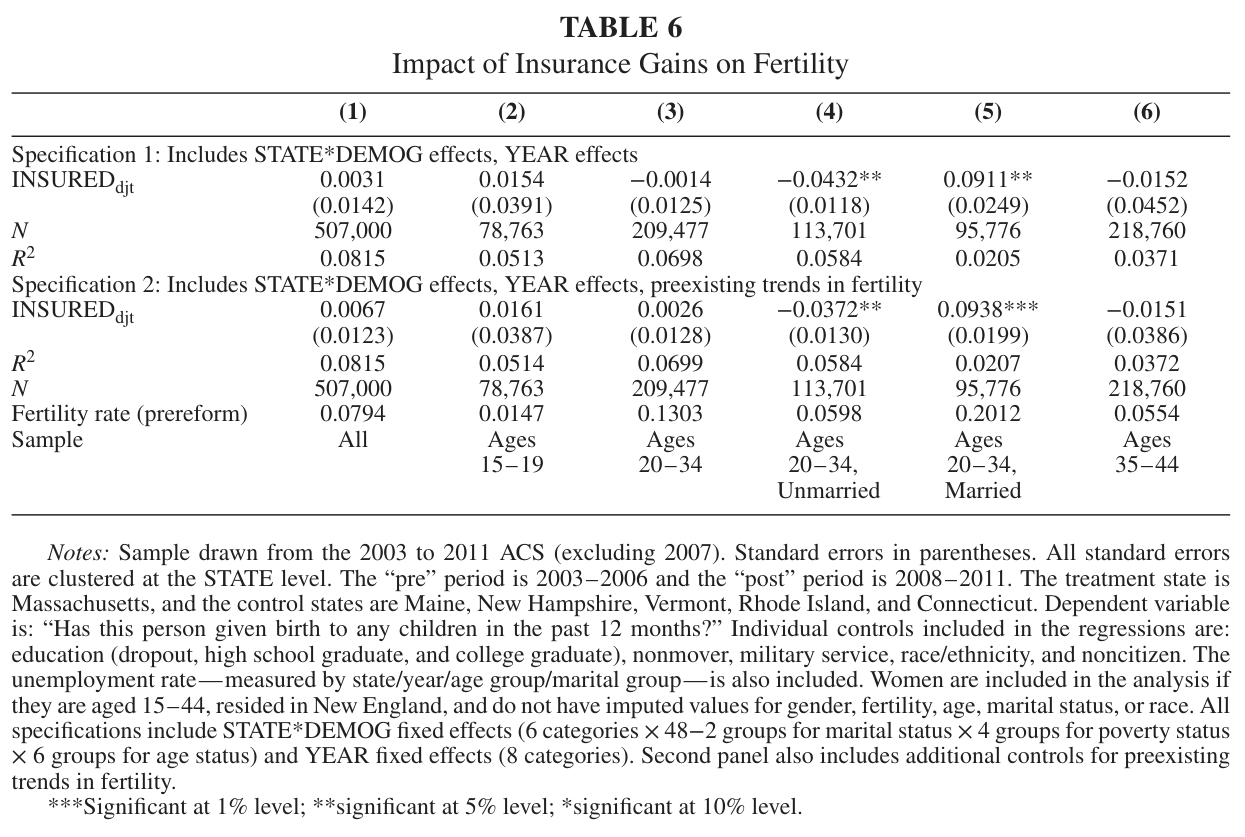
Thus, we turn to Table 6, which estimates Equation (1), by including the parameterized insurance rate. Table S2 provides sensitivity checks. As in the previous table, when one looks at the full sample or particular age groups, insurance gains appear to have little effect on overall fertility. Yet, as shown in columns (4) and (5), there are opposite-signed effects for unmarried and married women aged 20–34. Although not shown, coefficient estimates are insignificant and much smaller for other age/marital status groups. For unmarried women aged 20–34, insurance coverage increased by 11.5 percentage points due to the Massachusetts law.14 With a coefficient estimate of −0.0432, this would imply that fertility fell by −0.50 percentage points. Since the prereform baseline fertility in the ACS was 5.98%, then fertility fell by 8.3%. This result is similar in magnitude to Kearney and Levine (2009), who find that Medicaid eligibility for family planning services led to a 15% decline in birth rates for 20–24-year-old women. For married women in the same age group, our results indicate that gains in insurance coverage led to increased fertility. The overall gain in insurance coverage was 2.5 percentage points, leading to an increase in fertility of 0.23 percentage points from a much higher baseline of 20.1%. Thus, among married women, fertility increased by around 1.1%.151617
Given evidence that in Massachusetts the Medicaid expansion crowded out private
insurance (Kolstad and Kowalski 2012), one could argue that the effect on married women is due to the lack of access to their regular health care provider rather than the lower cost of having a child. In principle, crowd-out of private insurance with Medicaid should affect quality of coverage for both single and married women who initially had insurance. If the net effect of crowd-out on fertility were substantively important—relative to the well-documented sizable gains in insurance coverage for the uninsured—then loss of access of regular providers could mean less access to reliable contraception. Yet if this were the case, in theory we would see fertility rise for both married women and single women; in practice, we do not.
For single women, fertility falls dramatically, suggesting that any estimated effects relating to fertility and source of coverage are relatively small compared with the effects on gaining insurance coverage.
The model in Equation (1) assumes instant adjustment to newfound health insurance coverage. Although the individual mandate in Massachusetts started on July 1, 2007, the penalties for not complying with the mandate began at year end and enrollment soared in December 2007 (Chandra, Gruber, and McKnight 2011). This delayed enrollment, combined with lags in getting pregnant, delivering a baby, or obtaining birth control, suggests that the effects on fertility may be larger in postreform years after 2008. To explore this question, we estimated Table 6 excluding 2008. When we include preexisting trends in fertility, for unmarried women, the coefficient (standard error) is −0.0526 (0.0142), or 41% larger. These results are consistent with single women gradually adopting reliable birth control during the 2008 calendar year. For married women, the estimates are 0.0834 (0.0262), or 11% smaller. This finding is consistent with pent-up demand for pregnancies which slowed down after 2008.
C. Extensions of the Basic Results
We have conducted numerous checks of our basic results, which we summarize here. A full description is provided in Appendix S2, Supporting Information. First, we examine whether the marriage decision is endogenous to the health insurance reform, an issue previously explored by Yelowitz (1998) and Abramowitz (2016) in other contexts. We find no evidence that marital status changed with respect to reform. Second, Table 6 includes in the regression specification the main effects that comprise the INSURED variable. When we include various interaction terms, the findings for both unmarried women and married women hold up well to including additional controls. Third, we examine whether state of residence is endogenous to the reform, explored by the literature in other contexts (e.g., Marton and
Yelowitz 2015). When we restrict the sample to women who did not move across state lines in the previous year in the ACS, and estimate Equation (1) on nonmovers, our results are quite similar to the baseline results in Table 6. Fourth, we also explore whether minor health reforms in the comparison states matter for the fertility results. Maine and Vermont adopted reforms that subsidized the purchase of health insurance. The exclusion of these states from the control group had little impact on the findings. Fifth, we explore whether the grouping of women aged 20–34 is too large; when we create smaller age groupings, we find little justification for breaking out the sample further. Sixth, we explore whether the Title X network of family
planning clinics should impact the results for single women. Such clinics overwhelmingly target those with low incomes, so they should not much affect the results in our analysis, given that the largest gains in insurance coverage were experienced by individuals with incomes 250%–299% of FPL. Seventh, we
have examined an alternative definition of fertility based on the household roster. We continue to find reductions in fertility for unmarried women and increases in fertility for married women, but the coefficient estimates are smaller and not statistically significant, providing support for using the self-reported pregnancy question.
In summary, although the expansions in health insurance coverage had zero net effect on fertility in Massachusetts, substantial heterogeneity exists for different demographic groups. Our findings suggest that latent fertility and the wantedness of children, along with differential gains in coverage, help explain opposite-signed effects for married and unmarried women aged 20–34, and also explain the nonexistence of effects for other groups. Married women in this age bracket increased their fertility when experiencing gains in insurance coverage because pregnancies are largely wanted and underlying fertility is high. Single women, on the other hand, decreased their fertility because pregnancies are largely unwanted and better access to contraception helps them prevent pregnancy. For women aged 35 and older, latent fertility is relatively low (and
insurance coverage was typically high prior to the reform), so the overall fertility responses are small. For teenagers, fertility rates are also quite low, many pregnancies are unwanted, and insurance coverage was fairly high prior to the reform. Thus, we find small effects for them, too.
The two key relationships that lead to different fertility responses are the relationship between marital status and pregnancy wantedness and the relationship between insurance coverage and birth control methods. After conducting a detailed investigation of these relationships in Appendix S3, Supporting Information, we conclude that there is a strong positive correlation between marital status and pregnancy wantedness using the Pregnancy Risk Assessment Monitoring Survey from New England states for the years 2003–2011. Table S3 and Figures S1 and S2 provide further information. In addition, by using the 2004 Behavioral Risk Factor Surveillance System data for New England states, we find that insurance coverage is positively associated with physician access and the use of more effective contraceptive methods. Tables S4 and S5 provide
these estimates.
VI. CONCLUSIONS AND DISCUSSION
We examine the effect of the Massachusetts health care reform on a woman’s probability of having a baby. Although we find zero net effect on fertility for women aged 20–34, this ignores substantial heterogeneity across married and unmarried women (which proxies for child wantedness). Among young single women, fertility decreased by 8% while fertility increased by 1% for young married women. We find no effect on birth rates for teens or older women.
Whether the reform shifted the timing of births or changed the total number births remains an open question. Evidence from other policy contexts suggests the importance of timing considerations (Dickert-Conlin and Chandra 1999; Schulkind and Shapiro 2014). Furthermore, abortion and birth control access have been found to affect life-cycle fertility in the United States and abroad (Ananat, Gruber, and Levine 2007; Pop-Eleches 2010). Regardless of whether the reforms reflect timing or level effects, the proportion of unintended pregnancies—those that are mistimed, unplanned, or unwanted—fell as a result of the reform.
Our results have implications for the ACA. Expanding insurance would likely increase wanted pregnancies on a national level and decrease unwanted births. There are reasons to believe the fertility reductions for single women would be larger with ACA. First, health insurance coverage was quite high in Massachusetts. Larger changes in insurance coverage would lead to larger reductions in fertility. Second, abortion and family planning services are more accessible in Massachusetts even without insurance (Guttmacher Institute 2015), leading to a smaller role for fertility reductions due to effective contraception. Third, the fraction of pregnancies that are unintended is lower in Massachusetts than many other states (Finer and Kost 2011). The combination of these factors suggests a larger impact from the set-up of the
health insurance marketplaces in 2014 and the employer mandate in 2015 from the ACA. There are two limiting factors. First, roughly half the states have not expanded Medicaid with the ACA. However, our estimates remain largely applicable to the ACA because only 24% of the Medicaid enrollment growth in Massachusetts was related to the reform.18 Second, although under ACA all new health plans must cover certain women’s preventive services with no copayments, including contraceptive counseling and the full range of FDA approved contraception methods, the Supreme Court’s decision in Burwell v. HobbyLobby exempted closely held corporations from providing coverage of contraception if such provisions violate the owners’ religious beliefs.
References
Abramowitz, J. “Saying ‘I Don’t’: The Effect of the Affordable Care Act Young Adult Provision on Marriage.” Journal of Human Resources , 51(4), 2016, 933–60.
Ananat, E. O., J. Gruber, and P. B. Levine. “Abortion Legalization and Life-Cycle Fertility.” Journal of Human Resources , 42(2), 2007, 375–97.
Bernstein, A. B., R. A. Cohen, K. M. Brett, M. A. Bush. “Marital Status Is Associated with Health Insurance Coverage for Working-age Women at All Income Levels, 2007,” NCHS Data Brief, No. 11. Hyattsville, MD: National Center for Health Statistics, 2008.
Bitler, M. P., and L. Schmidt. “Utilization of Infertility Treatments: The Effects of Insurance Mandates.” Demography , 49(1), 2012, 125–49.
Chakrabarti, R., and J. Roy. “Do Charter Schools Crowd Out Private School Enrollment? Evidence from Michigan.” Journal of Urban Economics , 91, 2016, 88–103.
Chandra, A., J. Gruber, and R. McKnight. “The Importance of the Individual Mandate—Evidence from Massachusetts.” New England Journal of Medicine , 364(4), 2011, 293–95.
Childbirth Connection. “Facility Labor and Birth Charges by Site and Mode of Birth, United States, 2009–2011.” 2015. Accessed January 3, 2016. http://transform.childbirthconnection.org/resources/datacenter/chargeschart/
Courtemanche, C., and D. Zapata. “Does Universal Coverage Improve Health? The Massachusetts Experience.” Journal of Policy Analysis and Management , 33(1), 2014, 36–69.
Courtemanche, C., J. Marton, B. Ukert, A. Yelowitz, and D. Zapata. “Impacts of the Affordable Care Act on Health Insurance Coverage in Medicaid Expansion and Non-Expansion States.” Journal of Policy Analysis and Management , 36(1), 2017, 178–210.
Dehejia, R., and A. Lleras-Muney. “Booms, Busts, and Babies’ Health.” Quarterly Journal of Economics , 119(3), 2004, 1091–130.
DeLeire, T., L. Lopoo, and K. Simon. “Medicaid Expansions and Fertility in the United States.” Demography , 48(2), 2011, 725–47.
Dennis, A., J. Clark, D. Córdova, J. McIntosh, K. Edlund, B. Wahlin, and K. Blanchard. “Access to Contraception after Health Care Reform in Massachusetts: A Mixed-Methods Study Investigating Benefits and Barriers.” Contraception , 85(2), 2012, 166–72.
Dickert-Conlin, S., and A. Chandra. “Taxes and the Timing of Births.” Journal of Political Economy , 107(1), 1999, 161–77.
Finer, L. B., and K. Kost. “Unintended Pregnancy Rates at the State Level.” Perspectives on Sexual and Reproductive Health , 43(2), 2011, 78–87.
Finer, L. B., and M. Zolna. “Unintended Pregnancy in the United States: Incidence and Disparities, 2006.” Contraception , 84(5), 2011, 478–85.
Finkelstein, A. “The Aggregate Effects of Health Insurance: Evidence from the Introduction of Medicare.” Quarterly Journal of Economics , 122(3), 2007, 1–37.
Gold, R. “Family Planning Centers Meet Health Care Reform: Lessons from Massachusetts.” Guttmacher Policy Review , 12(3), 2009, 2–10.
Gruber, J., and A. Yelowitz. “Public Health Insurance and Private Savings.” Journal of Political Economy , 107(6), 1999, 1249–74.
Guttmacher Institute. “Induced Abortion in the United States.” 2015. Accessed January 3, 2016. http://www.guttmacher.org/pubs/fb_induced_abortion.html
Hackmann, M., J. Kolstad, and A. Kowalski. “Health Reform, Health Insurance, and Selection: Estimating Selection into Health Insurance Using the Massachusetts Health Reform.” American Economic Review , 102(3), 2012, 498–501.
Kearney, M., and P. Levine. “Subsidized Contraception, Fertility, and Sexual Behavior.” Review of Economics and Statistics , 91(1), 2009, 137–51.
Kolstad, J., and A. Kowalski. “The Impact of Health Care Reform on Hospital and Preventive Care: Evidence from Massachusetts.” Journal of Public Economics , 96(11), 2012, 909–29.
Kolstad, J., and A. Kowalski. “Mandate-Based Health Reform and the Labor Market: Evidence from the Massachusetts Reform.” Journal of Health Economics , 47, 2016, 81–106.
Long, S., K. Stockley, and A. Yemane. “Another Look at the Impacts of Health Reform in Massachusetts: Evidence Using New Data and a Stronger Model.” American Economic Review , 99(2), 2009, 508–11.
Marton, J., and A. Yelowitz. “Health Insurance Generosity and Conditional Coverage: Evidence from Medicaid Managed Care in Kentucky.” Southern Economic Journal , 82(2), 2015, 535–55.
Massachusetts Medicaid Policy Institute. “MassHealth Enrollment Growth Since Reform.” 2011. Accessed January 3, 2016. http://bluecrossfoundation.org/sites/default/files/MassHealth%20Enrollment%20Growth%20May%202011.pdf
Messer, D., and S. C. Wolter. “Time-to-Degree and the Business Cycle.” Education Economics , 18(1), 2010, 111–23.
Miller, S. “The Effect of Insurance on Emergency Room Visits: An Analysis of the 2006 Massachusetts Health Reform.” Journal of Public Economics , 96(11), 2012, 893–908.
Niedzwiecki, M. “Does Health Insurance Coverage Encourage More Efficient Use of Medical Care? Evidence from the Massachusetts Health Reform.” 2014. Accessed January 19, 2017. http://scholar.berkeley.edu/sites/default/files/niedzwiecki/files/niedzwiecki_mainsurance_jhe_final.pdf.
Pop-Eleches, C. “The Supply of Birth Control Methods, Education, and Fertility: Evidence from Romania.” Journal of Human Resources , 45(4), 2010, 971–97.
Schulkind, L., and T. M. Shapiro. “What a Difference a Day Makes: Quantifying the Effects of Birth Timing Manipulation on Infant Health.” Journal of Health Economics , 33(1), 2014, 139–58.
Sommers, B., R. Kronick, K. Finegold, R. Po, K. Schwartz, S. Glied. “Understanding Participation Rates in Medicaid: Implications for the Affordable Care Act.” ASPE Issue Brief, Department of Health & Human Services, 2012.
Swartz, K. “Interpreting the Estimates from Four National Surveys of the Number of People without Health Insurance.” Journal of Economic and Social Measurement , 14(3), 1986, 233–42.
The Henry J. Kaiser Family Foundation. “Focus on Health Reform.” June 2007. Accessed January 3, 2016. https://kaiserfamilyfoundation.files.wordpress.com/2013/01/7494-02.pdf
Yelowitz, A. “Is Health Care Coverage a Pro-Natal Policy?” Unpublished Ph.D. dissertation, 1994.
Yelowitz, A. “Will Extending Medicaid to Two-Parent Families Encourage Marriage?” Journal of Human Resources , 33(4), 1998, 833–65.
Yelowitz, A., and Cannon, M. “The Massachusetts Health Plan: Much Pain, Little Gain.” Cato Policy Analysis Paper No. 657, Cato Institute, Washington, DC, 2010.
Zavodny, M., and M. Bitler. “The Effect of Medicaid Eligibility Expansions on Fertility.” Social Science & Medicine , 71(5), 2010, 918–24.
Supporting Information
Additional Supporting Information may be found in the online version of this article:
- Appendix S1. Timeline of the Massachusetts Health Reform
- Appendix S2. Extensions of Basic Results
- Appendix S3. Exploring the Underlying Assumptions
- Table S1. Complete Summary Statistics
- Table S2. Sensitivity Analysis
- Table S3. Does Marital Status Affect Pregnancy Wantedness?
- Table S4. Does Health Insurance Affect Access to Primary Care Physician?
- Table S5. Does Access to Primary Care Physicians Affect Contraception Use?
- Figure S1. Pregnancy Wantedness by Marital Status
- Figure S2. Abortion Rates in United States, New England, and Massachusetts 2003–2011 (Excluding 2007)
Notes
1. Maine, Vermont, and San Francisco enacted reforms in 2003, 2006, and 2007, respectively. Massachusetts enacted the “Act Providing Access to Affordable, Quality, Accountable Health Care” in 2006 (for a complete timeline of the reform, see Table 1 and Appendix S1, Supporting Information). The first three reforms relied on subsidies for purchasing health insurance, while the Massachusetts law also included more far-reaching provisions.
2. Birth-related expenses in the United States ranged from $2,227 to $23,111 in 2010 (Childbirth Connection 2015).
3. Other outcomes include health (Courtemanche and Zapata 2014), insurance crowd-out (Yelowitz and Cannon 2010), labor markets (Kolstad and Kowalski 2016), and adverse selection (Hackmann, Kolstad, and Kowalski 2012).
4. Official estimates for the uninsured rate in Massachusetts in 2008 were 2.6%, but Yelowitz and Cannon (2010) find that uninsured rates are underreported because the reform incentivizes people to hide their true status if they are uninsured.
5. Niedzwiecki (2014) finds an overall increase in emergency room visits, however.
6. It is also important to mention the interaction of age and marital status. One would expect that the fertility responses for older women—regardless of whether pregnancies were wanted or insurance gains were large—would be much smaller due to lower latent fertility. For teenagers, one might expect smaller fertility responses as well because the insurance gains were typically much smaller.
7. See Title 13, United States Code, Sections 141, 193, and 221. The decennial Census is a notable exception in that it is mandatory.
8. If a household misinterpreted “the last 12 months” with “the last year” or “the last calendar year,” they might report a 1-year-old as a birth.
9. It is thought that CPS answers to health insurance questions are a blend of current coverage and coverage in the previous year. Swartz (1986) argues that CPS respondents ignore the precise wording of the health insurance questions, and instead answer the question as if it referred to coverage as of the survey date.
10. We follow the existing literature in treating 2006 as a “before” year because the earliest provisions went into effect in October 2006. See Hackmann, Kolstad, and Kowalski (2012) who use annual data. Given the time horizon for pregnancy, and the wording of the question in the ACS, the vast majority of pregnancies in this year would have been prior to the reform. In addition, the ACS respondents take the survey throughout the year (and it is not possible for us to identify the date when the survey was answered). Virtually all studies classify 2007—midway through which the individual mandate was implemented—as a transition year. We exclude the transition year of 2007 when the reform was being phased in, because our interest lies in
the effects of the fully phased-in reform; thus we focus on 2008 onward as the “after” period.
11. We calculate the propensity of a woman to give birth using the Centers for Disease Control and Prevention’s (CDC) Vital Statistics data and the ACS, both from 2003. We divide the number of births from women by demographic cell from the Vital Statistics by the total number of women in the United States within this same cell from the ACS.
12. Similar methods for constructing a policy variable are consistently used by the literature examining the effect of Medicaid expansions on various outcomes. This measure is typically the fraction of the population eligible for Medicaid (DeLeire, Lopoo, and Simon 2011; Zavodny and Bitler 2010).
13. There are two reasons why we do not stratify the sample by education groupings. First, Massachusetts’ health care reform explicitly gave different subsidies based on a person’s income, and our income groupings for the INSURED variable are guided by those statutory rules. Although educational groups are correlated with income, breaking out groups in such a way does not capture the nonlinearities in the program rules. Second, with the focus on women of childbearing age, and with key findings for those aged 20–34, an important concern in using education is that for many it reflects unfinished schooling. It is also likely that the recession affected schooling decisions and duration (Messer and Wolter 2010).
14. We ran DD estimates similar to Equation (1) to calculate the change in insurance coverage.
15. It is possible that the positive effects for married women are related to newly-found coverage of infertility treatment. This is not very likely, however, because infertility tends to predominantly affect women over 35 years old.
16. The overall gain in insurance coverage for women was 4.54 percentage points, which leads to a change in fertility for the overall sample of 0.03 percentage points (with the new specification coefficient of 0.0067—which is still insignificant with a standard error of 0.0123), from a baseline of 7.94%. Thus, the overall increase in fertility for the full sample—less than 0.4%, is very small in magnitude.
17. Although coverage gains were quite modest among married women—2.5 percentage points—the coefficient would suggest that gaining coverage—that is, 100 percentage point change—would lead to a much larger change in fertility. This extrapolation, of course, is far outside of the actual policy change.
18. See Massachusetts Medicaid Policy Institute (2011).