In this article, we examine the market structure for real estate brokerage services across six large metropolitan statistical areas (MSAs) to see whether low-income neighborhoods, or neighborhoods where house prices are low, are as well served by real estate professionals as higher income or higher priced neighborhoods. We collect more than 300,000 real estate listings and compute the Herfindahl-Hirschman Index for each ZIP Code neighborhood in each MSA. When we divide neighborhoods based on income, house value, and race, we find no evidence that access is worse in disadvantaged areas; that is, the market structure for brokerage services is at least as competitive in less advantaged neighborhoods. We also analyze market leaders in the six MSAs and find that some firms, however, specialize in particular market segments.
Recommended citation
Aaron Yelowitz, Frank Scott, and Jason Beck. “The Market for Real Estate Brokerage Services in Low- and High-Income Neighborhoods: A Six-City Study.” Cityscape: A Journal of Policy Development and Research 15(1) (2013): 261–292. https://www.jstor.org/stable/41958970
Aaron Yelowitz, Frank Scott, and Jason Beck. “The Market for Real Estate Brokerage Services in Low- and High-Income Neighborhoods: A Six-City Study.” Cityscape: A Journal of Policy Development and Research 15(1) (2013): 261–292. https://www.jstor.org/stable/41958970
Complete article reading edition. Tables and figures reproduce the published source; open an image for full resolution. The PDF retains the original page layout.
Affiliations: Aaron Yelowitz and Frank Scott — University of Kentucky; Jason Beck — Armstrong Atlantic State University.
Abstract
In this article, we examine the market structure for real estate brokerage services across six large metropolitan statistical areas (MSAs) to see whether low-income neighborhoods, or neighborhoods where house prices are low, are as well served by real estate professionals as higher income or higher priced neighborhoods. We collect more than 300,000 real estate listings and compute the Herfindahl-Hirschman Index for each ZIP Code neighborhood in each MSA. When we divide neighborhoods based on income, house value, and race, we find no evidence that access is worse in disadvantaged areas; that is, the market structure for brokerage services is at least as competitive in less advantaged neighborhoods. We also analyze market leaders in the six MSAs and find that some firms, however, specialize in particular market segments.
Introduction
Residents of low-income or minority neighborhoods pay higher prices and have fewer choices for a variety of products and services. Underserved sectors include supermarkets, banks, and large drug stores,1 credit cards,2 gasoline retailing,3 and insurance.4 Allegations of “retail redlining” have led to lawsuits against companies such as General Motors Company, Wal-Mart Stores, Inc., and Burger King Corporation.5 Although differences in the performance of housing markets in low-income or minority neighborhoods have been extensively studied, most of the attention has been focused on possible redlining practices by mortgage lenders.6 Little attention has been paid to real estate middlemen—brokers and agents—in assessing the performance of urban real estate markets.7
This lack of attention is surprising, given that housing market outcomes vary greatly. Homeownership rates differ among various economic and demographic groups. Two dimensions that have probably attracted the most attention are income and race. Very low-income households have homeownership rates that are 37 percentage points lower than the rate for high-income households, whereas homeownership rates for minority households lag behind those of White households by 24 percentage points (Bunce and Reeder, 2007). Some evidence suggests that house prices paid also differ across groups. In a study of four cities, Bayer et al. (2012) found that African-American and Hispanic homebuyers paid a premium of 3 percent—a difference not explained by variation in buyer income, wealth, or access to credit.
The type and degree of services demanded by buyers and sellers differ for low- versus high-priced houses. Real estate markets tend to be thicker in lower price ranges. Product heterogeneity tends to be greater in higher price ranges. Broad agreement also exists that real estate markets are local and not national in geographic scope. Real estate brokers and agents thus compete in local markets. In large metropolitan areas, most agents and many brokers tend to specialize even more and compete in submarkets and neighborhoods within the larger metropolitan market area. This outcome is not surprising, because sellers and buyers value the localized knowledge that agents and brokers bring to the transaction.
Given all these aspects of housing markets, the question that naturally arises is, “Are the residents of low-income neighborhoods as well served by real estate agents and brokers as the residents of high-income neighborhoods?” In light of Hsieh and Moretti’s (2003) finding that when the average price of land in a city increases the fraction of real estate brokers relative to population increases and the productivity of a typical real estate agent falls, one can imagine that even in areas that are geographically proximate, different neighborhoods have different clienteles and are ripe for specialization, which may result in lower income neighborhoods being differentially served by real estate brokers and agents.
For this reason, we investigate whether submarkets within broader metropolitan markets face different levels of competitiveness among real estate brokers. This research builds on our previous work that analyzes market concentration in small, medium, and large real estate markets (Beck, Scott, and Yelowitz, 2012). We have gathered data for six large metropolitan statistical areas (MSAs): Atlanta-Sandy Springs-Marietta, GA (Atlanta MSA); Boston-Cambridge-Quincy, MA-NH (Boston MSA); Chicago-Joliet-Naperville, IL-IN-WI (Chicago MSA); Dallas-Fort Worth-Arlington, TX (Dallas MSA); Los Angeles-Long Beach-Santa Ana, CA (Los Angeles MSA); and Washington-Arlington-Alexandria, DC-VA-MD-WV (Washington, DC MSA). These MSAs were chosen for their geographic diversity, income diversity, and very different average house prices. Demographic information on income, house values, population, racial composition, and homeownership were obtained at the ZIP Code level from the 2000 census. These data were merged with information we gathered in 2011 from the National Association of REALTORS® (NAR) website (http://www.REALTOR.com) on listings by broker for each ZIP Code neighborhood.
Our final sample consists of 1,321 ZIP Codes in these six MSAs, which can be merged with the Census Bureau’s American FactFinder data and which had at least 50 multiple listing service (MLS) listings. We compute Herfindahl-Hirschman Indices (HHIs) for each MSA and then for each ZIP Code within the six MSAs.8 After presenting ZIP Code-level summary statistics for each MSA, we analyze HHIs at the ZIP Code level. We regress ZIP Code-level HHI on racial composition, median house price, median household income, and a measure of the heterogeneity of the housing stock in the neighborhood. We find that submarkets are less concentrated in neighborhoods with heterogeneity in the housing stock and greater percent non-White, but they are more concentrated in neighborhoods with higher average prices. To see whether real estate brokers tend to specialize by neighborhood, we also identify the real estate brokers with the largest market shares in low-income, low house-price, and high percentage-minority neighborhoods compared with those in high-income, high house-price, and low percentage-minority neighborhoods. We find many cases in which the market leaders differ substantially by neighborhood.
Income and Racial Gaps in Homeownership
Considerable effort has gone into understanding the determinants of homeownership rates by income, racial, and ethnic status.9 Haurin, Herbert, and Rosenthal (2007) assessed the extent of differences in homeownership rates among different socioeconomic groups and reviewed existing research on possible explanations for these differences. They first discussed factors that affect the formation of households, and then turned to the propensity for homeownership.
In addition to factors that influence household demand for homeownership, Haurin, Herbert, and Rosenthal (2007) evaluated three types of supply constraints that may restrict different households’ access to single-family housing: (1) the supply of mortgage credit may affect low-income and minority households differently, (2) racial discrimination may exist in mortgage markets, and (3) the type of housing stock may vary across different neighborhoods.
Racial or ethnic discrimination that affects access to homeownership can occur at several different levels. Munnell et al. (1996) supplemented data generated as a result of the Home Mortgage Disclosure Act with data collected by the Federal Reserve Bank of Boston from lending institutions on financial, employment, and property characteristics to see whether race plays a role in the lending decision. They found significant disparities between minority and White rejection rates, even after controlling for other factors. Yinger (1991) used data from the 1989 U.S. Department of Housing and Urban Development (HUD) Housing Discrimination Study that conducted fair housing audits. He found statistically significant differences in the treatment of African Americans and Whites and in the treatment of Hispanics and Anglos by sales and rental agents. Ondrich, Stricker, and Yinger (1998) used a similar approach to investigate the treatment of Whites, African Americans, and Hispanics by real estate brokers and also found evidence of discrimination.
These and many other studies have examined person-based discrimination. A related issue is whether the various parties involved in the supply of housing treat different types of neighborhoods differently. Berkovec et al. (1994) used individual loan records from HUD along with census tract data to study default risk characteristics and performance of Federal Housing Administration-insured mortgages. They found that loans in high-income and high house-price census tracts are less likely to default. They found no strong relationship between racial characteristics of a neighborhood and likelihood of default. Tootell (1996) addressed the issue of redlining directly by studying the racial composition of the neighborhood while controlling for the race of the applicant. He found that the racial composition of the neighborhood where a property is located is not significantly related to the lending decision. More recently, Ghent, Hernández-Murillo, and Owyang (2012) examined subprime loan pricing during 2005, and found evidence of redlining and adverse pricing for African Americans and Hispanics.
Conceptual Framework
Yet to be analyzed is whether the supply of real estate professionals and market structure of real estate brokerage differs by neighborhood characteristics.10 In a nondiscriminatory competitive market characterized by free entry, we would expect real estate middlemen to pursue profitable opportunities wherever they occur. In equilibrium, agents and brokers would list and sell properties and be compensated for their services at prices that yielded the same return in low-income neighborhoods as in high-income neighborhoods and in ZIP Codes where house prices are low as in ZIP Codes where prices are high. Only the profit opportunities, and not the racial and ethnic characteristics of a neighborhood, would affect agents’ and brokers’ supply decisions.
Geographically proximate neighborhoods can differ markedly in per capita income and ethnic and racial composition. Average home prices can also differ significantly by neighborhood. The prevailing method of compensating real estate agents and brokers involved in a housing transaction is that the seller pays a fixed percentage commission on the selling price of the home. This structure limits how real estate agents and brokers are compensated for their services. Payment for services rendered may be more closely connected to the selling price of the product than to the costs incurred in facilitating the transaction.
Both the buying and selling sides of a real estate transaction have fixed and variable components of cost.11 It is also the case that to a large degree costs are endogenous; that is, agents and brokers determine the level of effort and expense involved in listing and selling a particular house. The nature of costs combined with the fixed percentage commission structure means that the profitability of any transaction is likely to increase with the selling price of the house.12 It is entirely plausible that real estate brokers and agents may be less likely to enter and serve neighborhoods where home prices are relatively low.
Given the relatively low homeownership rates among low-income and minority households, a natural question to ask is whether neighborhoods with higher proportions of low-income or minority households, where home prices may be relatively lower, are underserved by real estate middlemen. If brokers avoid neighborhoods, then a lack of competition among agents and brokers may lead to higher commissions and reduced services for residents of such neighborhoods.13 Competitiveness in real estate brokerage has been a concern of the Antitrust Division of the U.S. Department of Justice (DOJ) and the Federal Trade Commission (FTC) for a long time. The two agencies issued a joint report on competitiveness in the real estate industry in 2007. They cited anecdotal evidence of high concentration levels in local real estate markets as cause for concern.14
The general concern about competition in real estate brokerage alongside the differential rates of homeownership by income and race suggests an analysis of concentration levels by neighborhood. The structural question that we analyze is whether low-income, low house-price, or high fraction-minority neighborhoods face access issues by real estate brokers; that is, do brokers avoid low-income and low house-price neighborhoods because it is less profitable to do business there? If so, the lack of competition may lead to less market activity and relatively higher prices for real estate services. Similarly, do brokers as an industry discriminate against and avoid minority-dominated neighborhoods, possibly leading to lower levels of service and higher commissions for real estate services?
To answer these questions, we chose six large MSAs: the Atlanta, Boston, Chicago, Dallas, Los Angeles, and Washington, DC MSAs. We gathered data that enable us to analyze the number and market shares of real estate brokers serving each ZIP Code neighborhood. We combined these data with census data on income, house values, and racial composition, so that we can determine whether the supply of real estate brokerage services differs by income, house price, or racial composition in a neighborhood.
Data
We collected data from REALTOR.com in April 2011 for all ZIP Codes in the Atlanta, Boston, Chicago, Dallas, Los Angeles, and Washington DC MSAs. This website is maintained by the NAR and allows for users to search real estate listings throughout the country by city or ZIP Code. It provides a nationally consistent source of data on local real estate markets. According to GAO (2005), approximately 95 percent of all homes listed on MLSs around the country are contained on REALTOR.com. Because the brokerage firm listing the house is reported, we are able to record all the listings in each MSA at a point in time and thereby analyze local market structure. In the appendix, we provide a comprehensive analysis of the extent to which the NAR data appear to summarize the full housing market, because other options like for sale by owner or listing exclusively on the local MLS (but not REALTOR.com) are ignored in the subsequent analysis. The short answer is that the NAR data appear to summarize the vast majority of market activity, not only for each of the six MSAs but for individual neighborhoods as well.15
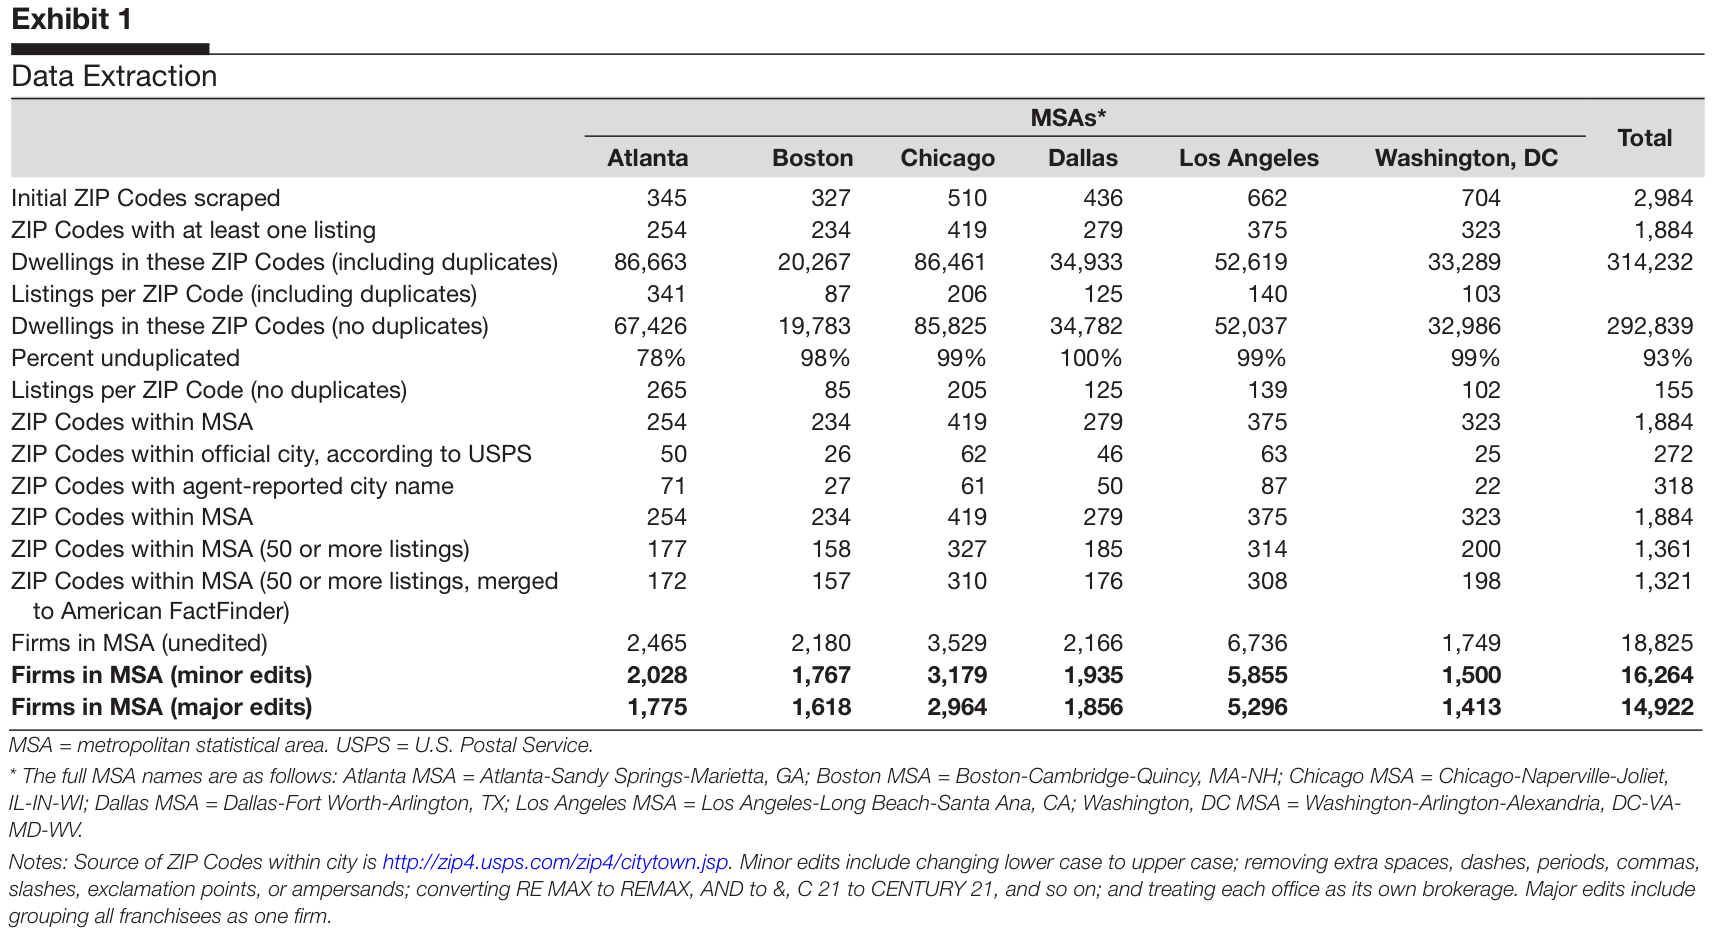
We gathered information on all single-family homes, townhomes, and condominiums within each ZIP Code, including the dwelling’s address, city, lot size, bedrooms, bathrooms, listing broker, and unique URL link. Using a web-scraping program, we attempted to collect information from 2,984 ZIP Codes within these six MSAs; within those ZIP Codes our program collected more than 300,000 listings. Some ZIP Codes did not contain any listings, most often because they were post office boxes or unique ZIP Codes (for example, related to a government facility). Overall, 1,884 ZIP Codes had at least one real estate listing. The amount of real estate activity in each MSA differed substantially. For example, the Atlanta MSA had 265 real estate listings per ZIP Code, more than three times higher than the Boston MSA’s average of 85.16
We compiled a list of firms in each market from the core dataset of 314,232 real estate listings. This task was nontrivial, because real estate listings by the same office often have slightly different names. Consider, for example, Keller Williams Realty, Inc. (Keller Williams) franchisees in the Atlanta MSA. According to the Keller Williams website, the company has 32 offices in the Atlanta area.17 One of the larger franchisee offices is “Keller Williams Realty Atlanta Partners.” Various listings in the Atlanta MSA substitute the word “Ptnrs” or “Part” or “Part.” or “Ptnr” for the word “Partners.” Other listings substitute the word “Atl” or “Atl.” for the word “Atlanta.” Some other listings substitute “Rlty” or “Re” for the word “Realty.” A few listings use the abbreviations “KW” or “Keller Wms” for “Keller Williams.” Overall, the six MSAs contained 18,825 unique names for offices or firms, although clearly from this example, a particular real estate brokerage firm can have multiple unique names in the data.
To create the HHI for each MSA and for each ZIP Code, we had to perform the particularly time-intensive task of editing the firm names in defensible ways. Our first approach was to make extremely minor changes to office names, and then to treat each office as a unique firm. These minor changes included changing all lower case letters to upper case, removing extra spaces, dashes, periods, commas, slashes, explanation points, and converting obvious abbreviations (for example, “C 21” to “CENTURY 21”). After these minor changes were made, 16,264 firms existed across the six MSAs, varying from 1,767 in the Boston MSA to 5,855 in the Los Angeles MSA. To the extent that some of the individual offices identified by this process are parts of larger multilocation brokerage firms, then this “minor change” approach understates the HHI in the locality. Our second approach was to make “major edits,” the most important of which is grouping all listings with a given franchise name and treating them as part of the same firm. For example, this approach would group the 32 Keller Williams offices in the Atlanta MSA into one firm.18 As a consequence, this method likely overstates market concentration. The “major edit” approach leads to 14,922 firms across all areas, varying from 1,618 in the Boston MSA to 5,296 in the Los Angeles MSA. In this way, we are able to provide lower and upper bounds on the size distribution of firms in each given market.
From the initial 1,884 ZIP Codes with real estate listings in the MSAs, we created various geographies besides the MSA. In one specification, we restrict ZIP Codes to those that are officially in the central city according to the U.S. Postal Service (USPS).19 These political jurisdictions yield many fewer ZIP Codes, as illustrated in exhibit 1. In another specification, we rely on agent-reported city names, even if the city name is inconsistent with the official name in the ZIP Code. This specification again yields many fewer ZIP Codes.
The MSA sample of ZIP Codes forms the starting point for much of our analysis on disparities in market structure by income, house value, or race. From the initial sample of 1,884 ZIP Codes, we restrict the sample to the 1,361 ZIP Codes with at least 50 or more real estate listings. By doing so, we believe that our computation of HHI will not be mechanically influenced by small sample sizes (for example, the HHI must be 10,000 if only one listing exists in a ZIP Code, and cannot be lower than 5,000 if two listings exist). We then append data from American FactFinder, drawing on the 2000 census.20 Overall, approximately 97
percent of ZIP Codes—or 1,321 of 1,361—had information tabulated from the decennial census. We chose three critical characteristics at the ZIP Code level—median value of single-family owner-occupied homes, median family income, and percent White—from the FactFinder tool.
Empirical Results
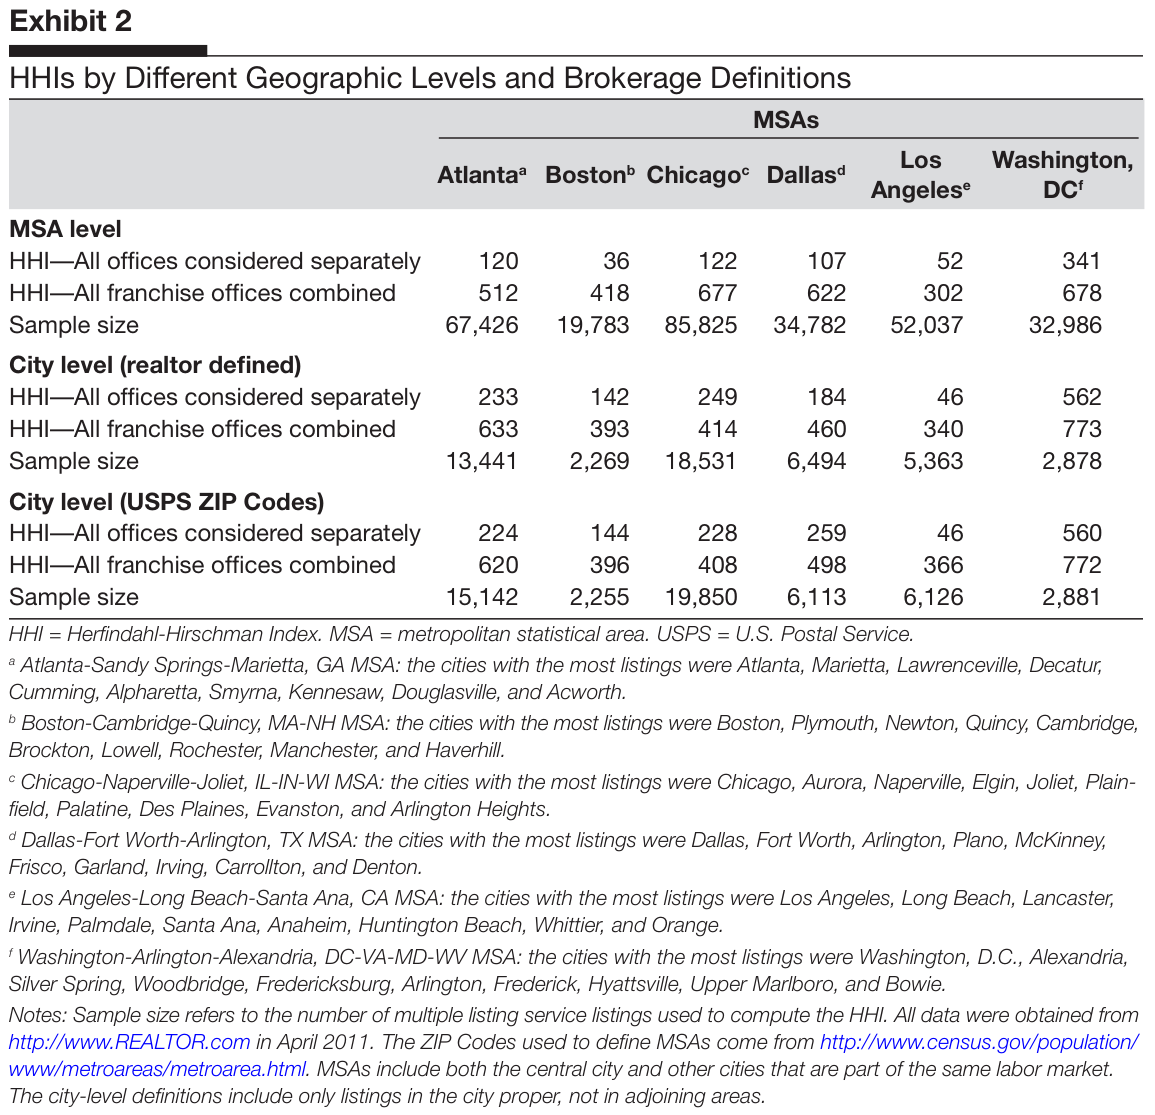
Our goal in this article is to divide large markets (MSAs) into neighborhoods (ZIP Codes) where we can obtain demographic information on income, house values, population, and homeownership for 2000, merged with concentration levels from 2011, and use these data to investigate whether the market structure for real estate brokerage services is fundamentally different in low-income, low house-price, or high-minority neighborhoods. Exhibit 2 contains HHIs computed for each of the six cities at the MSA level, the city level where the listing real estate agent inputs the city, and at the city level as defined by the USPS ZIP Code. We include HHIs where all offices are considered separately, and where all offices of each franchisor are treated as part of one firm.
At the MSA level, HHIs range from 36 to 341 when all offices are considered separately and from 302 to 678 when all offices of a franchisor are combined. HHIs are slightly higher when calculated at the city level, but not appreciably. All are clearly in the range considered unconcentrated by the DOJ and the FTC when evaluating horizontal mergers.21
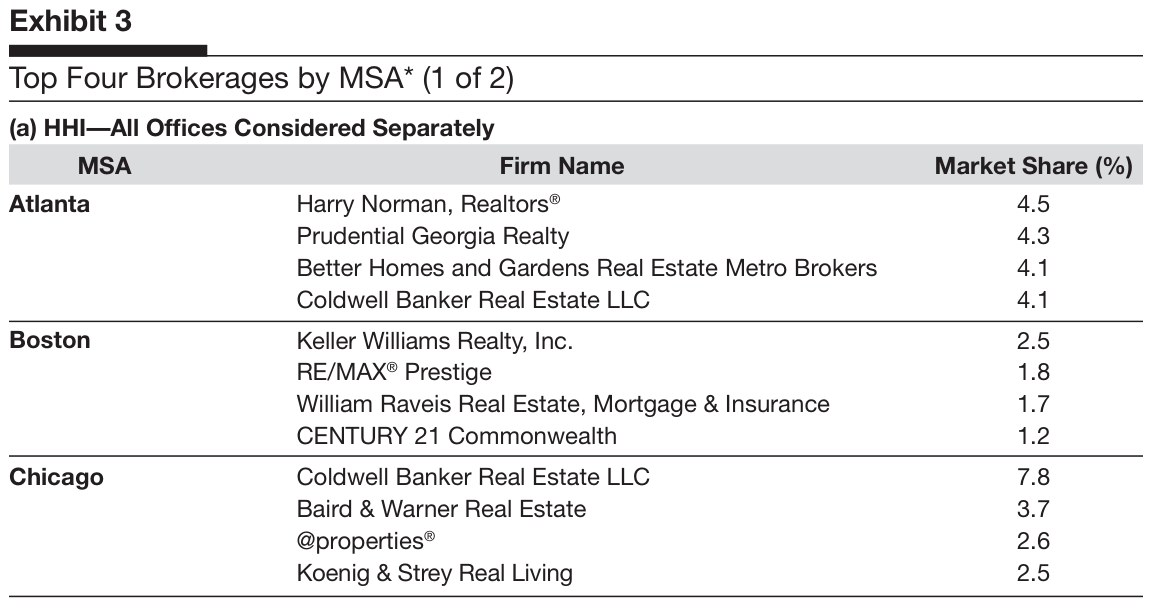
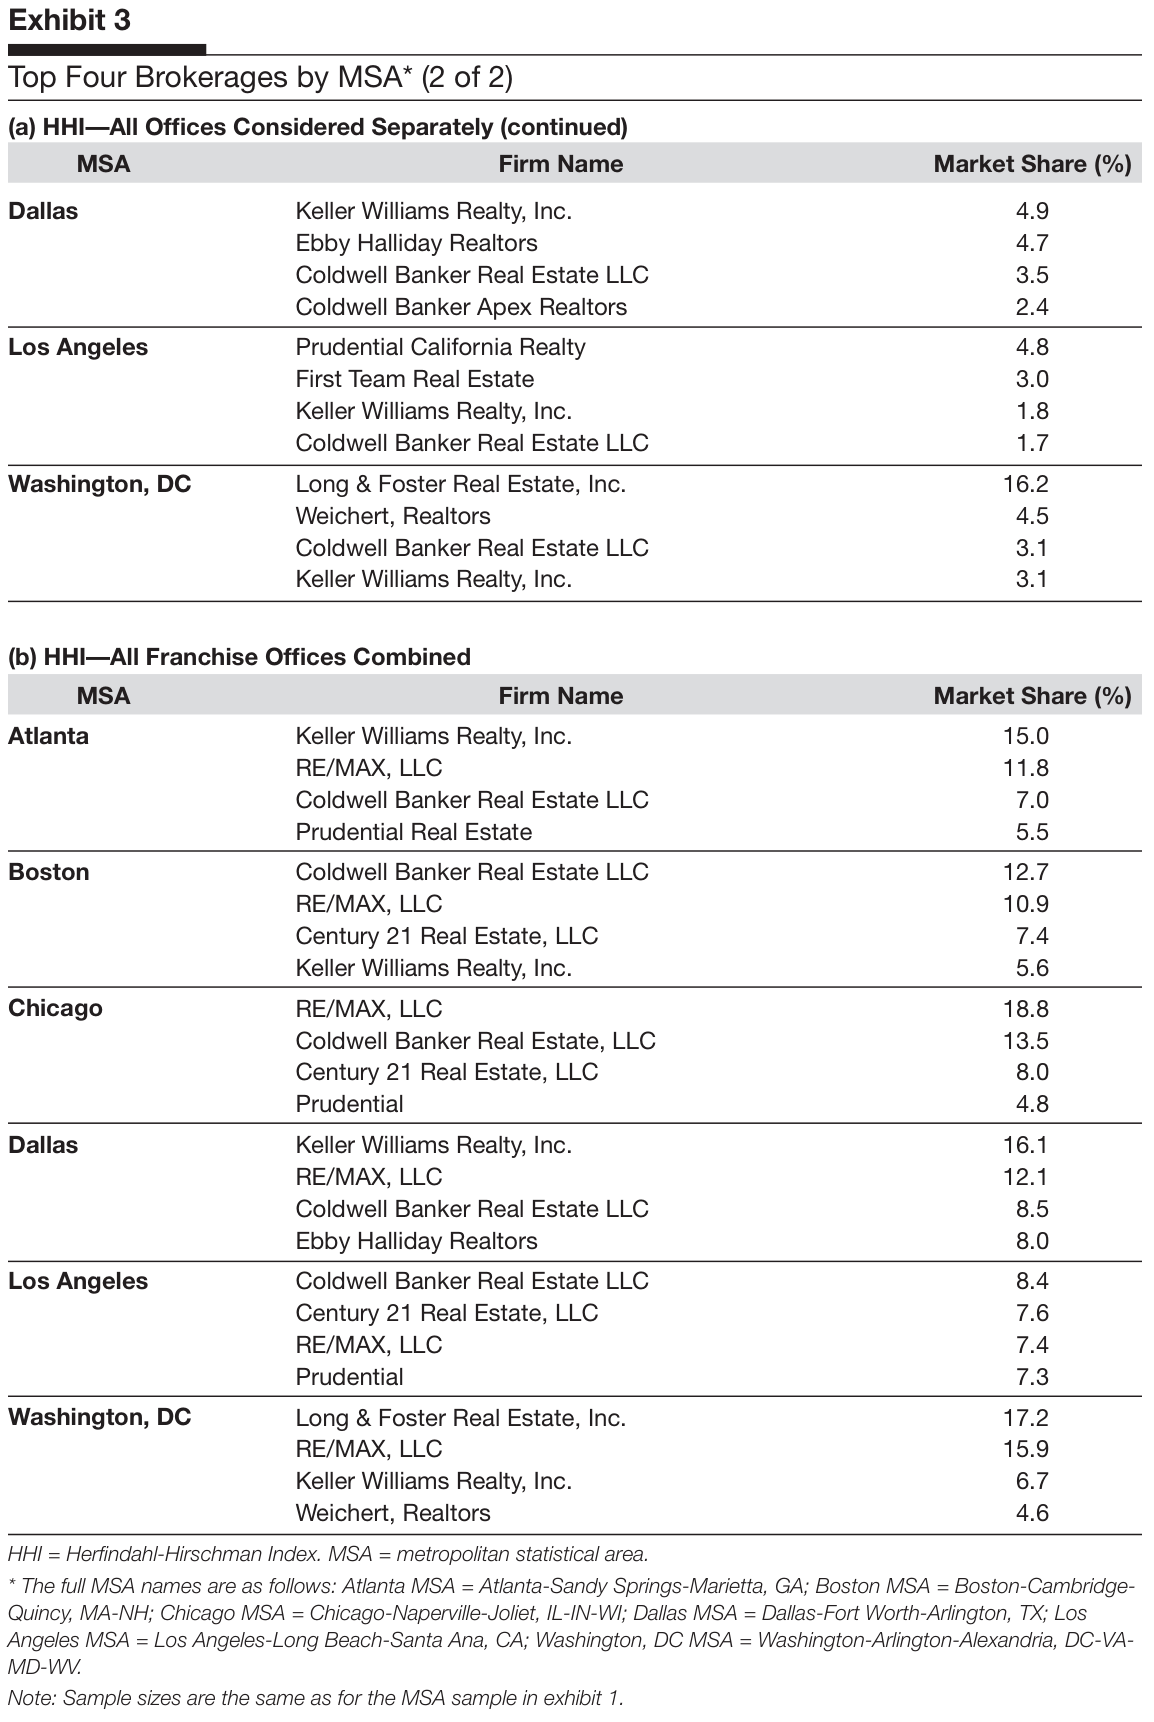
This point is reinforced when we examine market shares of the top four brokerages in each MSA. Exhibit 3a contains this information when all offices are considered separately, and exhibit 3b does the same when all offices of a franchisor are combined. At the MSA level, even the largest real estate broker has less than a 5-percent market share in the Atlanta, Boston, Dallas, and Los Angeles MSAs when each office is considered as an independent firm. In the Chicago MSA, the largest broker has 7.8 percent of the market, and in the Washington, DC MSA, the largest broker has a 16.2-percent market share. When we treat all offices of a franchisor as one firm, a slightly different picture emerges. The larger franchisors in each MSA now have market shares in the teens, although none have as much as 20 percent of the market for real estate listings in the entire MSA.
These results confirm our previous research that indicated a lack of concentration in markets for real estate brokerage in larger urban areas.22 Now we turn our attention to smaller submarkets within the larger MSAs.
Exhibit 2. HHIs by Different Geographic Levels and Brokerage Definitions
HHI = Herfindahl-Hirschman Index. MSA = metropolitan statistical area. USPS = U.S. Postal Service. a Atlanta-Sandy Springs-Marietta, GA MSA: the cities with the most listings were Atlanta, Marietta, Lawrence ville, Decatur, Cumming, Alpharetta, Smyrna, Kennesaw, Douglasville, and Acworth. b Boston-Cambridge-Quincy, MA-NH MSA: the cities with the most listings were Boston, Plymouth, Newton, Quincy, Cambridge, Brockton, Lowell, Rochester, Manchester, and Haverhill. c Chicago-Naperville-Joliet, IL-IN-WI MSA: the cities with the most listings were Chicago, Aurora, Naperville, Elgin, Joliet, Plainfield, Palatine, Des Plaines, Evanston, and Arlington Heights. d Dallas-Fort Worth-Arlington, TX MSA: the cities with the most listings were Dallas, Fort Worth, Arlington, Plano, McKinney, Frisco, Garland, Irving, Carrollton, and Denton. e Los Angeles-Long Beach-Santa Ana, CA MSA: the cities with the most listings were
Los Angeles, Long Beach, Lancaster, Irvine, Palmdale, Santa Ana, Anaheim, Huntington Beach, Whittier, and Orange. f Washington-Arlington-Alexandria, DC-VA-MD-WV MSA: the cities with the most listings were Washington, D.C., Alexandria, Silver Spring, Woodbridge, Fredericksburg, Arlington, Frederick, Hyattsville, Upper Marlboro, and Bowie.
Notes: Sample size refers to the number of multiple listing service listings used to compute the HHI. All data were obtained from http://www.REALTOR.com in April 2011. The ZIP Codes used to define MSAs come from http://www.census.gov/population/www/metroareas/metroarea.html. MSAs include both the central city and other cities that are part of the same labor market.
The city-level definitions include only listings in the city proper, not in adjoining areas. (a) HHI—All Offices Considered Separately
The Market for Real Estate Brokerage Services in Low- and High-Income Neighborhoods: A Six-City Study MSA Firm Name Market Share (%) Top Four Brokerages by MSA* (2 of 2) Dallas Keller Williams Realty, Inc. 4.9 Ebby Halliday Realtors 4.7 Coldwell Banker Real Estate LLC 3.5 Coldwell Banker Apex Realtors 2.4 Los Angeles Prudential California Realty 4.8 First Team Real Estate 3.0 Keller Williams Realty, Inc. 1.8 Coldwell Banker Real Estate LLC 1.7 Washington, DC Long & Foster Real Estate, Inc. 16.2 Weichert, Realtors 4.5 Coldwell Banker Real Estate LLC 3.1 Keller Williams Realty, Inc. 3.1 MD-WV.
Note: Sample sizes are the same as for the MSA sample in exhibit 1. MSA Firm Name Market Share (%) (b) HHI—All Franchise Offices Combined Atlanta Keller Williams Realty, Inc. 15.0 RE/MAX, LLC 11.8 Coldwell Banker Real Estate LLC 7.0 Prudential Real Estate 5.5 Boston Coldwell Banker Real Estate LLC 12.7 RE/MAX, LLC 10.9 Century 21 Real Estate, LLC 7.4 Keller Williams Realty, Inc. 5.6 Chicago RE/MAX, LLC 18.8 Coldwell Banker Real Estate, LLC 13.5 Century 21 Real Estate, LLC 8.0 Prudential 4.8 Dallas Keller Williams Realty, Inc. 16.1 RE/MAX, LLC 12.1 Coldwell Banker Real Estate LLC 8.5 Ebby Halliday Realtors 8.0 Los Angeles Coldwell Banker Real Estate LLC 8.4 Century 21 Real Estate, LLC 7.6 RE/MAX, LLC 7.4 Prudential 7.3 Washington, DC Long & Foster Real Estate, Inc. 17.2 RE/MAX, LLC 15.9 Keller Williams Realty, Inc. 6.7 Weichert, Realtors 4.6
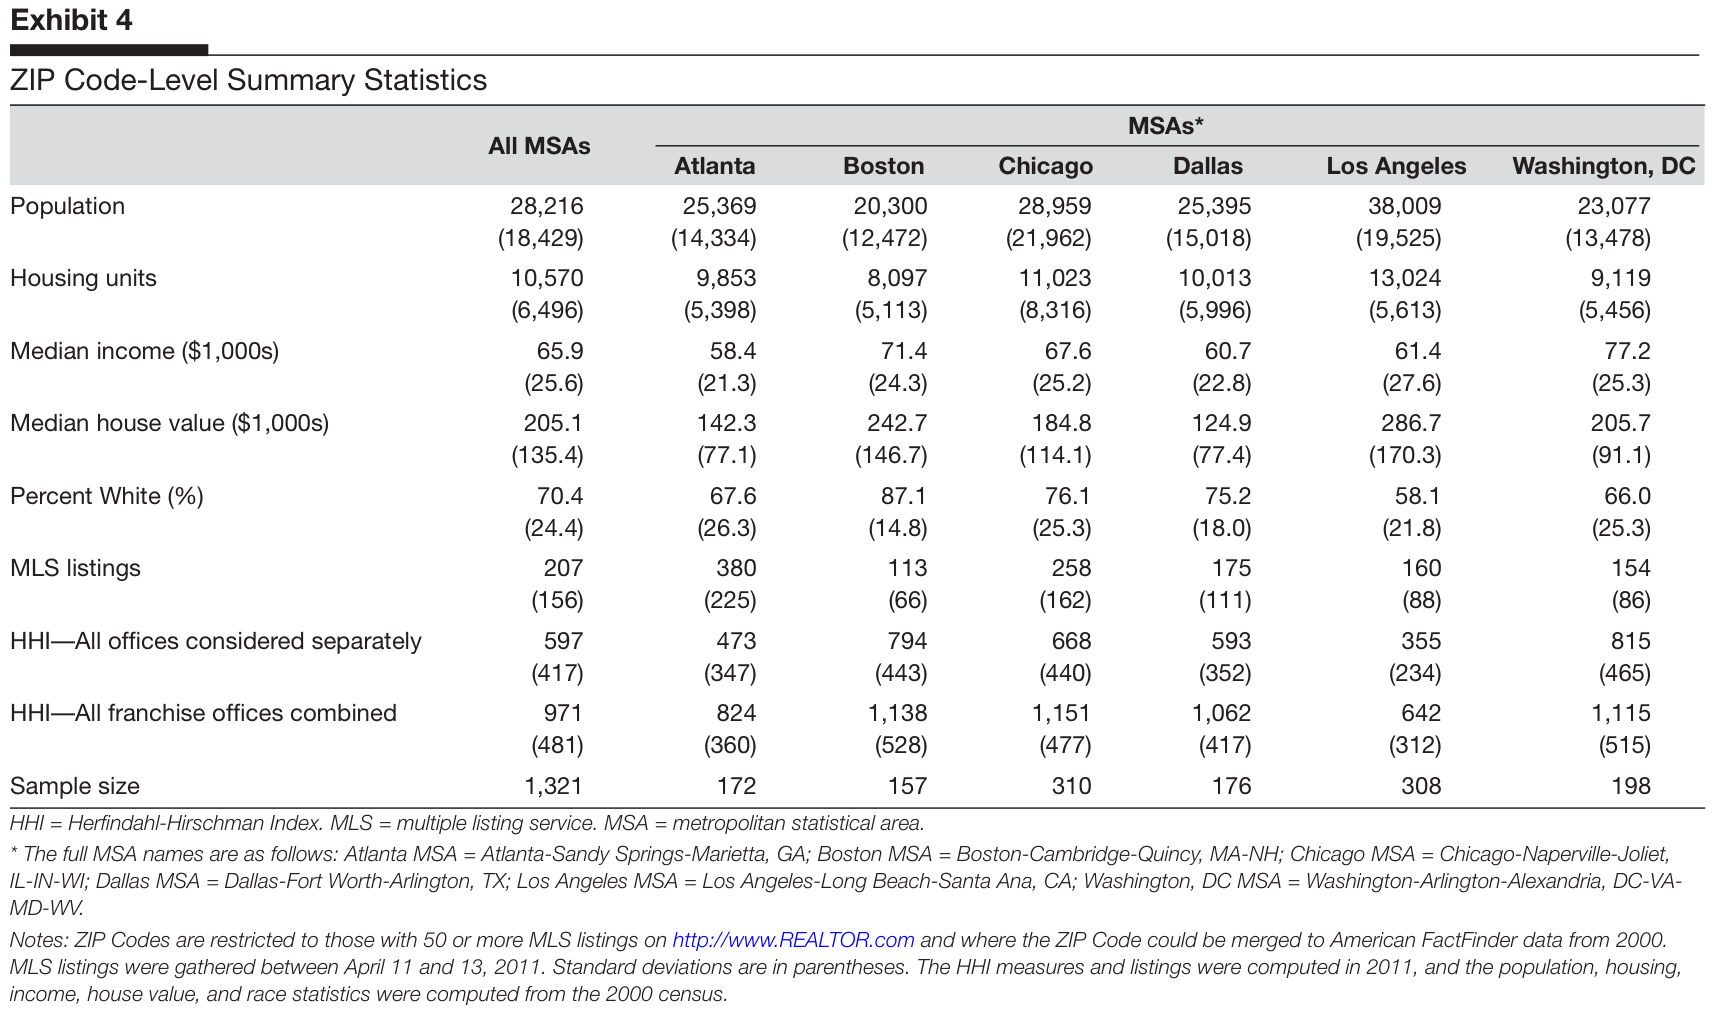
within the larger MSAs. Exhibit 4 contains summary statistics at the ZIP Code level for each of the six MSAs in our sample. Average population per ZIP Code area varies from 20,300 in the Boston MSA to 38,009 in the Los Angeles MSA. The Boston MSA had the fewest housing units per ZIP Code, 8,097, and the Los Angeles MSA had the most, 13,024. Median income ranged from $58,400 in the Atlanta MSA to $77,200 in the Washington, DC MSA. Considerable variation exists across MSAs in median house value, with housing being the cheapest in the Dallas MSA (median = $124,900) and most expensive in the Los Angeles MSA (median = $286,700). The percentage of the population classified as White varies from 58.1 percent in the Los Angeles MSA to 87.1 percent in the Boston MSA. Finally, the level of housing market activity varies considerably as well. The Boston MSA contained only 113 MLS listings per ZIP Code, which is less than one-third of the level in the Atlanta MSA, which contained 380 MLS listings per ZIP Code.
Exhibit 4 also contains HHIs computed at the ZIP Code level and averaged across the entire urban area for each of the six MSAs. Again, we compute HHIs when all franchise offices are considered separately and when all offices of a franchisor are combined. Considering all franchise offices separately yields average HHIs that range from 355 in the Los Angeles MSA to 815 in the Washington, DC MSA. Combining all offices of each franchisor and treating them as one firm yields average HHIs that range from 642 in the Los Angeles MSA to 1,151 in the Chicago MSA. None of the six MSAs on average has market structures at the ZIP Code level that fall into the moderately concentrated level according to the 2010 Horizontal Merger
Guidelines. These average HHIs also fall in the middle of the range of HHIs that we observed when we analyzed small markets (fewer than 1,000 listings) in our 2012 study.23
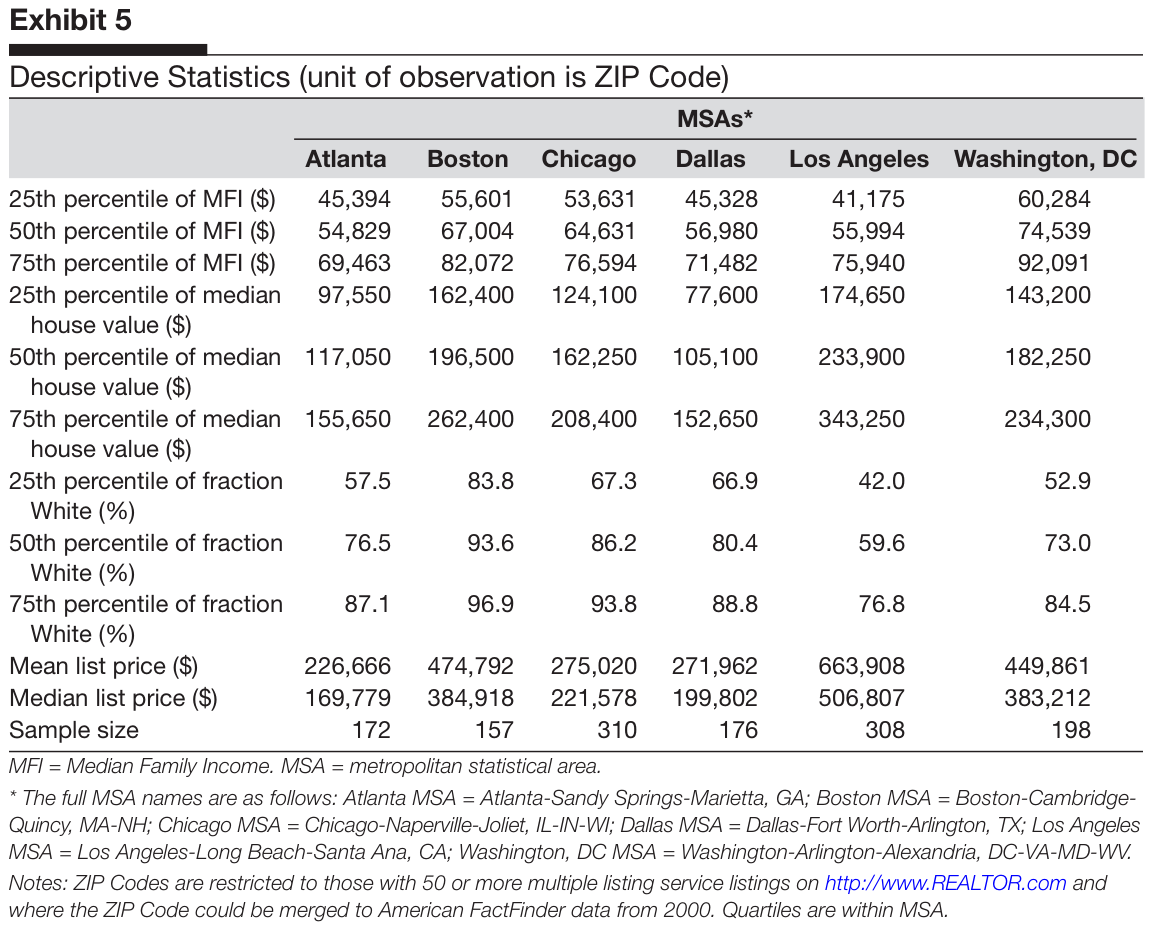
We are now ready to address the main topic of this article—are low-income, low house-price, or high-minority neighborhoods served differentially by the real estate brokerage industry? We have ranked ZIP Codes in each of the six MSAs by median income quartile, by median house value, and by percent of the population classified as White. Exhibit 5 contains the 25th, 50th, and 75th percentile cutoffs for median income, median house value, and fraction White in each of the six MSAs. Unsurprisingly, considerable variation exists. For example, in one-fourth of the 172 ZIP Codes in the Atlanta MSA, less than 57.5 percent of the population is White, and moving from the 25th to the 75th percentile of ZIP Code neighborhoods results in a 30-percentage-point increase in fraction White. A similar change in the Boston MSA results in a much smaller (13 percentage points) change. Moving from the 25th to the 75th percentile in median house value in the Atlanta MSA results in a $58,000 change in price, whereas a similar movement in the Los Angeles MSA results in a $168,000 change in price.
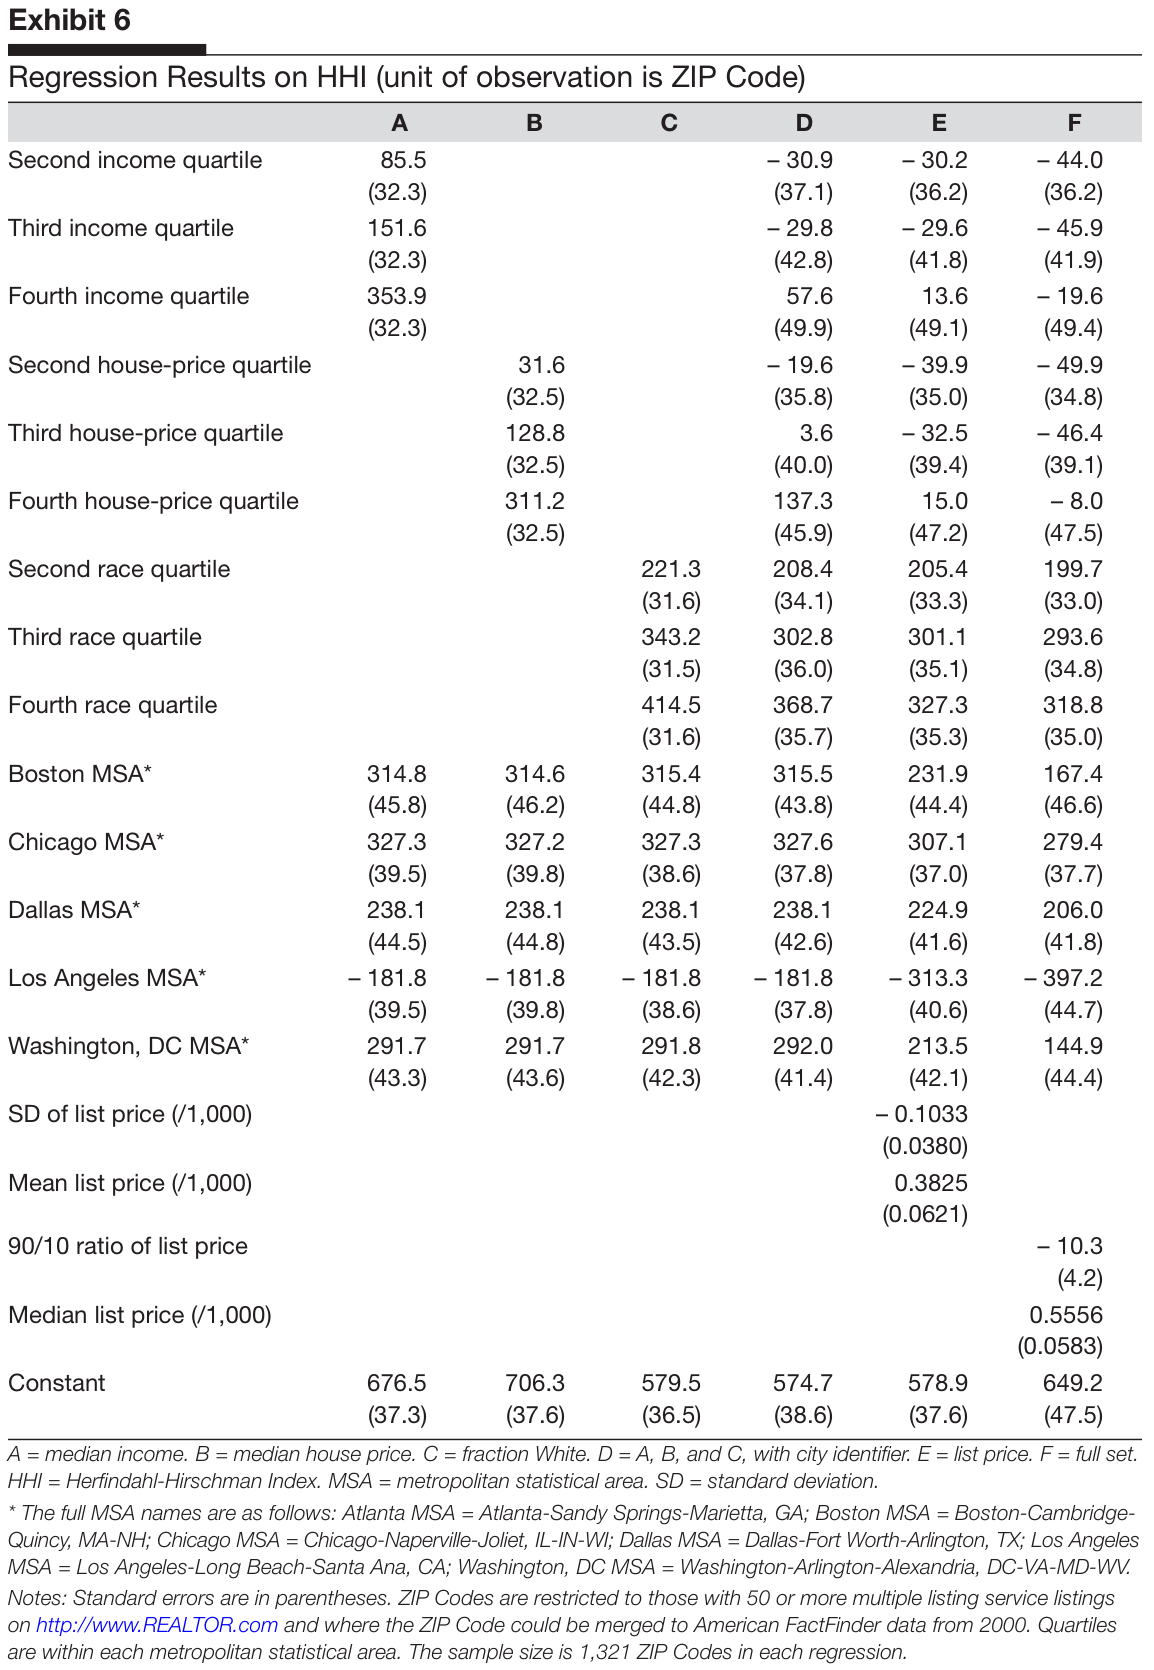
Now we examine the relationship between market concentration as measured by the HHI for real estate brokers and median income, median house price, and fraction White more rigorously. We regress HHI in each ZIP Code neighborhood on quartile categorical variables and a city identifier. Atlanta is the excluded MSA. These results are contained in columns A, B, and C of exhibit 6. As can be seen, market concentration increases with median income, median house price, and fraction White, and significant differences exist in concentration across MSAs.
MFI = Median Family Income. MSA = metropolitan statistical area. * The full MSA names are as follows: Atlanta MSA = Atlanta-Sandy Springs-Marietta, GA; Boston MSA = Boston-Cambridge-Quincy, MA-NH; Chicago MSA = Chicago-Naperville-Joliet, IL-IN-WI; Dallas MSA = Dallas-Fort Worth-Arlington, TX; Los Angeles MSA = Los Angeles-Long Beach-Santa Ana, CA; Washington, DC MSA = Washington-Arlington-Alexandria, DC-VA-MD-WV. Notes: ZIP Codes are restricted to those with 50 or more multiple listing service listings on http://www.REALTOR.com and where the ZIP Code could be merged to American FactFinder data from 2000. Quartiles are within MSA.
Median income, median house price, and fraction White are obviously correlated, so we next regress ZIP Code-level HHI on all three variables along with a city identifier. These results are contained in column D of exhibit 6. House price and fraction White have significant effects on the degree of market concentration in local real estate brokerage markets. ZIP Codes in the fourth quartile of house prices are significantly more concentrated than ZIP Codes in the lower three quartiles. ZIP Codes in the first quartile of fraction White are significantly less concentrated than ZIP Codes in the higher three quartiles. Residents of neighborhoods with relatively lower house prices and with relatively more minorities face markets for real estate brokerage services that are less, not more, concentrated. These neighborhoods are served by more firms, each of which has a smaller market share.
To further enrich our analysis of the market structure of real estate brokerage, we consider the effect of local market heterogeneity on the size distribution of firms. If the housing stock in a neighborhood is relatively homogeneous, then brokerage firms may be able to take advantage of scale economies, leading to fewer and larger firms. If the housing stock in a neighborhood is heterogeneous, then brokerage firms may specialize and occupy one of the many niches in market space, leading to more and smaller firms. HHI is thus expected to be smaller the more heterogeneous the housing stock in a neighborhood.
To measure heterogeneity in the housing stock in a ZIP Code neighborhood we calculate the standard deviation of list prices of houses advertised for sale on REALTOR.com. Greater variation in list prices suggests greater variation in square footage, lot sizes, quality of construction, and various other characteristics and amenities
Exhibit 6. Regression Results on HHI (unit of observation is ZIP Code)
A = median income. B = median house price. C = fraction White. D = A, B, and C, with city identifier. E = list price. F = full set. HHI = Herfindahl-Hirschman Index. MSA = metropolitan statistical area. SD = standard deviation.
Notes: Standard errors are in parentheses. ZIP Codes are restricted to those with 50 or more multiple listing service listings on http://www.REALTOR.com and where the ZIP Code could be merged to American FactFinder data from 2000. Quartiles are within each metropolitan statistical area. The sample size is 1,321 ZIP Codes in each regression.
associated with each house in the neighborhood. We include the standard deviation of list price in our HHI regression model, and these results are contained in column E. We also include mean list price in the regression.
Greater heterogeneity in the housing stock, as measured by the standard deviation of list prices, is associated with less concentration on the supply side of real estate brokerage markets. Neighborhoods with greater variety among houses tend to have more brokers with smaller market shares than neighborhoods where the housing stock is more homogeneous. This relationship is statistically significant and robust to different specifications of the measure of heterogeneity.24 Another interesting result of this regression is that the fraction White is still statistically significant. The estimated HHI is considerably smaller in the first quartile of fraction-White neighborhoods than in the three upper quartiles. Apparently, brokers with smaller market shares serve more neighborhoods with high-percentage minority populations than neighborhoods with relatively high-percentage
White populations, which perhaps suggests some specialization of real estate brokers by race.
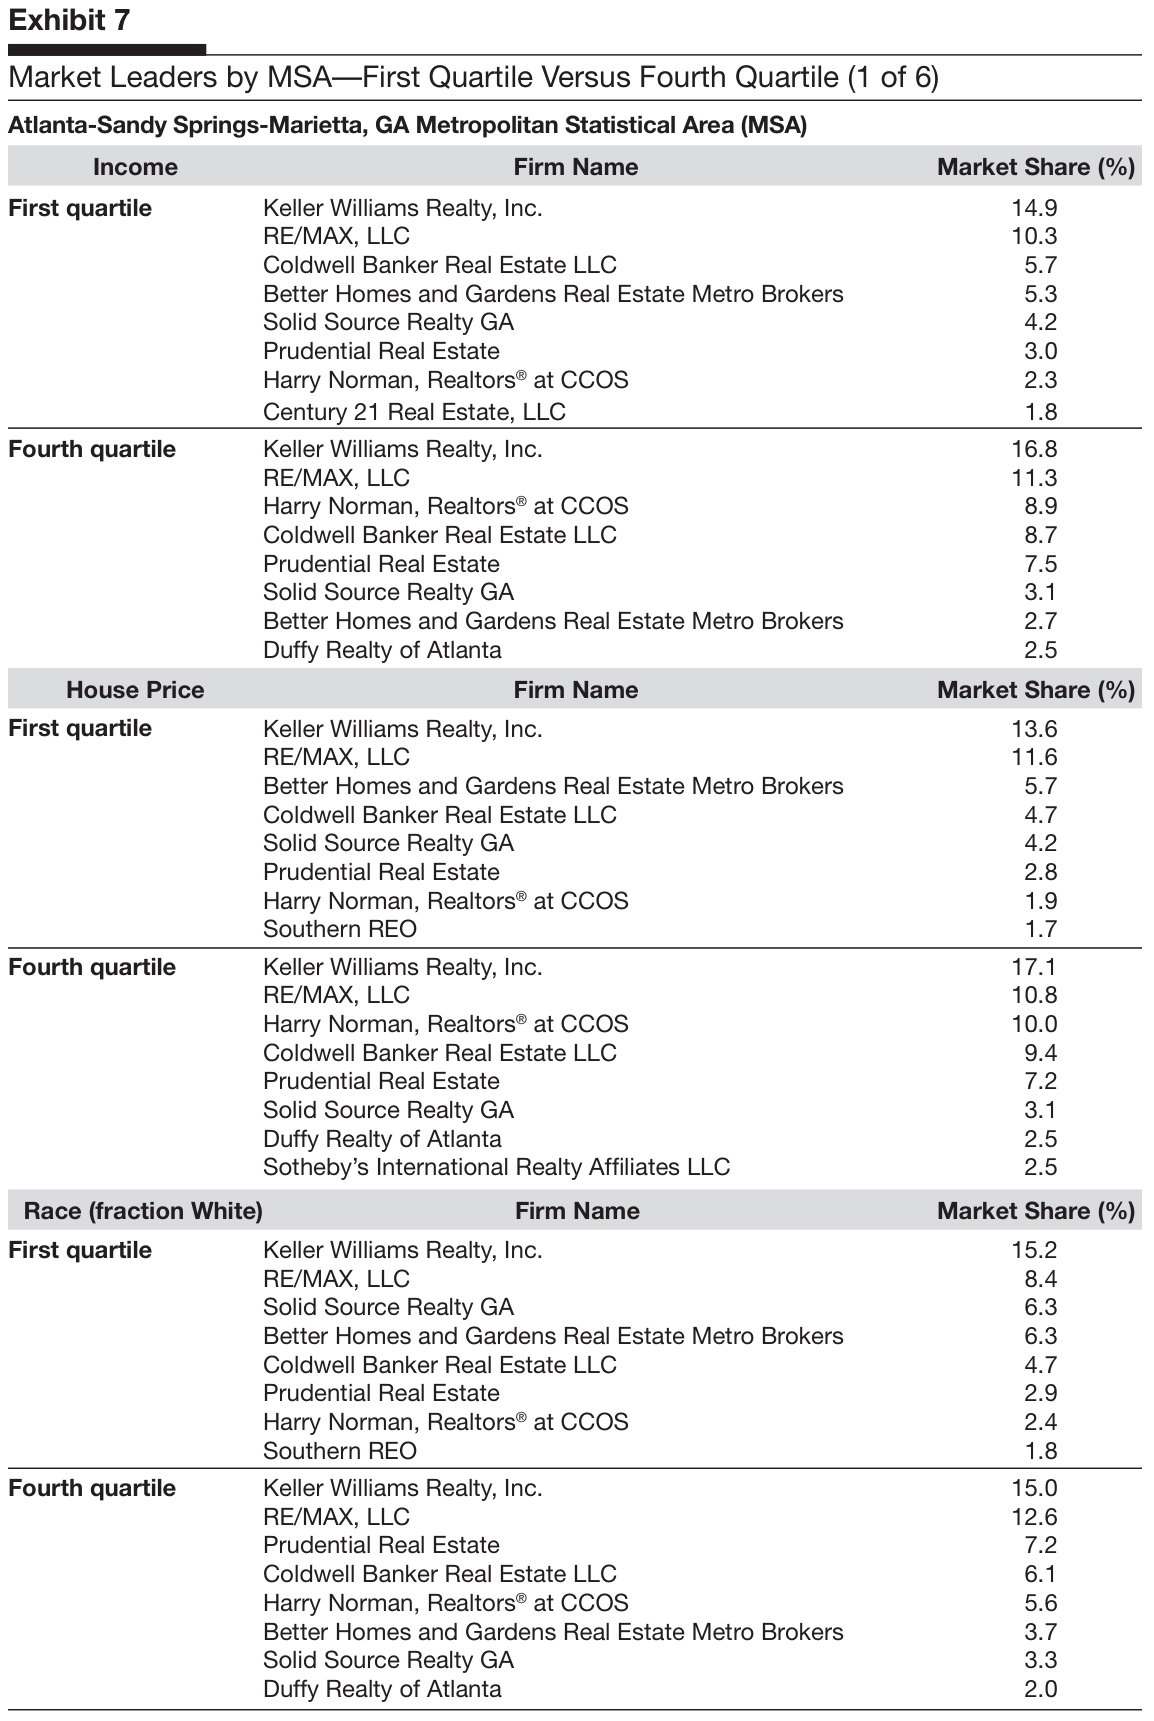
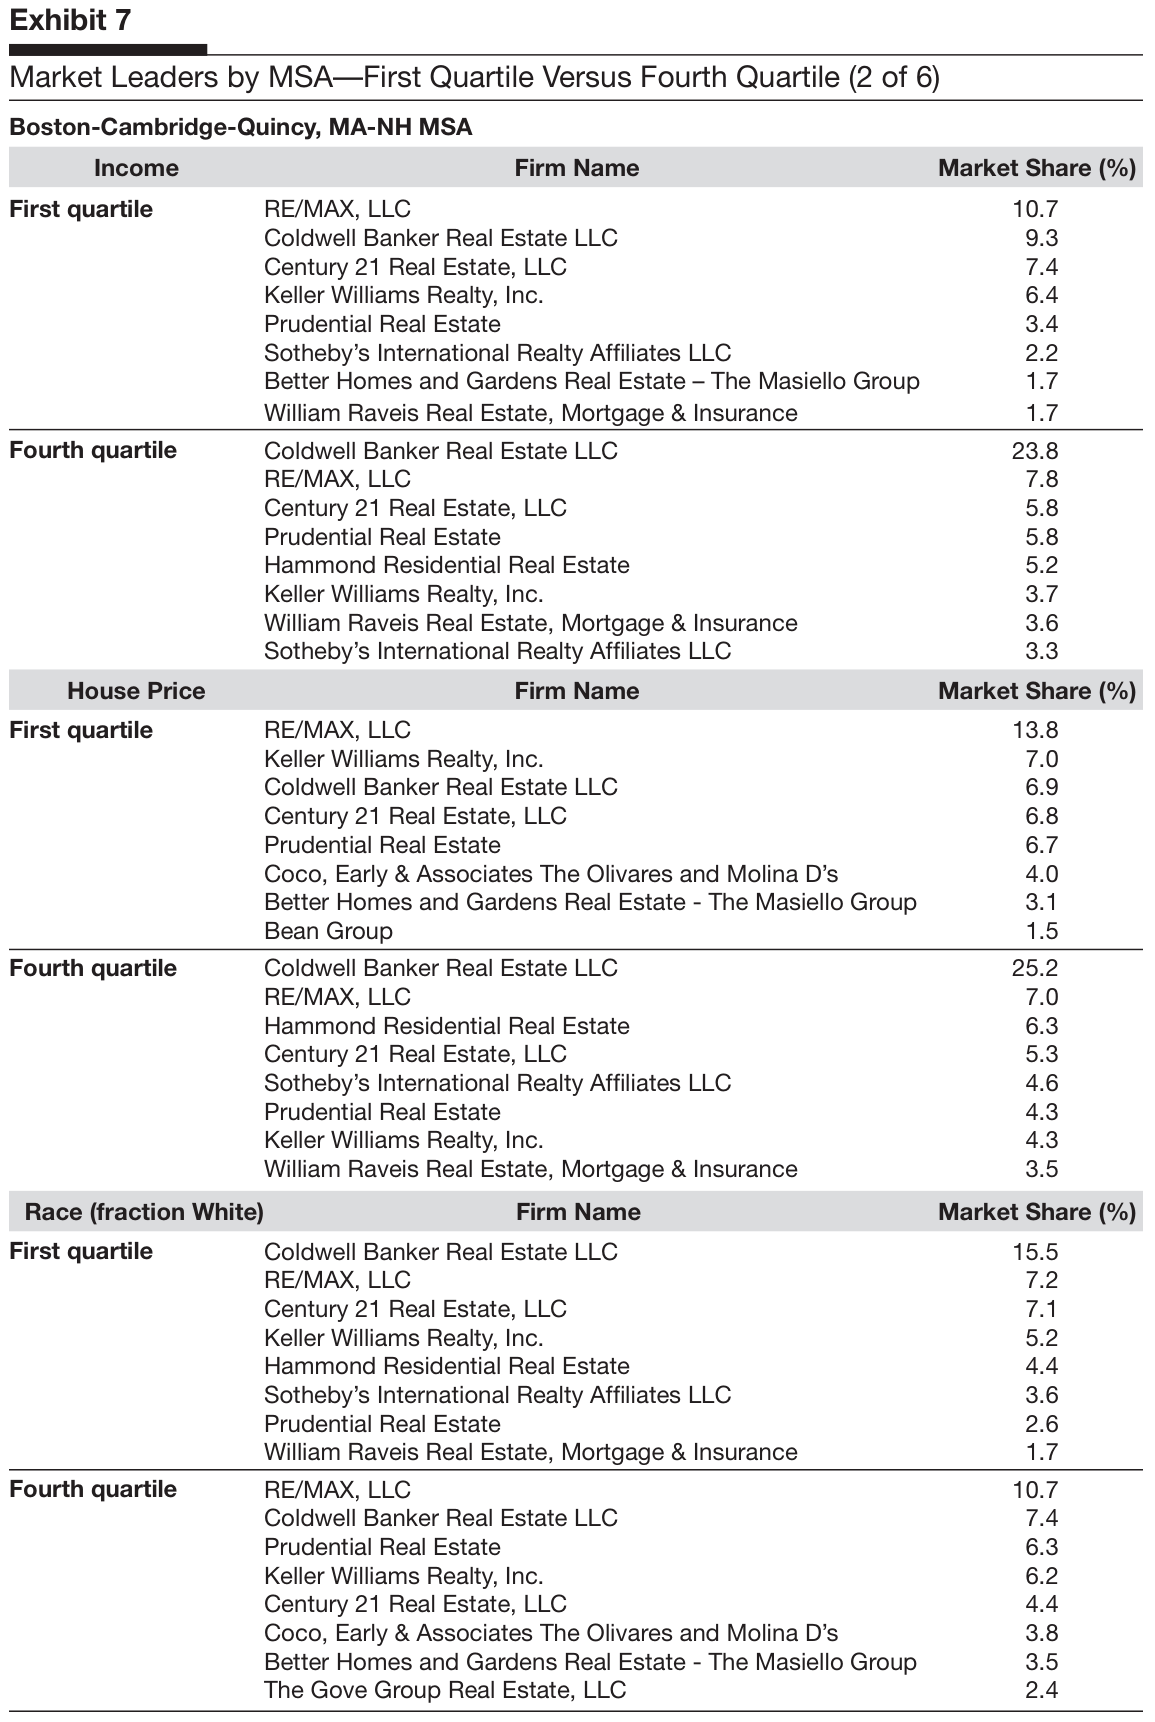
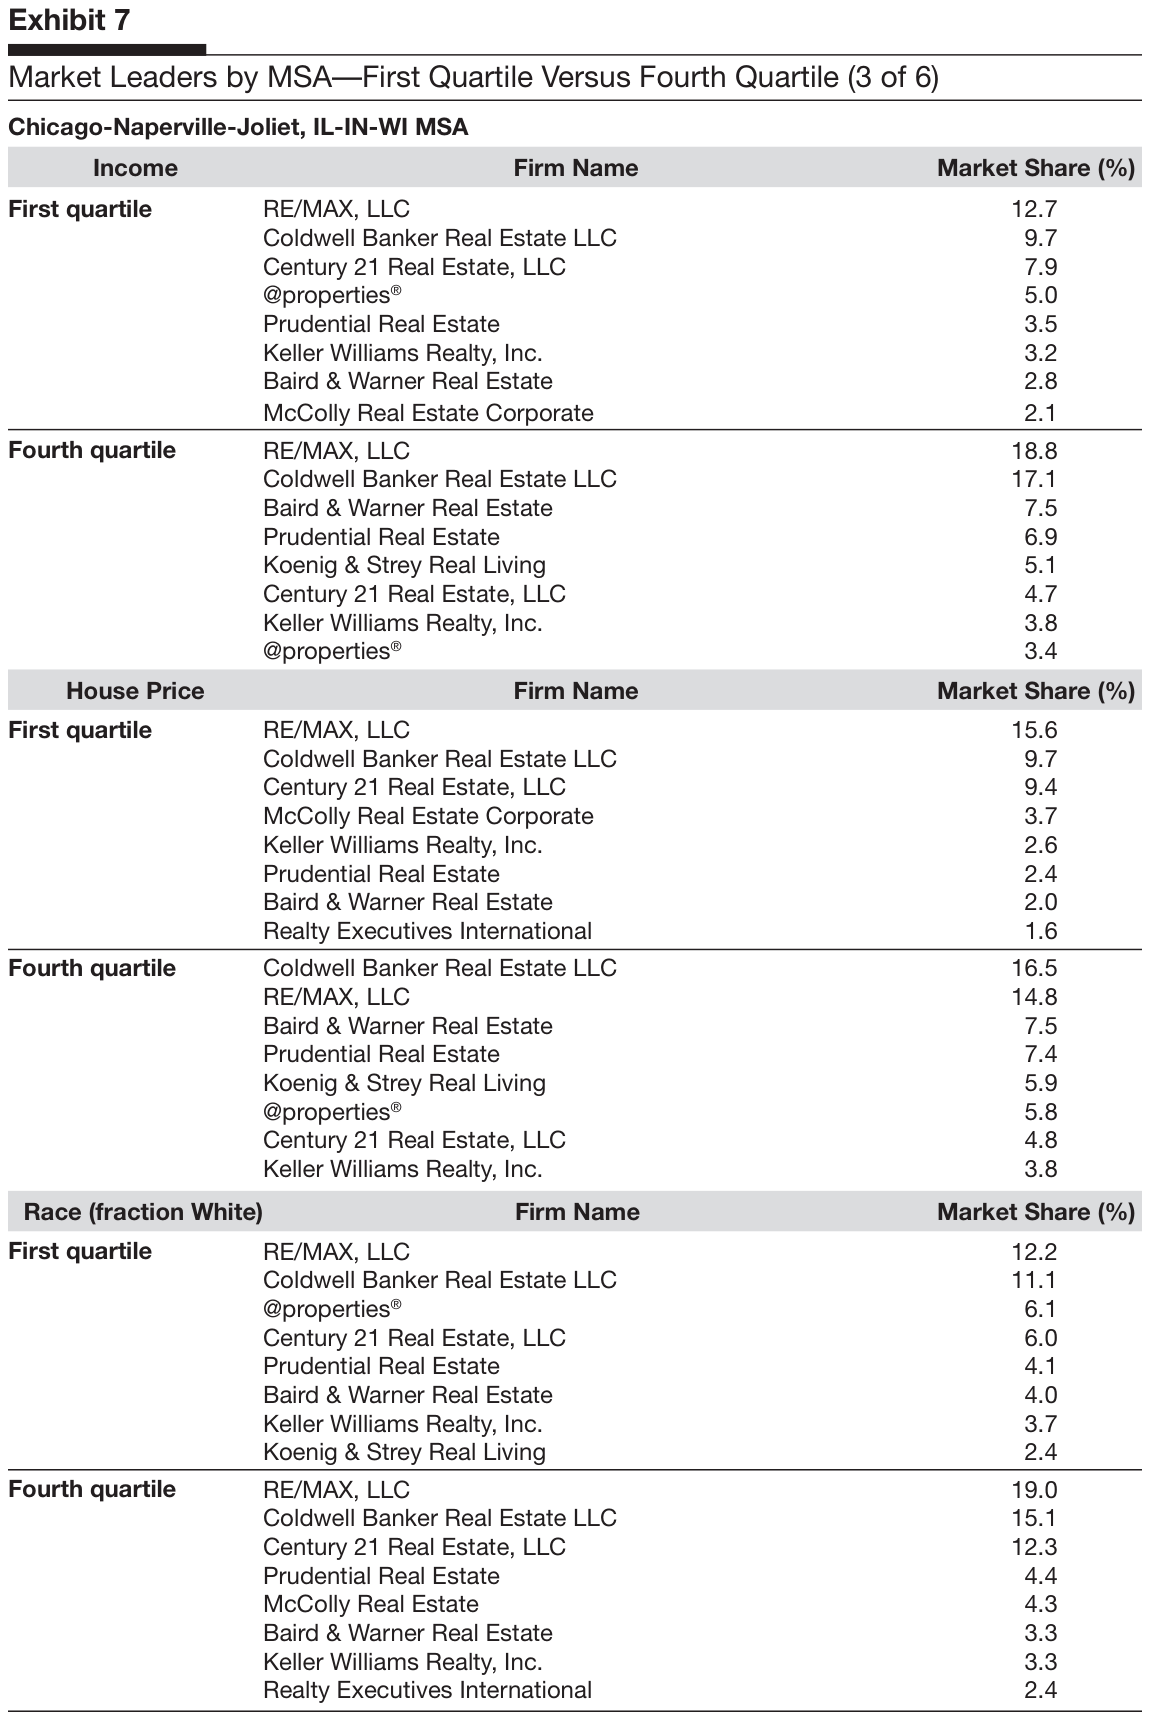
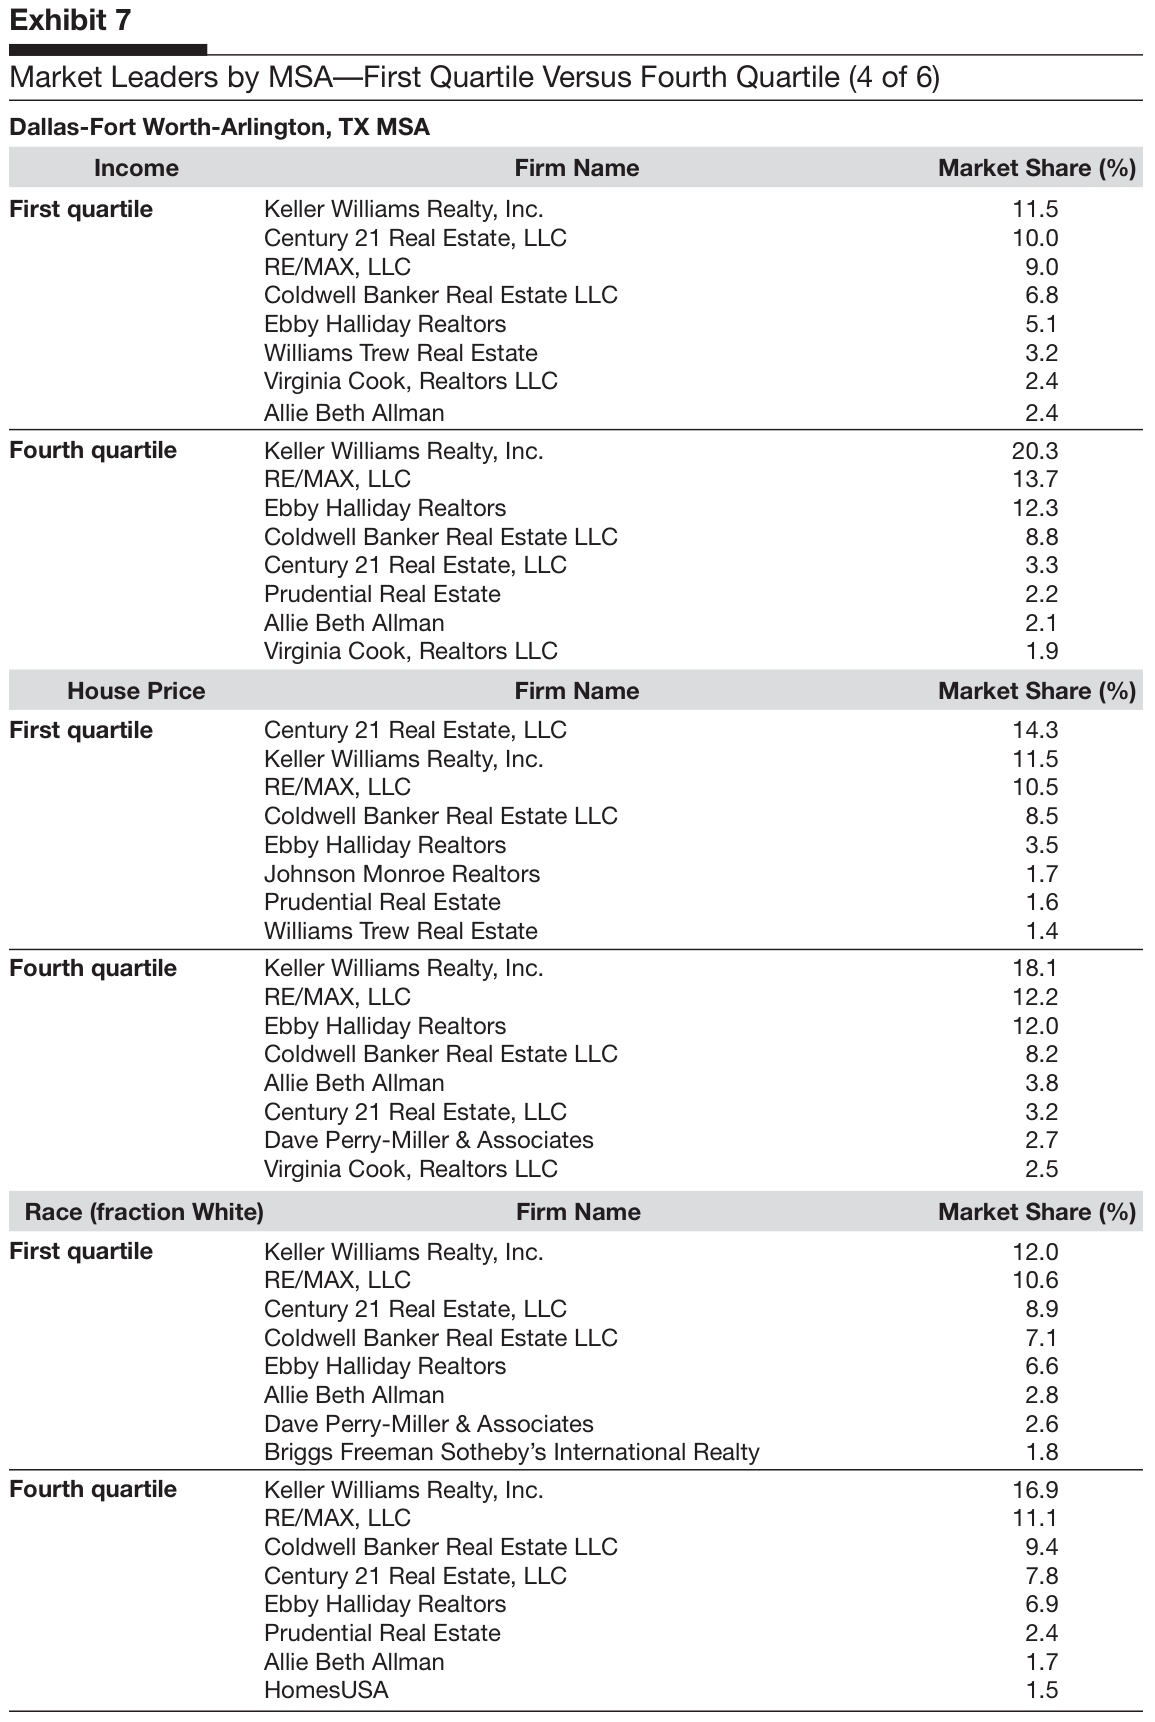
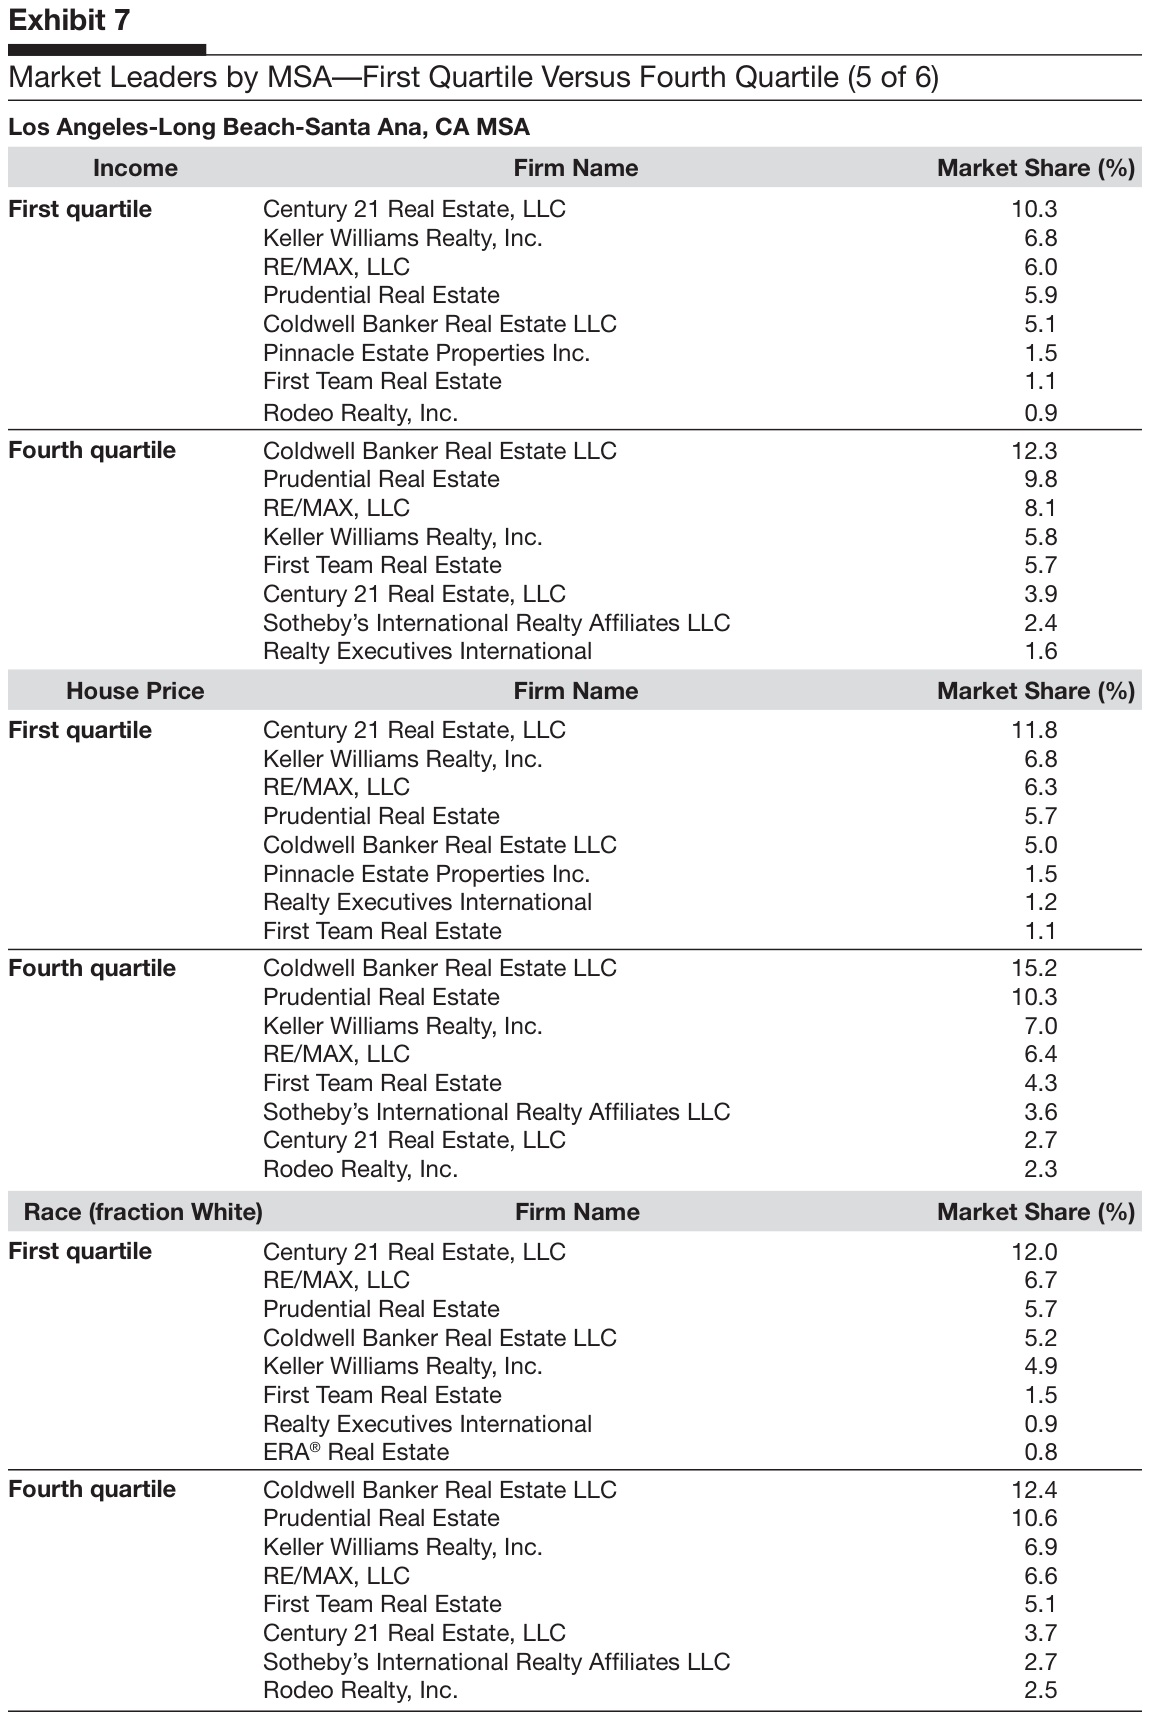
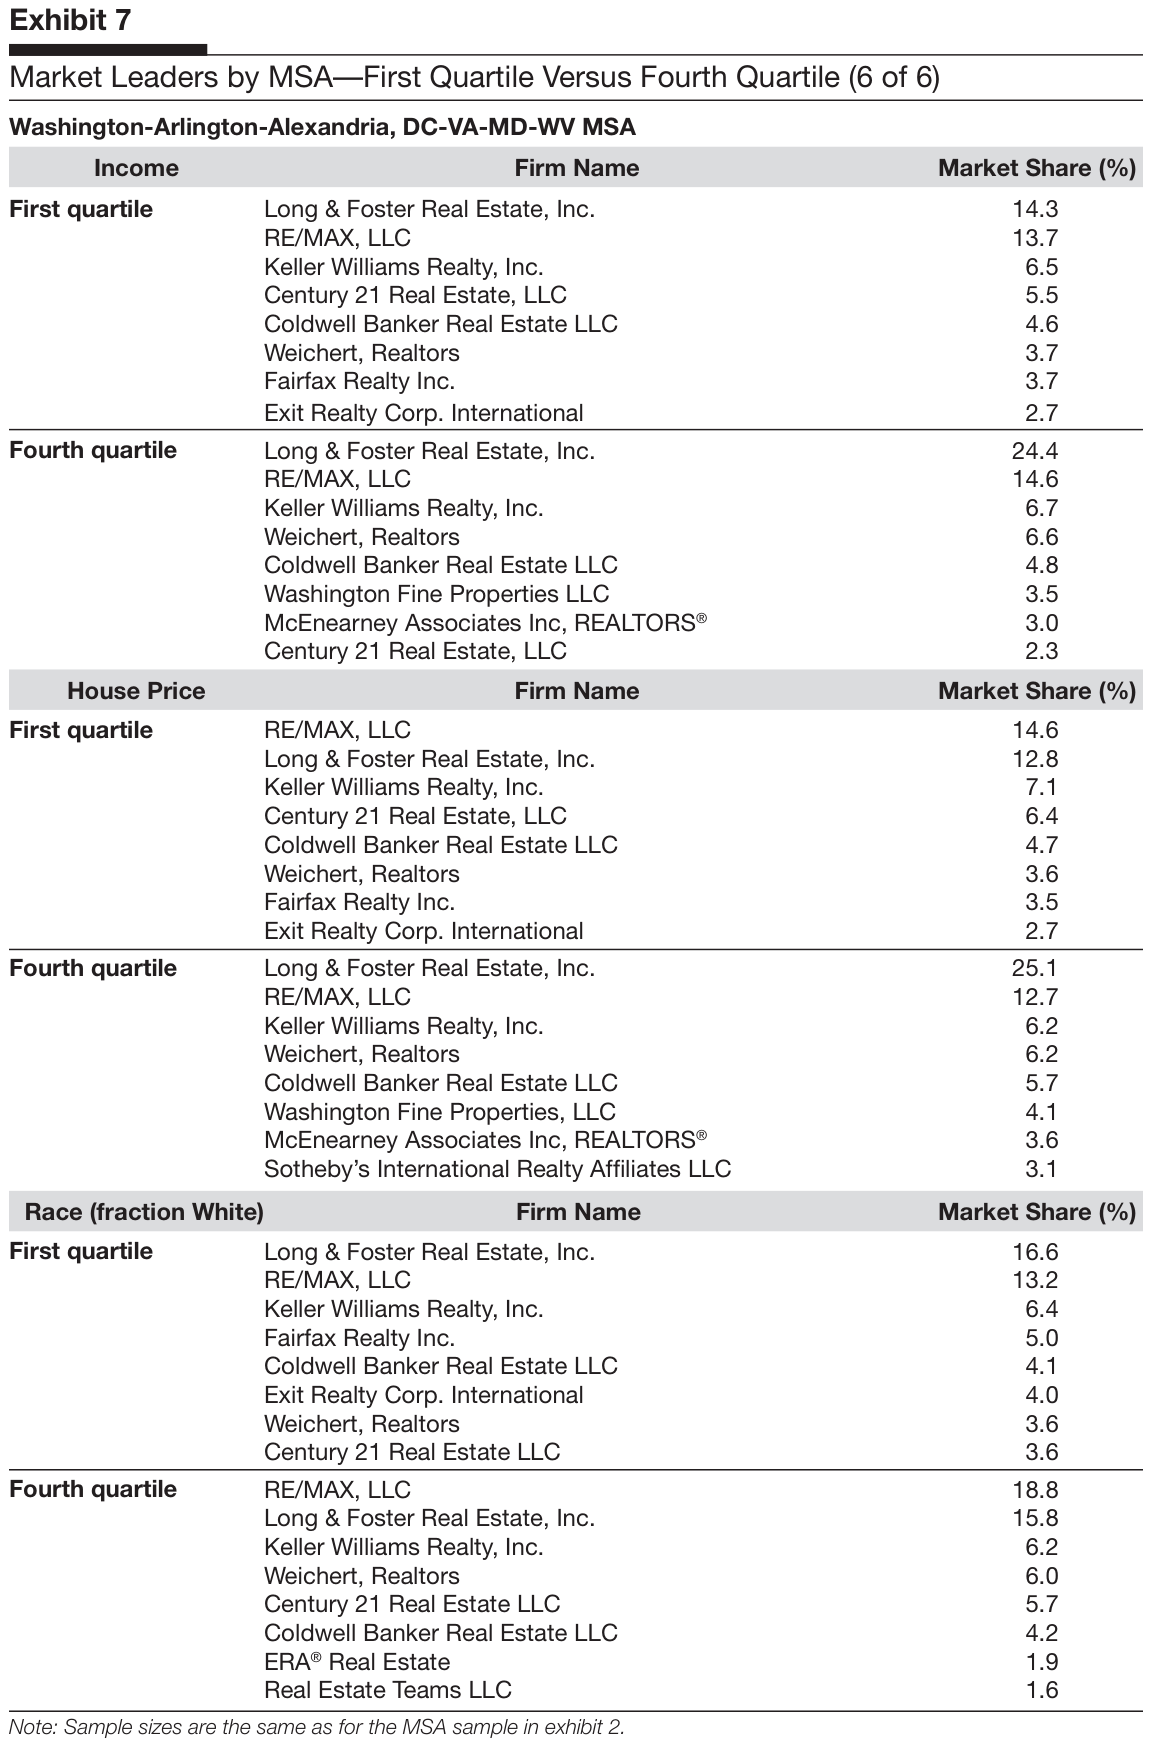
To further explore the supply of brokerage services in different neighborhoods, we identify the market leaders and their market shares in the bottom and top quartiles of income, house price, and fraction White in each of the six MSAs. These results are contained in exhibit 7, which lists the market shares of the top eight brokers in the first and fourth income, house-price, and fraction White quartiles.
Market leaders in the bottom and top quartiles of income, house price, and fraction White, in general, are the same brokers. Some differences, however, do appear. For example, in the Atlanta MSA, Harry Norman, Realtorsff was the third largest broker with a 10.0-percent market share in the top quartile of ZIP Codes ranked by house price, but was the seventh largest broker in the first house-price quartile with only a 1.9-percent market share. Better Homes and Gardens Real Estate Metro Brokers was a market leader in the first quartile of ZIP Codes ranked by house price with a market share of 5.7 percent, but they do not appear among the top eight brokers in the fourth house-price quartile.
Several of the larger brokers in the Boston MSA appear to specialize in submarkets. Coldwell Banker Real Estate LLC has a 25.2-percent market share in the fourth house-price quartile, but only a 6.9-percent market share in the first house-price quartile. When ZIP Codes are ranked by fraction White, Coldwell Banker has a 15.5-percent market share in the bottom quartile and a 7.4-percent market share in the top quartile. Whereas Coldwell Banker seems to specialize in high-income, high house-price, racially mixed neighborhoods in the Boston MSA, RE/MAX International seems to take the opposite approach. RE/MAX is the market leader in the first income and house-price quartile ZIP Codes and in the fourth quartile of fraction-White ZIP Codes. Hammond Residential
Real Estate, LLC pursues a similar strategy. They are among the top eight in the fourth income and house-price and first fraction-White quartiles, but do not appear among the top eight in the first income and house-price and fourth fraction-White quartiles.25
Exhibit 7. Market Leaders by MSA—First Quartile Versus Fourth Quartile
Chicago market leader RE/MAX is relatively more specialized in high-income and high fraction-White ZIP Codes relative to low-income and low fraction-White ZIP Codes. RE/MAX has roughly the same market share, however, in ZIP Codes ranked according to house price. Second ranked Cold - well Banker also is relatively more specialized in high-income and high fraction-White ZIP Codes, but it is even more specialized in high house-price ZIP Codes relative to low house-price ZIP Codes. Several independent brokers have significant market shares in particular market niches. @propertiesff is the fourth largest broker in low-income ZIP Codes and the third largest broker in low fraction-White neighborhoods.
Baird and Warner Real Estate is the third largest broker in ZIP Codes ranked by income and by house price.
An interesting pattern emerges from closer scrutiny of individual broker market shares in the Dallas MSA. Market leader Keller Williams and Ebby Halliday Realtors both specialize (relatively) in high-income and high house-price neighborhoods. Century 21 ranks first and second in low house-price and low-income neighborhoods, but is much lower ranked in high house-price and high-income neighborhoods. When neighborhoods are ranked by fraction White, however, no specialization patterns are evident.
The Los Angeles MSA is characterized by the highest correlation between fraction White, house price, and income among the six MSAs. Century 21 has the largest market share in low-income, low house-price, and low fraction-White ZIP Codes, but it is sixth, seventh, and sixth, respectively, in high-income, high house-price, and high fraction-White ZIP Codes. Coldwell Banker exhibits the reverse of that pattern, with the leading market share in high-income, high house-price, and high fraction-White ZIP Codes. RE/MAX is the third ranked broker citywide by overall market share. Its market presence, however, is evenly spread across ZIP Codes as ranked by income, house price, and fraction White.
In the Washington, DC MSA, the two overall market leaders are Long & Foster Real Estate, Inc., (Long & Foster) and RE/MAX. Long & Foster seems to specialize in high-income and high house-price ZIP Codes, but RE/MAX shows no such tendency. Weichert, Realtors is fourth ranked overall in the D.C. market. It has roughly double the market representation in high-income, high house-price, and high fraction-White ZIP Codes as in low-income, low house-price, and low fraction-White ZIP Codes. Third ranked Keller Williams is spread evenly across the MSA when ZIP Codes are sorted by income, house price, and fraction White.
In summary, the analysis of exhibit 7 certainly suggests that firms specialize in different parts of the housing market; nonetheless, no evidence suggests that this specialization leads to differential availability of brokerage services. It may be that the services offered by brokers serving low-income, low house-price, or low fraction-White neighborhoods fall short of those offered by brokers in other neighborhoods, but such differences would arise naturally if different clients demand different types and levels of services.
Summary and Conclusions
Real estate brokers often specialize in local submarkets within larger urban markets, especially because geographically proximate neighborhoods can differ nontrivially by income levels, house prices, racial composition, and other attributes. Real estate agents and brokers are typically compensated based on the selling price of the home. The nature of agents’ and brokers’ costs is such that the profitability of any real estate transaction is likely to increase with the selling price of the house.
The question naturally arises whether low-income neighborhoods or neighborhoods where house prices are low are as well served by real estate professionals as higher income or higher price neighborhoods. If not, the discrepancy might partially explain the income gap in homeownership. A related question is whether neighborhoods with high minority populations are served differentially by brokers, which might partially explain the racial gap in homeownership. Poor service by real estate professionals might also affect property appreciation in minority neighborhoods, which in turn could have important implications for the wealth gap by race.26
To answer these questions we gathered data for six large metropolitan areas: the Atlanta, Boston, Chicago, Dallas, Los Angeles, and Washington, DC MSAs. We collected information on income, house values, racial composition, and homeownership at the ZIP Code level from the 2000 census. We combined these data with information that we collected from REALTOR.com in 2011 on real estate listings by broker for each ZIP Code neighborhood, which we used to calculate HHIs and market shares for individual real estate brokers.
To understand the relationship between market concentration and income, house price, and fraction White, we regress HHI on median income, median house price, and fraction White in each ZIP Code neighborhood. We also include in the regression analysis a measure of the heterogeneity in the housing stock in each ZIP Code, the standard deviation in list prices, and mean list price. We find that neighborhoods with greater variety among houses tend to have more brokers with smaller market shares than neighborhoods where the housing stock is more homogeneous. Estimated HHI is considerably smaller in the first quartile of fraction-White neighborhoods than in the upper three quartiles. More brokers with smaller market shares apparently serve more neighborhoods with high minority populations than neighborhoods with relatively higher White populations. Market concentration also increases with average list price, indicating that high house-price neighborhoods tend to be served by fewer but larger real estate brokers.
Finally, we analyzed market shares of individual brokers in each MSA in the first and fourth quartiles of ZIP Code neighborhoods ranked by median income, median house price, and fraction White. The general pattern is that market leaders in one segment tend to be market leaders in other segments, but numerous examples of brokers specializing in particular market segments exist.
Note that our investigation of access to real estate brokerage across neighborhoods only scratches the surface of what is surely a more complicated picture. D’Rozario and Williams (2005) noted that retail redlining can fall into eight categories, only one of which is refusing service to all customers in certain areas. We cannot observe the quality of brokerage services, and it is possible that smaller firms serving the minority, low-price, and low-income neighborhoods provide lower quality service than some of the market leaders who do not have a presence in these neighborhoods. We also do not analyze the commission rate structure across neighborhoods. Getting full commission rates (that is, of both the listing and selling agent) is very difficult because, as Zumpano and Hooks (1988) pointed out, in 1980 the NAR adopted policies to prohibit publishing the total commission on MLS listings. Although Hsieh and Moretti (2003) presented full commission rates for several cities, the commissions were drawn from the late 1970s, before the NAR policy was in effect. With the notable exception of Woodward (2008), no recent study has presented the distribution of full commission rates. Given the difficulties in measuring quality and commission rates, our data scraping method, which enables us to learn about access to real estate brokerage, is an appropriate first step. Future studies that measure either of these two dimensions will enhance the understanding of redlining in real estate brokerage.
Appendix. Do the NAR Data Provide a Complete Picture of the Housing Market?
One important concern is the extent to which scraping data from http://www.REALTOR.com provides a full characterization of local housing market conditions. The two key concerns are that for-sale-by-owner (FSBO) listings could serve as an important and cheaper alternative to listing with a broker and that some brokers may put their listings on a local multiple listing service (MLS) but not on the National Association of REALTORS® (NAR) website.
We are aware of three recent studies that have analyzed FSBO activity. First, the NAR (2011) found that FSBO activity ranged from 9 to 14 percent during the past decade, with a dramatic reduction in FSBO activity during the latter one-half of the decade. For example, they report that FSBO activity in 2011—the period when our sample was collected—was 10 percent. Their study also shows that in 37 percent of these FSBO transactions, the seller knew the buyer (NAR, 2011, exhibit 6-26). Second, Woodward (2008) analyzed HUD-1 statements from 2001 and found a higher percentage of homes sold by FSBO than did the NAR study, even for the same period. 18.5 percent of the home transactions in her sample had no line items related to brokerage commissions, and it is unlikely that these brokerage fees would have been hidden in another line item.27 She noted that this percentage compares with a rate of 13 percent for 2001 from the NAR, and she attributed the difference to the composition of the sample. She used Federal Housing Administration (FHA) data that focus on less valuable homes, which are more likely to be sold by their owners without assistance from a real estate agent. The data used in her analysis drew approximately equal numbers of loans from each state, and the 18.5 percent figure is not weighted for differences in the underlying availability of homes in each state. Thus, it is difficult to compare her figure with the NAR’s. Finally, Hendel, Nevo, and Ortalo-Magné (2009) examined
FSBO activity in Madison, Wisconsin. They found that the share of listings that are FSBO is roughly 21 percent.
Overall, none of these studies sheds much light on our sample. First, the overall FSBO percentages from the NAR are much higher in the beginning of the decade, when the housing market was healthier. They are also national numbers and include both FSBO sales that are between related parties and those between unrelated parties. Because virtually all MLS transactions will be between unrelated parties, the NAR statistics will overstate the importance of FSBO activity on arm’s-length transactions. Second, the fact that Woodward’s (2008) analysis also focused on the early part of the decade and on a narrow segment of transactions (FHA loans, rather than conventional or jumbo loans) also calls into question the ability to extrapolate the findings to our sample.
Finally, in a longer working paper that preceded the publication of Hendel, Nevo, and Ortalo-Magné (2009), the authors clearly acknowledged that their data come from a single city, and they do not know how representative their results are of other markets.28 They noted that Madison is unique in many respects (being a college town and a state capital), and that it is a midsized city, which is clearly different from the six large cities in our study.
To further analyze the importance of FSBOs, we have investigated the FSBO market extensively to see what percentage of residential real estate transactions do not involve a real estate professional and thus fall outside the coverage of our REALTOR.com data. We discuss the steps extensively in the following section, and conclude that, at most, FSBO transactions account for slightly more than 10 percent of housing transactions.
First, note that NAR (2011) found that only 10 percent of transactions were FSBO in 2011, but in many of those transactions, the seller knew the buyer before the purchase. Even so, national statistics could mask substantial variation across cities or across neighborhoods. Conceptually, it is much more difficult to collect FSBO data than NAR data. FSBO sales are far more likely to be between parties that know each other and, therefore, are less likely to show up in the public domain until the transaction is complete. Even for FSBOs that are arm’s-length transactions, the intensity of marketing varies. NAR (2011, exhibits 7-8 and 8-11) reported that 38 percent of FSBOs did not actively market their home at all, and only 33 percent of FSBOs put the listing on the internet (versus 92 percent of agent listings). Thus, many FSBO listings may not represent serious selling efforts.
Unlike REALTOR.com, a sole aggregator of FSBO listings does not exist (although some—like http://www.FSBOMadison.com—do an excellent job for a local market). Because it is impossible to account for the number of FSBO yard signs in a given market or neighborhood, our analysis requires that a FSBO seller has taken the larger step of listing the home on line. We rely on two well-known websites—http://www.Zillow.com and http://www.ForSaleByOwner.com. According to Zillow’s website, their real estate network (partnering with Yahoo! Inc.) is the largest, with more than 25 million unique visitors each month. ForSaleByOwner.com advertises aggressively on http://Google.com and currently ranks first in organic search for the term
“FSBO.”29 At the time we accessed the Zillow data, the cost for a person to put a home on the FSBO listing was $1, and it is currently free. Assuming a FSBO owner was aware of Zillow’s price, it seems likely they would list their home on Zillow, in addition to any other methods they were using to market their home. The cost to list on ForSaleByOwner.com is much higher, but the site offers better targeting to buyers who are open to FSBOs. As of August 2012, the price to list on this website is $80.95 per month, a one-time fee of $184 until sold, or a higher price for upgraded packages that include videos and wider reach.30
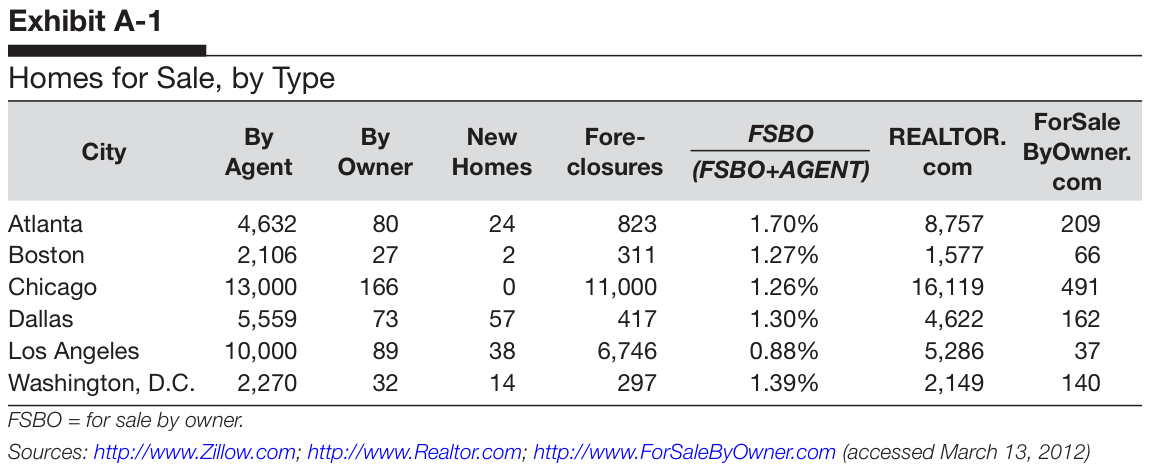
In March 2012, we compared the number of listings on REALTOR.com with each of these web - sites for the six large cities in our sample. The results are shown in Exhibit A1. The first five columns of data come from Zillow, the sixth column from REALTOR.com, and the final column from ForSaleByOwner.com. Of the three websites, Zillow in some sense provides the fullest characterization of the housing market because it provides by city or ZIP Code the number of agent listings, FSBO listings, and so forth. As the fifth column shows, the fraction of FSBO listings on Zillow is miniscule—less than 2 percent in all cities. Although the count is usually higher with the alternative website ForSaleByOwner.com, the fraction of listings that are FSBO is perhaps 5 percent for a city as a whole.
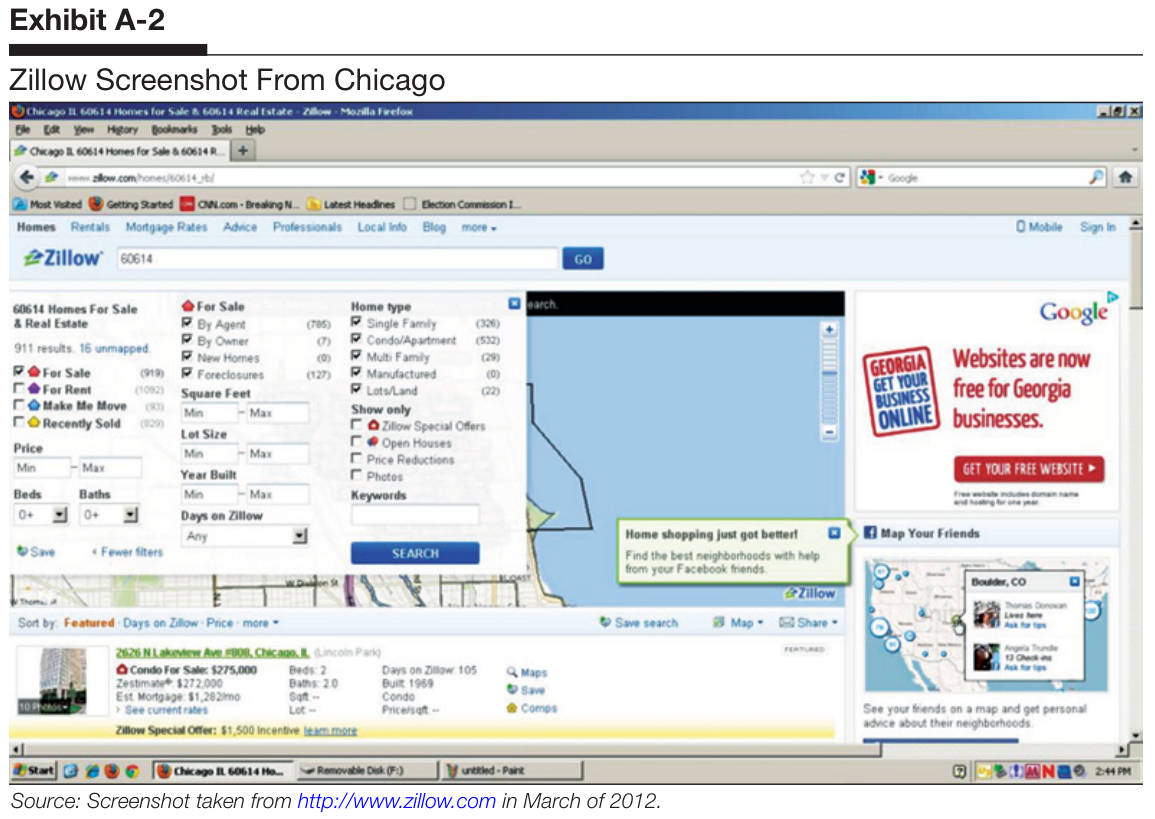
Although the absolute level of FSBO activity is low for all six cities, it could be the case that such activity varies within city, which in turn could have a meaningful effect on our Herfindahl-Hirschman Index (HHI) measures. Thus, we examined the Zillow data by ZIP Code, which directly addresses the concern that FSBO listings might vary from one neighborhood to another in a way that affects the HHI computations. We collected data for 723 ZIP Codes in the six cities; of these ZIP Codes, 203 had at least 50 observations on agent listings and/or FSBO listings. One such illustration is provided in exhibit A-2, which is a screenshot from the ZIP Code 60614 in Chicago, which had 785 for-sale-by-agent listings and 7 FSBO listings. For each of these 203 ZIP Codes, we computed the percentage of listings that were FSBO listings (that is, ). On average, the fraction of listings that were FSBO was 1.25 percent, and 99 percent of the ZIP Codes had fewer than 4.3 percent of listings as FSBO. As a consequence, it appears that FSBOs play a fairly minor role in the housing market, and the incidence of FSBO listings does not vary tremendously across neighborhoods (at least in the large cities and time period we examine).
Source: Screenshot taken from http://www.zillow.com in March of 2012. Finally, it is also a challenging task to compare REALTOR.com data with local MLS data, because many local MLSs require membership to gain access. We were able to examine, however, the count of listings for some large ZIP Codes in the Dallas MSA on REALTOR.com and the MLS site http://www.TexasRealEstate.com. We found a tight correspondence between the listings on the two sites for nine large ZIP Codes (correlation = 0.88).
In summary, this analysis suggests that our approach of using data from REALTOR.com is the best and most comprehensive approach to measuring market activity, and captures the overwhelming share of all listing activity in the market. Both the use of FSBOs and ignoring the NAR site are relatively small issues, and don’t appear to vary dramatically by neighborhood.
Acknowledgments
The authors thank Mark Shroder, managing editor of Cityscape ; Susan Woodward; and three anonymous reviewers for helpful comments. The data and programs used in this study are available from Aaron Yelowitz.
Authors
Aaron Yelowitz is an associate professor in the Department of Economics at the University of Kentucky. Frank Scott is a professor in the Department of Economics at the University of Kentucky.
Jason Beck is an assistant professor in the Department of Economics at Armstrong Atlantic State University.
References
Alwitt, Linda F., and Thomas D. Donley. 1997. “Retail Stores in Poor Urban Neighborhoods,” The Journal of Consumer Affairs 31 (1): 139–164.
Bayer, Patrick, Marcus D. Casey, Fernando Ferreira, and Robert McMillan. 2012. Price Discrimination in the Housing Market. NBER Working Paper No. 18069. Cambridge, MA: National Bureau of Economic Research.
Beck, Jason, Frank Scott, and Aaron Yelowitz. 2012. “Concentration and Market Structure in Local Real Estate Markets,” Real Estate Economics 40 (3): 422–460.
Berkovec, James A., Glenn B. Canner, Stuart A. Gabriel, and Timothy H. Hannan. 1994. “Race, Redlining, and Residential Mortgage Loan Performance,” Journal of Real Estate Finance and Economics 9 (3): 263–294.
Bunce, Harold L., and William J. Reeder. 2007. “Guest Editor’s Introduction,” Cityscape 9 (2): 1–3.
Cohen-Cole, Ethan. 2011. “Credit Card Redlining,” Review of Economics and Statistics 93 (2): 700–713.
D’Rozario, Denver, and Jerome D. Williams. 2005. “Retail Redlining: Definition, Theory, Typology and Measurement,” Journal of Macromarketing 25 (2): 175–186.
Federal Trade Commission (FTC) and U.S. Department of Justice (DOJ). 2007. “Competition in the Real Estate Brokerage Industry.” Available at http://www.ftc.gov/reports/realestate/V050015.pdf (accessed February 25, 2013).
Galster, George, and Erin Godfrey. 2005. “By Words and Deeds: Racial Steering by Real Estate Agents in the U.S. in 2000,” Journal of the American Planning Association 71 (3): 251–268.
Ghent, Andra C., Rubén Hernández-Murillo, and Michael T. Owyang. 2012. Race, Redlining, and Subprime Loan Pricing. Federal Reserve Bank of St. Louis Working Paper No. 2011-033A. St. Louis: Federal Reserve Bank of St. Louis. Available at http://ssrn.com/abstract=2038634 (accessed February 25, 2013).
Government Accountability Office (GAO). 2005. Real Estate Brokerage: Factors That May Affect Price Competition . Washington, DC: U.S. Government Accountability Office.
Haurin, Donald R., Christopher E. Herbert, and Stuart S. Rosenthal. 2007. “Homeownership Gaps Among Low-Income and Minority Households,” Cityscape 9 (2): 5–51.
Hendel, Igal, Aviv Nevo, and François Ortalo-Magné. 2009. “The Relative Performance of Real Estate Marketing Platforms: MLS Versus FSBOMadison.com,” American Economic Review 99 (5): 1878–1898.
———. 2007. The Relative Performance of Real Estate Marketing Platforms: MLS Versus FSBOMadison.com. NBER Working Paper No. 13360. Cambridge, MA: National Bureau of Economic Research.
Herbert, Christopher E., and Eric S. Belsky. 2008. “The Homeownership Experience of Low-Income and Minority Households: A Review and Synthesis of the Literature,” Cityscape 10 (2): 5–60.
Hsieh, Chang-Tai, and Enrico Moretti. 2003. “Can Free Entry Be Inefficient? Fixed Commissions and Social Waste in the Real Estate Industry,” Journal of Political Economy 111 (5): 1076–1122.
Kim, Sunwoong. 2000. “Race and Home Price Appreciation in Urban Neighborhoods: Evidence From Milwaukee, Wisconsin,” The Review of Black Political Economy 28 (2): 9–28.
Munnell, Alicia H., Geoffrey M. B. Tootell, Lynn E. Browne, and James McEneaney. 1996. “Mortgage Lending in Boston: Interpreting HMDA Data,” American Economic Review 86 (1): 25–53.
Myers, Caitlin Knowles. 2004. “Discrimination and Neighborhood Effects: Understanding Racial Differentials in U.S. Housing Prices,” Journal of Urban Economics 56 (2): 279–301.
Myers, Caitlin Knowles, Grace Close, Laurice Fox, John William Meyer, and Madeline Niemi. 2011. “Retail Redlining: Are Gasoline Prices Higher in Poor and Minority Neighborhoods?” Economic Inquiry 49 (3): 795–809.
NATIONAL ASSOCIATION OF REALTORS® (NAR). 2011. “2011 NAR Profile of Home Buyers and Sellers,” Washington, DC: NAR. Available at http://www.carolinarealtors.com/files/National%20HBS%202011.pdf (Accessed February 25, 2013).
Ondrich, Jan, Stephen Ross, and John Yinger. 2003. “Now You See It, Now You Don’t: Why Do Real Estate Agents Withhold Available Houses From Black Customers?” The Review of Economics and Statistics 85 (4): 854–873.
Ondrich, Jan, Alex Stricker, and John Yinger. 1998. “Do Real Estate Brokers Choose To Discriminate? Evidence From the 1989 Housing Discrimination Study,” Southern Economic Journal 64 (4): 880–901.
Ong, Paul M., and Michael A. Stoll. 2007. “Redlining or Risk? A Spatial Analysis of Auto Insurance Rates in Los Angeles,” Journal of Policy Analysis and Management 26 (4): 811–829.
Regan, Laureen. 2007. “Unfair Discrimination and Homeowners Insurance Availability: An Empirical Analysis,” Risk Management and Insurance Review 10 (1): 13–31.
Tootell, Geoffrey M. B. 1996. “Redlining in Boston: Do Mortgage Lenders Discriminate Against Neighborhoods?” Quarterly Journal of Economics 111 (4): 1049–1079.
White, Lawrence J. 2006. “The Residential Real Estate Brokerage Industry: What Would More Vigorous Competition Look Like?” New York University Law & Economics Research Paper Series, #06-16. New York: New York University.
Woodward, Susan E. 2012 (August 29). Personal communication (e-mail). Author of A Study of Closing Costs for FHA Mortgages .
———. 2008. A Study of Closing Costs for FHA Mortgages . Report prepared for the U.S. Department of Housing and Urban Development, Office of Policy Development and Research. Washington, DC: Government Printing Office.
Yinger, John. 1991. “Acts of Discrimination: Evidence From the 1989 Housing Discrimination Study,” Journal of Housing Economics 1 (4): 318–346.
Zhao, Bo, Jan Ondrich, and John Yinger. 2006. “Why Do Real Estate Brokers Continue To Discriminate? Evidence From the 2000 Housing Discrimination Study,” Journal of Urban Economics 59 (3): 394–419.
Zumpano, Leonard V., and Donald L. Hooks. 1988. “The Real Estate Brokerage Market: A Critical Reevaluation,” The Journal of the American Real Estate and Urban Economics Association 16 (1): 1–17.
4. Ong and Stoll (2007) found that variations in auto insurance costs occur because of both risk and redlining factors, and that African-American and low-income neighborhoods are adversely affected. Regan (2007) focused on insurance availability and found a positive correlation between the proportion of minority homeowners in a state and the share of more restrictive dwelling fire policies.
5. See Myers et al. (2011) for an extensive discussion of retail redlining.
6. In the context of the Fair Housing Act, redlining is “the practice of denying a creditworthy applicant a loan for housing in a certain neighborhood even though the applicant may otherwise be eligible for the loan.” Redlining based on racial composition is illegal, whereas redlining based on economic factors is legal. See http://www.federalreserve.gov/boarddocs/supmanual/cch/fair_lend_fhact.pdf.
7. Myers (2004) studied racial housing price differentials and controls for neighborhood effects. She suggested that one possible source of racial housing price differentials is supplier price discrimination by real estate brokers and agents.
8. HHI is calculated by summing the squared market shares (expressed as a percentage) of all firms on the supply side of a market. A monopoly market thus has an HHI of 10,000, and a market of atomistic firms has an HHI that approaches zero.
10. In one part of the study by Ondrich, Ross, and Yinger (2003), the authors used paired-audit study data (the housing discrimination study) to examine whether real estate agents representing homebuyers practice redlining , defined as withholding from all customers houses in integrated neighborhoods. They found evidence to support this hypothesis in suburbs but not in central cities. Galster and Godfrey (2005) also used these data to provide evidence of racial steering of homebuyers. Zhao, Ondrich, and Yinger (2006) found that the scope of discrimination and the probability that it will be encountered by a buyer diminished sharply between 1989 and 2000. Note that performing a paired audit study—which inherently involves deception on the part of the auditors—is far easier and more feasible with homebuyers than with home sellers.
11. See the discussion in White (2006).
12. Hsieh and Moretti (2003) analyzed the market for real estate in different cities and found that the supply of real estate agents is highly responsive to the average price of housing, which they attribute in no small part to the fixed commission-rate structure. Although this conventional wisdom about commission rates may be correct, very little direct evidence exists on full commission rates. One notable exception is Woodward (2008).
13. One limitation of our study is that we are unable to determine whether the market segmentation we observe is the result of deliberate choices by individual large brokerages not to serve certain neighborhoods, which is the essence of redlining. Rather, we are able to examine availability of brokerage services at the market level.
14. Motivated by that and other studies that analyzed one or a handful of markets, we collected data in 2007 and 2009 on the number of brokers and market shares for 90 small, medium, and large real estate markets around the country and computed HHIs. In medium- and large-sized markets we found no evidence of market concentration levels that might create problems for competition. In some of the small markets in our sample, we found HHIs in the range that would invite antitrust scrutiny under the FTC-DOJ Horizontal Merger Guidelines if two larger firms proposed to merge. We were also able to analyze the size distribution of firms in submarkets within a larger metropolitan area—Louisville, Kentucky—but were unable to look at submarkets stratified by income, house prices, or racial composition.
15. In related research we have taken steps to verify the validity of the REALTOR.com data against other sources (see Beck, Scott, and Yelowitz, 2012). We compared REALTOR.com data with MLS data used by FTC and DOJ (2007) and also found a very close connection. For example, our analysis found Des Moines, Iowa, as a highly concentrated medium-sized market in 2007, consistent with discussion in the FTC and DOJ (2007). Note that we do not observe transactions, only listings.
16. See exhibit 1 for a complete description and breakdown of the construction of our sample.
18. As is indicated in their Uniform Franchise Offering circulars, most real estate franchisors structure their franchise contracts so as to give legal autonomy to each franchisee, which would suggest that our first approach gives a better measure of the number of independent producers in a market than our second approach.
19. See http://zip4.usps.com/zip4/citytown.jsp, where the central cities are Atlanta, Boston, Chicago, Dallas, Los Angeles, and Washington, D.C.
20. See http://factfinder2.census.gov/. The ZIP Code data are derived from the census Summary Tape Files.
21. Markets are classified according to HHI into three types under the 2010 Horizontal Merger Guidelines: unconcentrated (), moderately concentrated (), and highly concentrated (). See http://www.justice.gov/atr/public/guidelines/hmg-2010.html.
22. Beck, Scott, and Yelowitz (2012, Tables 2a and 2b).
23. Beck, Scott, and Yelowitz (2012, Table 2c).
24. Column F of exhibit 6 regresses HHI on the ratio of the 90th percentile list price to the 10th percentile list price in the ZIP Code, along with median list price and the full set of other variables. As can be seen, the results are relatively unchanged from column E.
25. The Boston MSA is the only one of the six MSAs where median house price and fraction White are negatively correlated.
26. Herbert and Belsky (2008) argued that the literature on differential housing appreciation rates is thin and that it is difficult to draw general conclusions. One study—Kim (2000)—did find lower appreciation rates for minorities in Milwaukee, Wisconsin neighborhoods.
27. Woodward (2012).
28. Hendel, Nevo, and Ortalo-Magné (2007).
29. As of August 30, 2012.
30. See http://www.forsalebyowner.com/listing/new/package.
9. Cityscape recently devoted two symposia to recent research on low-income and minority homeownership (Bunce and Reeder, 2007; Reeder, 2008).
Additional printed notes
1. Alwitt and Donley (1997) used Chicago as a case study and found that lower income ZIP Codes have fewer and smaller outlets than other ZIP Codes for supermarkets, banks, and large drug stores.
2. Cohen-Cole (2011) found that, after controlling for place-specific factors, qualitatively large differences exist in the amount of credit offered to similarly qualified applicants living in African-American versus White areas.
3. Myers et al. (2011) analyzed gasoline retailing and found that prices are higher in lower income areas, partially because of low competition and inelastic demand.