Several welfare programs in the United States restrict eligibility to single-parent families. This paper asks whether eliminating this restriction for Medicaid encourages marriage. I identify Medicaid's effect through a series of health insurance reforms that were passed in the 1980s and 1990s targeting young children. These reforms were associated with an increase in the probability of marriage of 1.7 percentage points. While the expansions offered some incentives to become married, they also created other incentives to become divorced (known as the "independence effect"). After controlling for the outflows from marriage due to the independence effect, the estimated effect increases by 10 percent.
Recommended citation
Aaron S. Yelowitz. “Will Extending Medicaid to Two-Parent Families Encourage Marriage?” The Journal of Human Resources 33(4) (1998): 833–865. https://www.jstor.org/stable/146400
Aaron S. Yelowitz. “Will Extending Medicaid to Two-Parent Families Encourage Marriage?” The Journal of Human Resources 33(4) (1998): 833–865. https://www.jstor.org/stable/146400
Complete article reading edition. Tables and figures reproduce the published source; open an image for full resolution. The PDF retains the original page layout.
Abstract
Several welfare programs in the United States restrict eligibility to single-parent families. This paper asks whether eliminating this restriction for Medicaid encourages marriage. I identify Medicaid's effect through a series of health insurance reforms that were passed in the 1980s and 1990s targeting young children. These reforms were associated with an increase in the probability of marriage of 1.7 percentage points. While the expansions offered some incentives to become married, they also created other incentives to become divorced (known as the "independence effect"). After controlling for the outflows from marriage due to the independence effect, the estimated effect increases by 10 percent.
I. Introduction
Author note
Aaron S. Yelowitz is an assistant professor of economics at the University of California, Los Angeles. He thanks participants at the American Economic Association, Massachusetts Institute of Technology, National Bureau of Economic Research, the Population Association of America, RAND, and University of California, Los Angeles for helpful comments. Joshua Angrist, Janet Currie, David Cutler, Peter Diamond, Leora Friedberg, Frances Goldscheider, Jerry Hausman, Caroline Minter Hoxby, Hilary Hoynes, Wei-Yin Hu, Jacob Klerman, Lee Lillard, Steven Pischke, James Poterba, T. Paul Schultz, Anne Winkler, Duncan Thomas, and two anonymous referees provided helpful comments. Jonathan Gruber deserves special mention for his input. Gloria Chiang and Sheri Zwirlein provided excellent proofreading. The National Institute on Aging and the UCLA Academic Senate graciously provided financial support. The data used in this article can be obtained from the author between March 1999 through February 2002 at the following address: Department of Economics, University of California, Los Angeles, 405 Hilgard Avenue, Los Angeles, CA 90095-1477. [Submitted February 1996; accepted August 1997]
In the United States, the Medicaid program provides public health insurance for poor, eligible families. Although the program varies across states, in all instances Medicaid furnishes a basic set of subsidized health care services.1 This program has become an increasingly important part of the welfare package because medical care costs have grown far more rapidly than general inflation.2 Not only has the program grown rapidly, but the level of Medicaid expenditure currently trails only two other domestic spending programs—Medicare and Social Security. In fiscal year 1991, the total federal and state expenditure on Medicaid for Aid to Families with Dependent Children (AFDC) recipients, $21.9 billion, exceeded the total spending on AFDC cash benefits, $20.3 billion (U.S. House of Representatives 1993). As with some other welfare programs, eligibility for Medicaid has historically been restricted to single-parent families with children less than 18 years old.3
Many studies have examined the links between welfare eligibility rules and family structure. Even though the effects of AFDC cash benefits have been well explored, my goal is to expand the discussion by providing empirical estimates of Medicaid's effect on marriage decisions.4 Most prior studies have been unable to convincingly isolate Medicaid's effect from AFDC's effect because eligibility standards for the two programs had been highly correlated.5
I examine Medicaid's effect through a series of health insurance expansions, targeted toward children, which occurred in the 1980s and early 1990s. These expansions severed Medicaid's link to AFDC eligibility in two ways: By eliminating the requirement that a child live in a single-parent (or cohabiting) family to qualify and by increasing the income eligibility limit for Medicaid beyond the AFDC limit. I use the variation in eligibility across states and over time in the Medicaid program to identify Medicaid's effect empirically. Although the state and time dimensions are quite common to recent studies in this area, the expansions also provide a true within-state comparison group by restricting new Medicaid eligibility to younger children and not older children. The data analysis uses all three dimensions to estimate Medicaid's effect.
I reach two main conclusions from the reduced-form estimates on the 1989 to 1994 March Current Population Survey (CPS). First, the expansions significantly increased the probability of marriage. Extending Medicaid to all children in a household is associated with an increase in the probability of marriage of 1.7 percentage points. Second, the Medicaid expansions also resulted in some women becoming divorced, because the reforms raised the Medicaid income limit for children in single-parent families beyond the previous AFDC limit. By restricting the sample to women with children who live in states with high AFDC eligibility limits (and who should therefore not respond to this second effect), Medicaid's effect increases to 2.0 percentage points. In contrast to many recent studies, the economic and statistical significance of the coefficient estimates remains after including state fixed effects in the model.
Section II of this paper briefly describes the incentives that the welfare system offers for living arrangements and discusses their potential importance. It also explains in detail the recent Medicaid expansions for children. Section III presents the model and offers several predictions from the Medicaid expansions. Section IV describes construction of the data set from the CPS and the empirical implementation. Section V reports the results and Section VI presents the conclusions.
II. Institutional Background
A. Background on U.S. Welfare Programs
The U.S. welfare system offers two benefits that are largely restricted to poor, single-parent families with children: Cash assistance through AFDC and health insurance through Medicaid. Before recent changes, a recipient would qualify for both AFDC and Medicaid by having income under a state-specific threshold. In 1992, these thresholds for a family of three ranged from 27 percent of the federal poverty level (FPL) in Alabama to 113 percent in Arizona.6 A second distinguishing characteristic of the programs is that eligibility is related to family structure. Although the rules allow some flexibility for stepparent households and cohabitors to qualify, in practice, the vast majority of AFDC recipients are female-headed households with children under 18 present.7
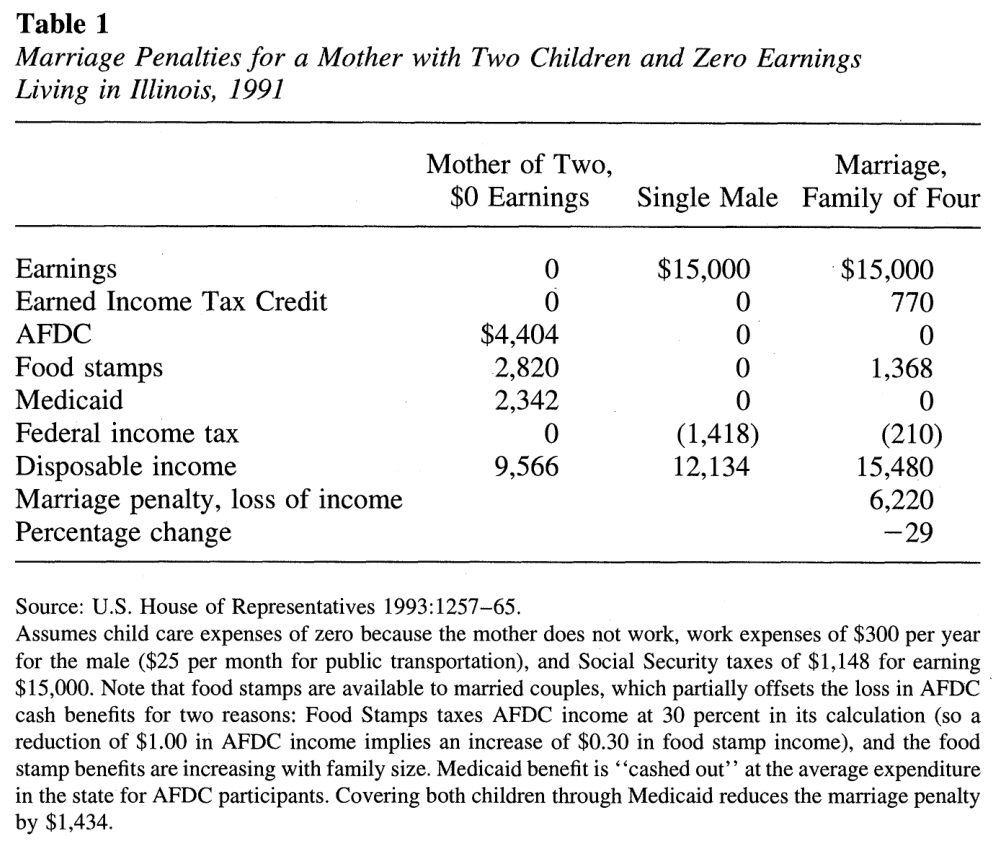
Table 1. Marriage Penalties for a Mother with Two Children and Zero Earnings Living in Illinois, 1991
Notes: Source: U.S. House of Representatives 1993:1257-65.
Assumes child care expenses of zero because the mother does not work, work expenses of $300 per year for the male ($25 per month for public transportation), and Social Security taxes of $1,148 for earning $15,000. Note that food stamps are available to married couples, which partially offsets the loss in AFDC cash benefits for two reasons: Food Stamps taxes AFDC income at 30 percent in its calculation (so a reduction of $1.00 in AFDC income implies an increase of $0.30 in food stamp income), and the food stamp benefits are increasing with family size. Medicaid benefit is ''cashed out'' at the average expenditure in the state for AFDC participants. Covering both children through Medicaid reduces the marriage penalty by $1,434.
To illustrate the potential importance of losing AFDC and Medicaid, Table 1 shows the budget constraint for a mother with two children in Illinois in 1991 (several expenses are presented at the bottom of the table). The annual AFDC benefit level of $4,404 in Illinois is near the national median, so the conclusions from this table are applicable to many other states as well. When this mother considers marrying the father, who earns $15,000 and lacks employer-provided health insurance, the couple loses AFDC and Medicaid benefits. For a mother with two children, Medicaid is valued at $2,342 in Illinois.8 By marrying, the couple's total income drops by $6,220, or 29 percent. Thus, the disincentive to marry could be substantial. The loss of Medicaid benefits accounts for a significant part of the total penalty. If both children were covered by Medicaid through the eligibility expansions used in this study, the penalty for marrying would decrease by $1,434 and the decision to marry may not be so discouraged.9
B. Description of Medicaid Expansions
To separate the effect of Medicaid from AFDC on the decision to marry, I utilize a series of health insurance expansions targeted toward children which were implemented from 1987 to 1993. These expansions came in response to growing concern about increases in infant mortality and increases in preventable childhood illnesses.10 Before these expansions, Medicaid eligibility was highly correlated with AFDC eligibility. The expansions severed the link to AFDC eligibility by eliminating the need for a child to live in a one-parent household in order to qualify. In addition, the Medicaid expansions usually raised the income limit to qualify, even for children in one-parent households.
The federal government first allowed and later mandated states to expand Medicaid eligibility to a broader set of children. The Omnibus Budget Reconciliation Act (OBRA) of 1986 gave states the option to implement the expansions to children younger than two years old up to 100 percent of the federal poverty level (FPL). OBRA 1987 gave states further options, by letting them implement expansions for children up to age eight who were born after September 30, 1983, to 100 percent of the FPL. The new legislation also increased the income eligibility limit even more for infants. OBRA 1989 mandated coverage for children under age six to 133 percent of the FPL, starting in April 1990. Finally, OBRA 1990 mandated Medicaid coverage to all children under age 19 who were born after September 30, 1983, to 100 percent of the FPL. When this phase-in is complete in 2002, all children living in poverty will be eligible for Medicaid.11
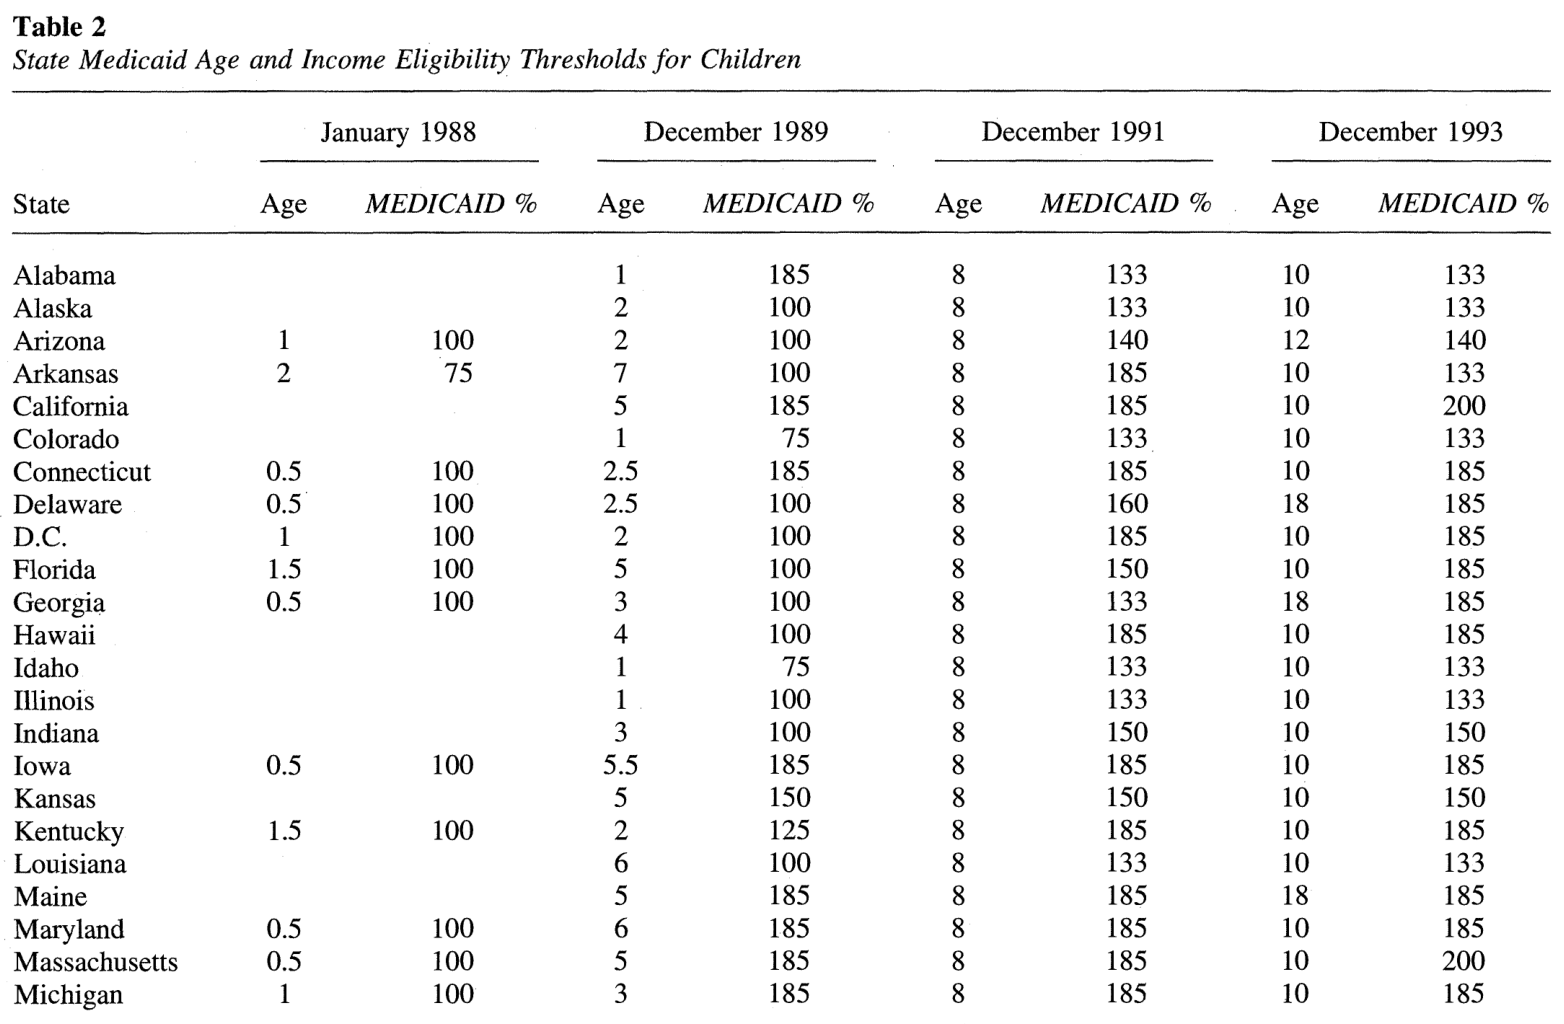
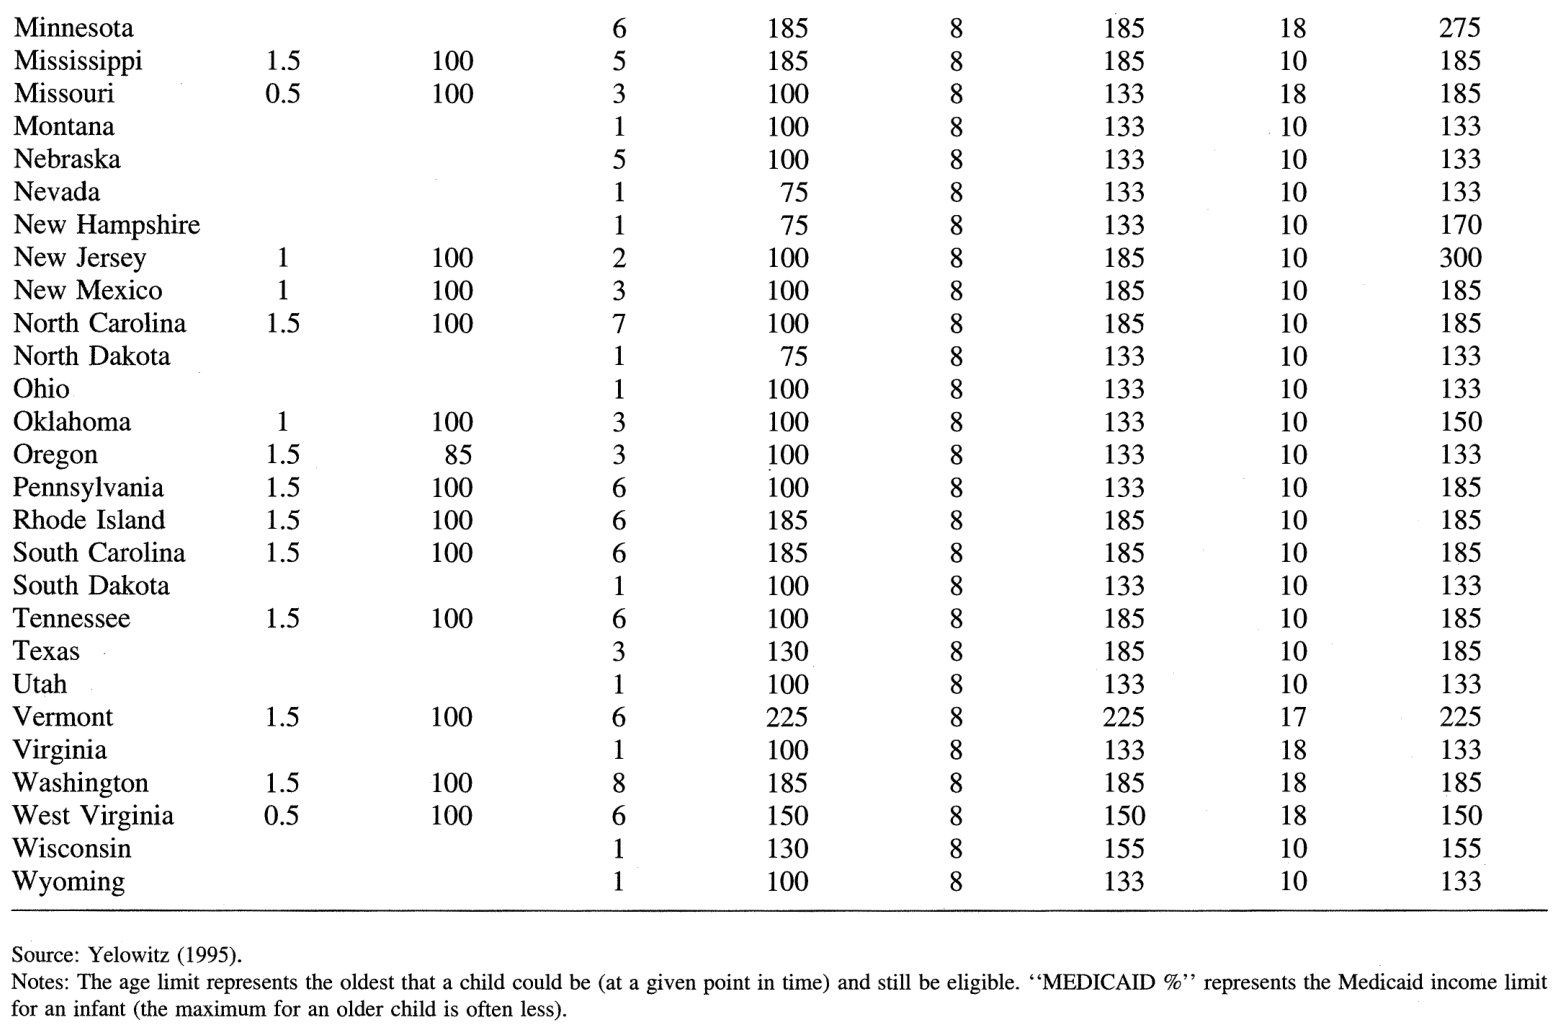
Table 2 illustrates the growth in Medicaid eligibility rules for children between January 1988 and December 1993. In early 1988, roughly half the states had expanded Medicaid eligibility to children under the age of two. By the end of 1989, however, all states had implemented some form of coverage. In addition, there was a great deal of cross-sectional variation in the age limit for children, as well as some variation in the family income eligibility cutoff. As a consequence of the later federal mandates, the cross-sectional variation in the age limit disappeared by the end of 1991-all states had expanded eligibility to children under the age of 8. After 1991, several states used their own funding to expand eligibility to children who were not covered by the federal mandates. The states did this in two ways. First, they covered children born before October 1, 1983, who were previously excluded from these benefits. Second, they covered children living in middle-class families. For instance, Minnesota expanded Medicaid to 275 percent of the poverty line in 1993 and New York covered all children under the age of 13.
The new Medicaid rules had many consequences on health insurance coverage. First, the fraction of children eligible for Medicaid more than doubled between 1984 and 1992. By 1992, nearly one-third of all children under 18 were eligible (Currie and Gruber 1996a). The expansion in eligibility also increased coverage among children. By 1991, three million children were covered from these expansions (Yelowitz 1995). Medicaid participation among all children rose by 6.7 percentage points between 1987 and 1992, and approximately 68 percent of this rise was due to changing the eligibility rules (Shore-Sheppard 1995). The changes for children in married families were particularly dramatic. The fraction of covered children rose from 6.4 percent in 1987 to 11.8 percent in 1992 (Shore-Sheppard 1995). Although part of this 84 percent increase in coverage was certainly due to covering newly eligible children in currently married families, it is possible that part of the increase was due to women becoming married.
Table 2. State Medicaid Age and Income Eligibility Thresholds for Children
Notes: Notes: The age limit represents the oldest that a child could be (at a given point in time) and still be eligible. "MEDICAID %" represents the Medicaid income limit for an infant (the maximum for an older child is often less).
These trends in coverage offer promise for examining Medicaid's effect on marriage.
III. Theoretical Effects of Medicaid on Marriage
Following Moffitt's (1990) formulation, the mother compares her maximized utility in two different states of the world, married or single. Her utility function contains three arguments: a marriage indicator, leisure, and other goods. Hence the mother will marry if .
The first argument in the utility function is an indicator variable for whether the mother is married; the second argument, , is the mother's optimal quantity of leisure when married ( when single); and the third argument, , is her optimal consumption of other goods when married ( when single).
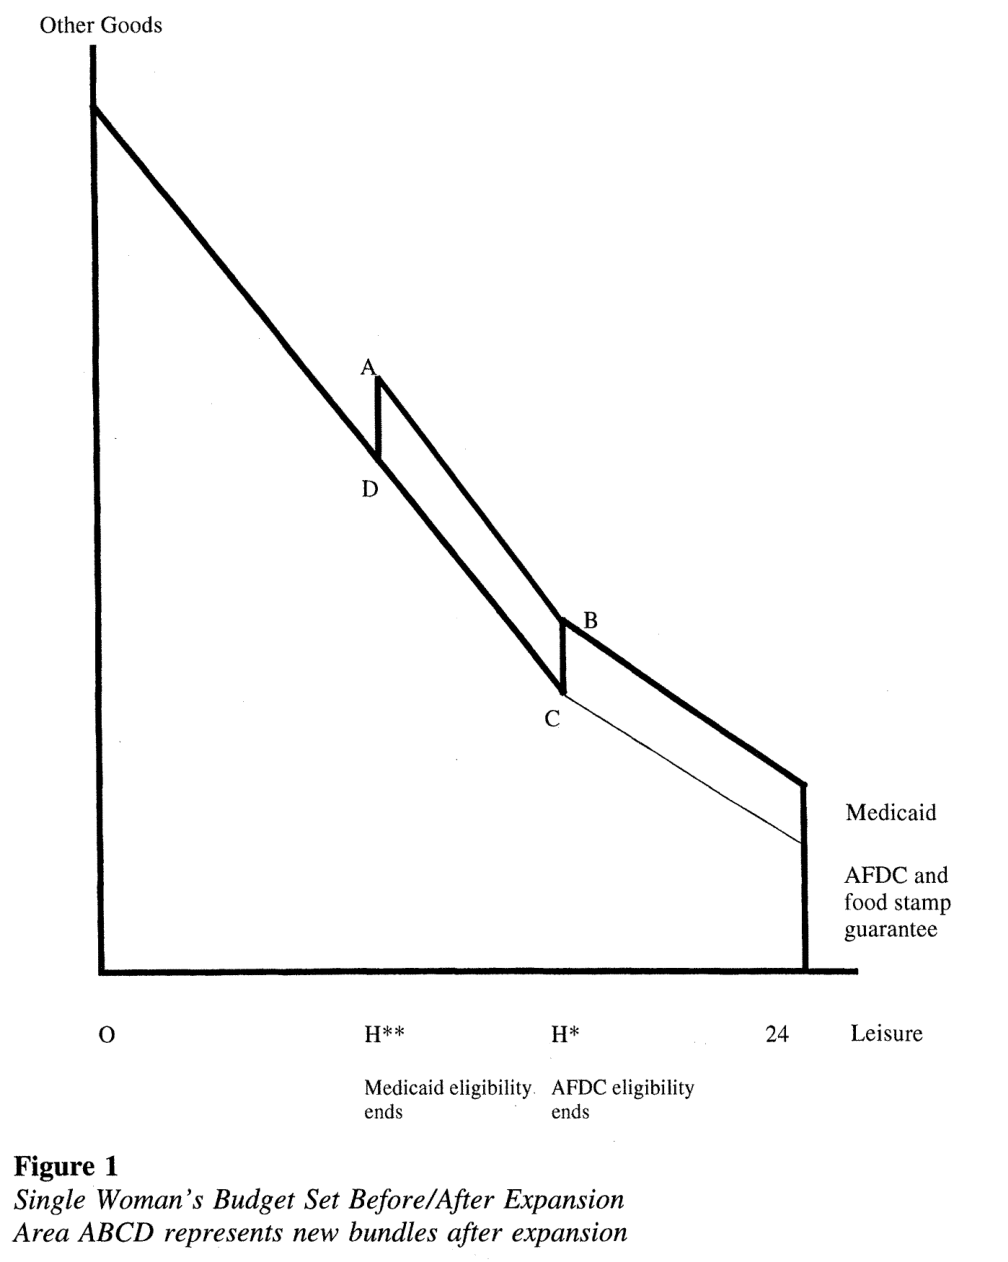
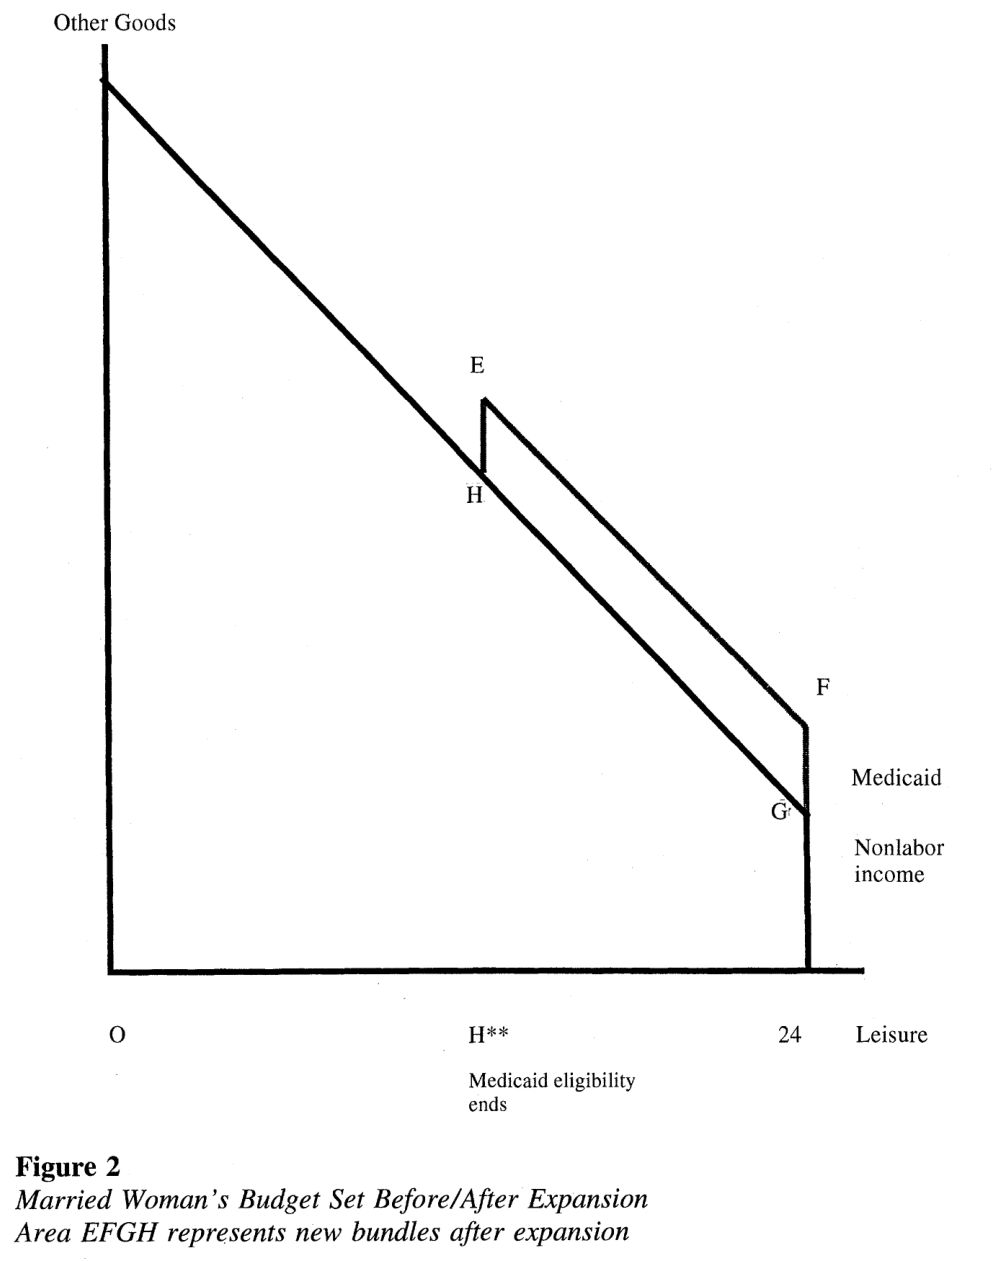
The bold lines in Figure 1 illustrate the budget set facing a single mother before the Medicaid expansions. The AFDC system causes the budget set for a single woman to be nonlinear. When the mother does not work, her family collects AFDC, food stamps, and Medicaid.12 As she begins to work, her AFDC and food stamp benefits are taxed away at a high rate, but she retains health insurance until she reaches the hours threshold where AFDC eligibility ends, . By working more than , her family loses Medicaid. After this point, her after-tax wage is higher (and determined through the federal and state income tax codes). The bold lines in Figure 2 illustrate the opportunities facing a married mother before the expansions. Her nonlabor income includes her husband's earnings and other transfer income, such as food stamps, which are available to two-parent families. It is further assumed that the husband does not have health insurance through his employer.
The dashed areas in the figures illustrate the effect of the Medicaid expansions on the budget sets.13 New [Leisure, Other Goods] bundles exist for the single mother in area ABCD, and for the married mother in area EFGH. In both figures, Medicaid eligibility now ends when she works more than .14 One obvious implication from changing the budget constraints in this way is that the expansions may encourage a single mother to marry. If so, she would now locate somewhere along the line segment EF in Figure 2. Without imposing some functional form restrictions on the utility function, however, the expansions have an a priori ambiguous effect on the decision to marry. It is possible that an initially married mother would prefer to become divorced and locate at a point on the line segment AB in Figure 1. This could be construed as an ''independence effect'' caused by increasing the Medicaid income limit for a single mother (Groeneveld, Hannan, and Tuma 1980).15
Figure 1. Single Woman's Budget Set Before/After Expansion Area ABCD represents new bundles after expansion
Caption: Married Woman's Budget Set Before/After Expansion Area EFGH represents new bundles after expansion.
With new bundles on both budget sets, the effect of the expansions is theoretically ambiguous. The design of the Medicaid expansions, however, will allow me to identify the importance of the independence effect. Consider a Medicaid expansion that did not change the single mother's budget constraint, that is, in a state with a high AFDC income limit.16 If this is the case, then the area ABCD in Figure 1 existed before the expansion. There are still new bundles for the married mother in Figure 2, because her family did not previously qualify for Medicaid. Because the married mother could have picked any point on the single mother's budget set before the expansions, she will not choose to become divorced afterward.
By comparing states with high and low AFDC income limits in the empirical implementation, I will be able to isolate the flows into marriage from the Medicaid expansions. The implication from the budget constraint analysis is that the Medicaid expansions should have a stronger positive effect on marriage in high AFDC benefit states than in low AFDC benefit states because there is no independence effect.17
IV. Data Description and Empirical Implementation
A._ _The Data Set
I use repeated cross-sections from the 1989-94 March CPS in the analysis. I include both married and single women between the ages of 18 and 55 with at least one child younger than 15 present.18 This results in 103,177 observations where the unit of observation is the mother. To each mother's record, I link all her children's ages. I use details on the timing and generosity of the Medicaid expansions, some of which are outlined in Table 2, to impute current Medicaid expansion eligibility.19 The expansions condition current eligibility on three exogenous margins and two endogenous margins. They create variation across states, over time, and by child's age. If a child falls into the right state-time-age bracket, I classify the child as currently eligible.20 I do not use the two endogenous margins, the family's income level, or the mother's marital status to compute eligibility. To make this concrete, consider the first line of Table 2, which documents the Medicaid expansions in Alabama. In 1988, all children are classified as ineligible. In 1989, I classify all children aged zero and one as eligible for Medicaid, regardless of their family's income. Thus, children in wealthy families are classified as eligible because I do not condition on income. In 1991, I would classify all children who are ages eight and younger as eligible for the expansions.
I then use these imputations on children to create different policy variables that reflect the new bundles on the married woman's budget set. - is an indicator variable set equal to one if all the children younger than 15 in the family would be covered by the expansion if the woman became married, and zero otherwise.
is an indicator equal to one if any child in the family would be covered by the expansion if the woman became married, and zero otherwise.
Thus, a mother in Alabama with a three-year-old and a nine-year-old would have and set equal to zero in both 1988 and 1989. In 1991, this mother would have set equal to one, because her three-year-old would be covered under my imputation. would be equal to zero, however, because her nine-year-old is not eligible based on the state rules and time period. Finally, in 1993, both and would be equal to one. Therefore, corresponds to covering the oldest child in the family while corresponds to covering the youngest child. In the entire sample, the mean of is 0.38 and the mean of is 0.55.21
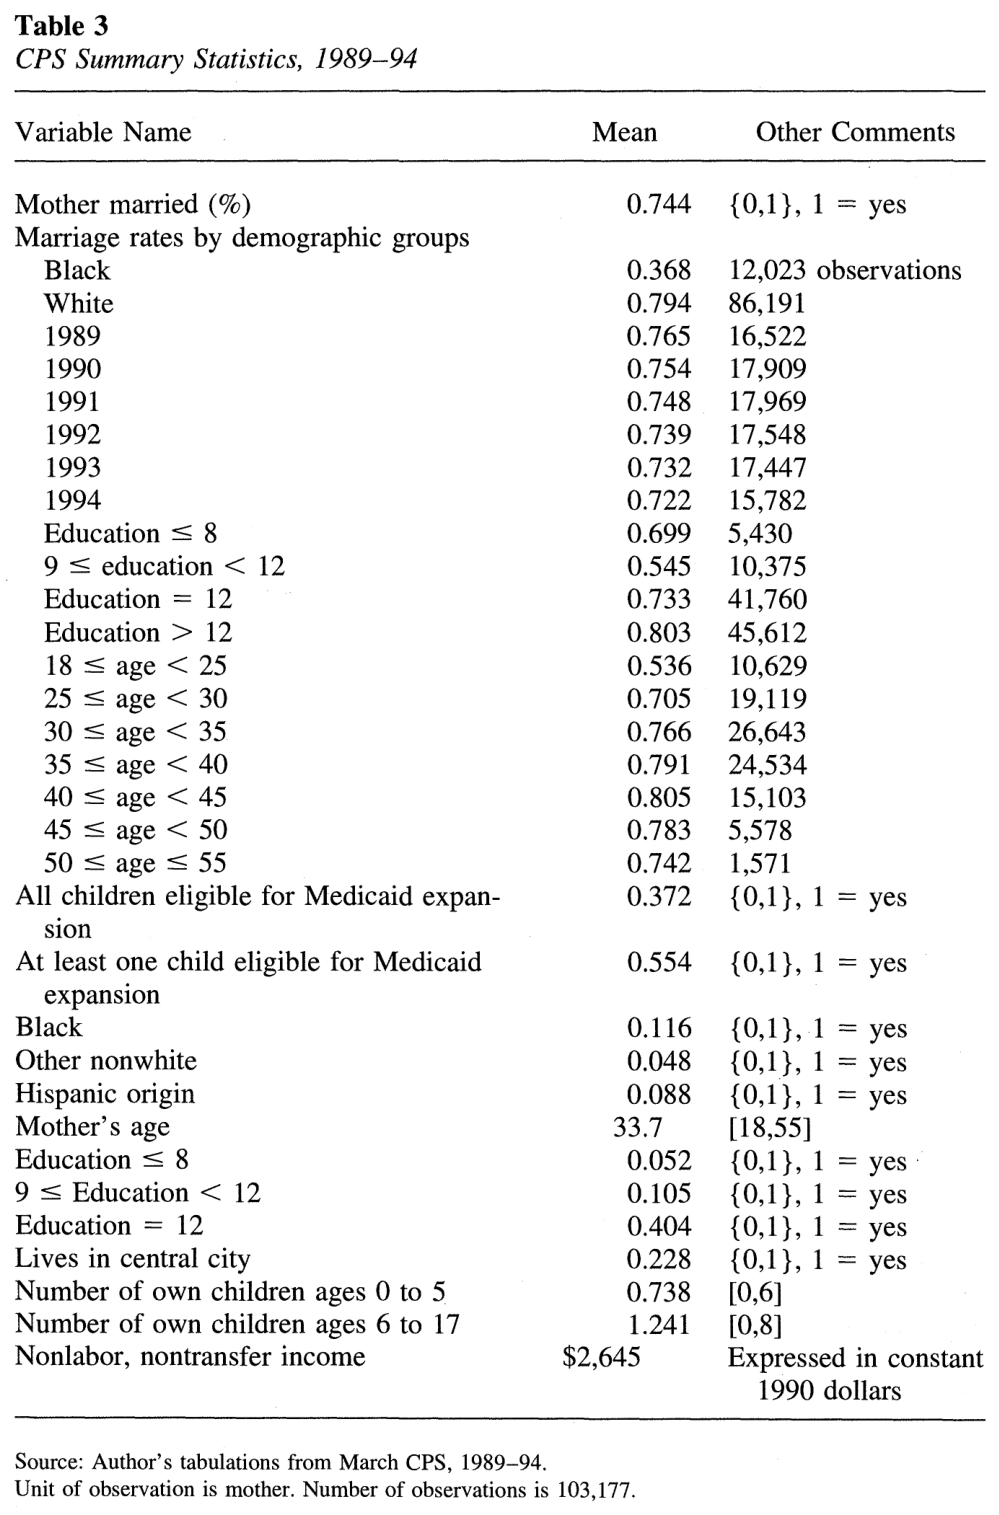
Table 3 presents summary statistics of the CPS variables used in the analysis. The dependent variable is marital status (as of March 1 of the survey year). Approximately 9 percent of the women are divorced, 5 percent are separated, 9 percent are never married, and 1 percent are widowed. Three-quarters of the sample are married, but there are striking differences in marriage rates along several dimensions. First, white mothers are more than twice as likely to be married than black mothers, with a rate of 80 percent compared to 37 percent. Second, marriage rates gradually decline during the sample period, from 76.5 percent in 1989 to 72.2 percent in 1994. Third, there are differences in marital status by educational attainment and age group. Marriage rates increase until age 45 and then decline.
Additionally, college-educated women are more likely to be married than other women.
The rest of the table contains independent variables that will be used in different specifications. The other explanatory variables include the mother's race, age, and educational attainment; an indicator for residence in a city; the number of children under age six and the number of children between ages six and 17. Approximately 11.6 percent of the women in the sample are black, 4.8 percent are other nonwhite, and the remainder. of the sample are white. Nearly 9 percent are Hispanic. The average age of the mothers is close to 34 years. Nearly 16 percent of these women did not finish high school, while 44 percent have some college education.22 Approximately 23 percent live in a city. The average number of children under age 6 and between ages 6 and 17 are 0. 7 and 1.2, respectively. Nonlabor, nontransfer income is $2,645 (in constant 1990 dollars). Thus, a large part of the sample is potentially on the margin for the Medicaid expansions.
Notes: Source: Author's tabulations from March CPS, 1989-94.
Unit of observation is mother. Number of observations is 103,177.
B. Empirical Implementation and Identification Strategy
I estimate a probit model from repeated cross sections to predict the effect of a child's Medicaid eligibility on the mother's decision to marry. The equation used in estimation is:
Equation (1):
where (1) is the underlying index function for the probit. represents the latent net utility from being married. The subscript i indexes mothers, j indexes the state of residence, t indexes time, and y indexes the youngest child's age. The key independent variable, corresponds to one of the Medicaid eligibility measures mentioned above. The vector is exogenous individual characteristics of the mother. The variables , and contain dummy variables for 50 states and the District of Columbia, six time periods, and 15 youngest child's ages, respectively.
In practice, we do not observe the underlying value for but instead observe only the discrete outcome:
Equation (2):
equals one if the woman is currently married and zero otherwise. Assuming that
and denoting
as the cumulative normal function gives the following probability:
Equation (3):
A child's eligibility for Medicaid is constructed from three arguably exogenous dimensions. It is a function of the child's age (because some children are ineligible based on being born before October 1, 1983). It is also a function of the child's state of residence (because states initially had the option of implementing the expansion) and the time period (because the expansions became more generous at the end of the period).23 By conditioning eligibility on the child's age, the expansions created differences in the budget constraint even for families within the same state at a point in time.
The implementation of the Medicaid expansions created three comparison groups to identify the effect of extending Medicaid on marriage: Mothers within a state with ineligible children, mothers across states with ineligible children, and mothers over time with ineligible children. If there are other reasons that Medicaid eligibility is correlated with the error term after conditioning on the other covariates, then the coefficient estimate on Medicaid eligibility would be biased. If attitudes toward female headship vary across states and are correlated with a state's Medicaid program but not included in the model, then the simple cross-sectional comparisons would also be biased.
By including dummy variables for STATE, TIME, and YOUNGEST child's age in the regression framework, we control for many of these omitted factors. By including state dummies, the effect of Medicaid is estimated from three sources of within-state variation. First, individual states changed their Medicaid program at very different rates from 1988 to 1993, either by their own choice or by federal mandate. Second, even at a given point in time, Medicaid eligibility varies based on the range of ages to cover. Finally, the age distribution of children within a family (in a particular state at a point in time) provides further variation. Two families, both with a youngest child of the same age, might receive different treatment based on the ages of their older children.
Although including these dummy variables removes many other factors that influence marriage and are correlated with eligibility, it may not remove all. The Earned Income Tax Credit (EITC), for example, offers incentives to alter living arrangements for different households (Scholz 1994). The EITC both changes over time and is more generous to families with very young children. If changes in the EITC affect marriage decisions and are correlated with more generous Medicaid eligibility, the model should include an interaction of time and child's age.24 Thus, I include interactions of state and time, and of time and child's age for the "baseline" specification. Equation (3) is amended to be:
Equation (3′):
This model addresses many of the remaining concerns (for instance the changes in the EITC, which are subsumed with the interaction). Finally, I estimate a model on mothers in the 25 largest states that includes all second-order interactions. By doing so, the effect of Medicaid eligibility is identified through the interaction.
It is important to emphasize that the regression specification includes only a subset of variables that are thought to be important in analyzing the marriage decision. Because many of these ''marriage market'' variables-such as the AFDC guarantee, the market wages of men and women, the number of marriageable men, and the unemployment rate-usually vary only across states and over time in previous empirical work, the specifications that include interactions should control for these factors. In addition, several individual-level variables-such as religious affiliation and family background-surely help to explain marriage rates. Unfortunately, the CPS does not provide a very rich set of individual-level variables. In any case, the key point remains the same: the goal of this paper is to provide an unbiased estimate of the effect of Medicaid eligibility on marriage decisions. By using the three dimensions outlined above, I hope to purge the Medicaid estimates of any other state- or individual-level influences.
V. Results from the CPS
A. Basic Results
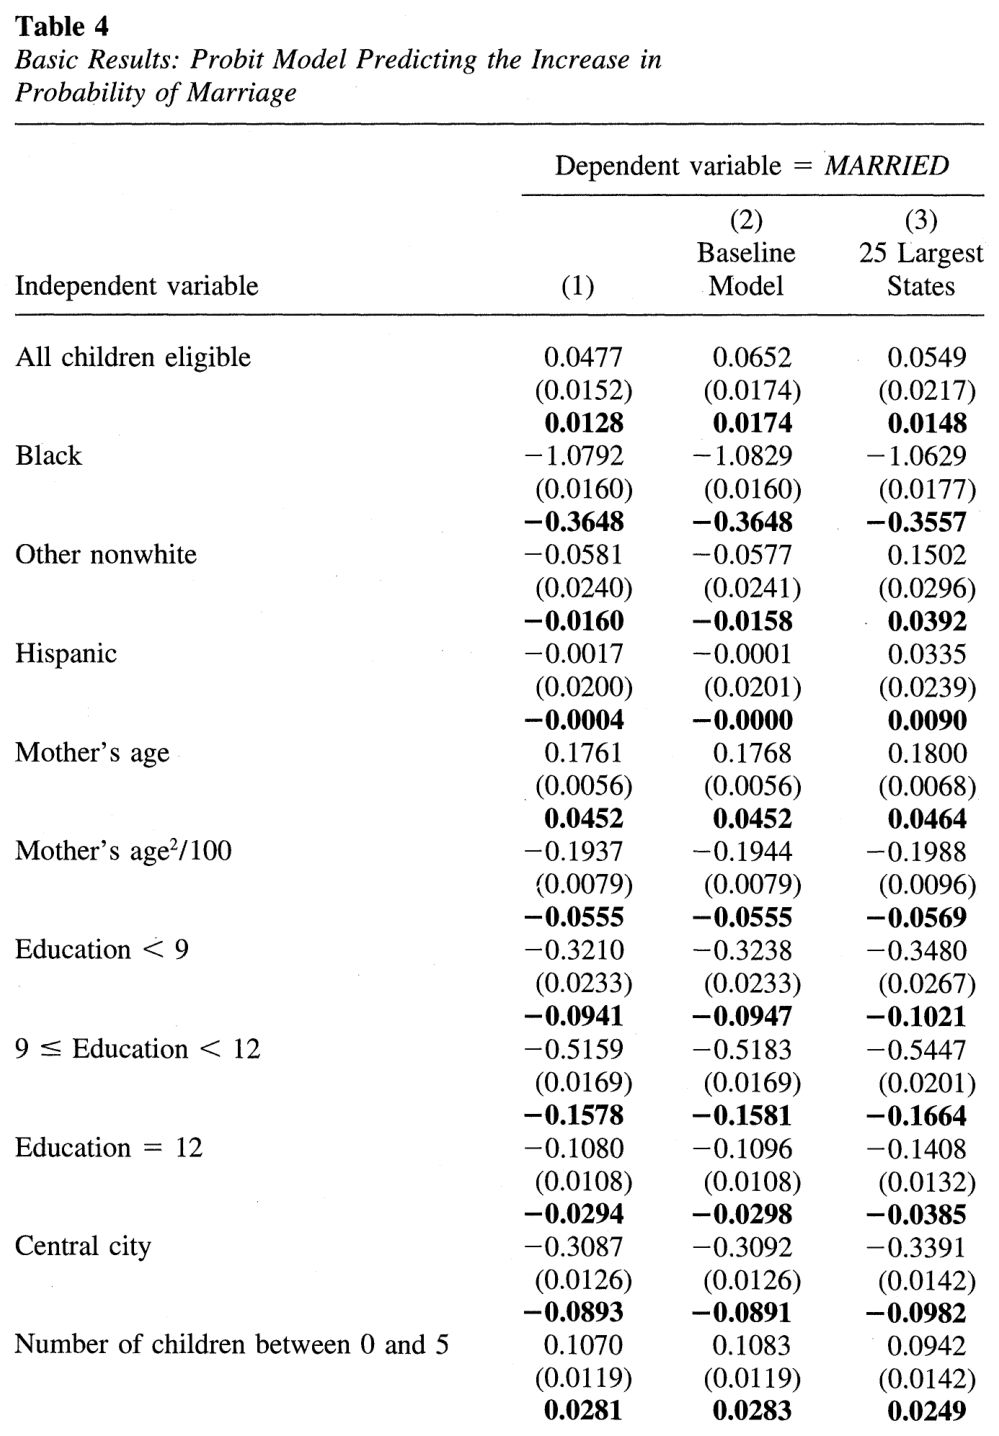
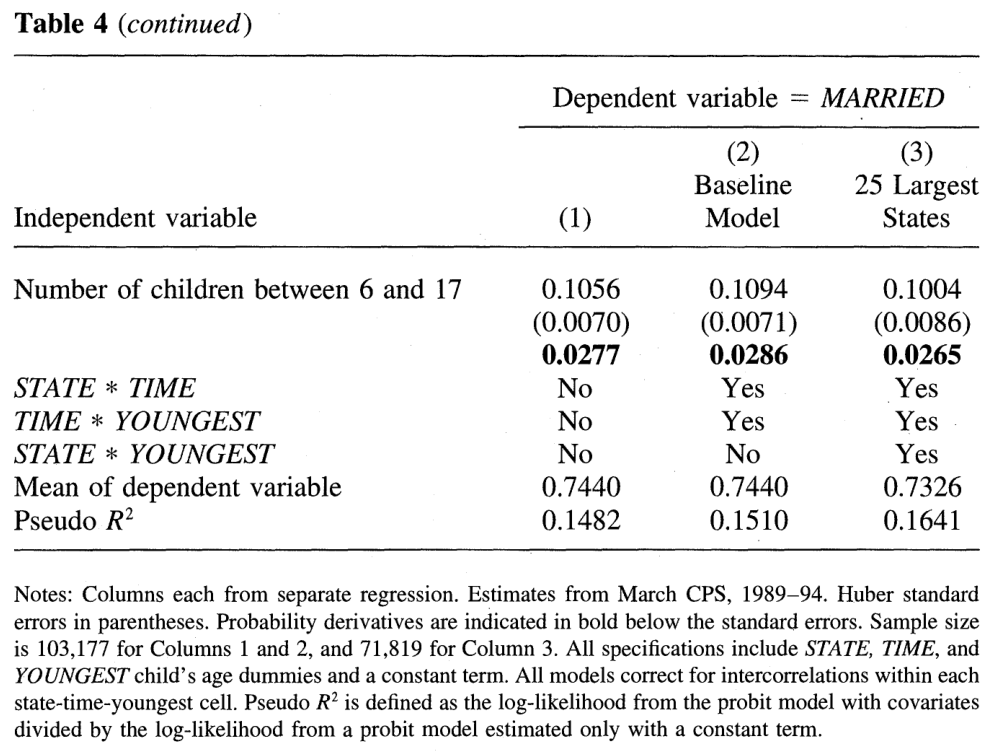
Table 4 presents the basic results using the first measure, whether or not all the children in the family were eligible. All specifications presented below include indicator variables for state, time, and the youngest child's age.25 The standard errors in all specifications are corrected for heteroskedasticity. They also correct for any residual correlations within state-time-youngest age clusters.26 Recall that the predicted effect of the eligibility expansions is ambiguous. The first two columns include the entire sample in the estimation. The first column corresponds to the "difference-in-differences" specification. The inclusion of these dummy variables controls for other factors, such as national economic conditions or fixed differences across states in attitudes toward female headship, which may be correlated with . The second column, which additionally controls for and interactions, will be called the baseline specification. By including these interactions, I control for the potential impact of AFDC cash benefits, the Medically Needy program, the EITC, and AFDC-UP on marriage separately from Medicaid's effect.
These two columns in Table 4 indicate a significant positive relationship between Medicaid and marriage. The model in Column 1 shows an effect of Medicaid eligibility of 1.3 percentage points.27 I am still able to precisely estimate Medicaid's effect from the within-state variation based on variation in the age distribution of children, and from the rapid changes within a state over time in Medicaid eligibility.28 Although the first column eliminates many of the obvious explanations that could bias the results, it is important to note that the result on Medicaid is robust to a richer set of controls. In the second column, extending Medicaid coverage to the last child in the family significantly increases the probability of marriage by 1.7 percentage points. The other variables are largely self-explanatory. Being black has a large negative impact on the probability of marriage. In contrast, the other nonwhite indicator has a much smaller negative effect. Lower levels of mother's education decrease the probability of marriage. Residing in a central city has a substantial negative impact on marriage, and the number of children (of any age group) has a substantial positive impact on the probability of marriage. As Columns 1 and 2 illustrate, the coefficient estimate on increases with the inclusion of and interactions. This suggests that unmodeled factors, such as changing economic conditions within a state, may bias the estimates in Column 1 downward.
Table 4. Basic Results: Probit Model Predicting the Increase in Probability of Marriage
Notes: Notes: Columns each from separate regression. Estimates from March CPS, 1989-94. Huber standard errors in parentheses. Probability derivatives are indicated in bold below the standard errors. Sample size is 103,177 for Columns I and 2, and 71,819 for Column 3. All specifications include STATE, TIME, and YOUNGEST child's age dummies and a constant term. All models correct for intercorrelations within each state-time-youngest cell. Pseudo R2 is defined as the log-likelihood from the probit model with covariates divided by the log-likelihood from a probit model estimated only with a constant term.
The last column of Table 4 restricts the sample to the 25 largest states. This restriction results in 71,819 observations, or 70 percent of the original sample. This final column includes all the previous covariates, and also includes STATE* YOUNGEST interactions. Although it was not feasible to perform this "difference-in-difference-in-differences" specification on all states, the results show that at least for these states, the estimated effect of the expansions is still positive and significant after including these additional interaction terms.29 The point estimate falls compared to the baseline specification, however. Extending Medicaid to all children in a family leads to a 1.5 percentage point increase in the probability of marriage. With one exception, the other covariates remain similar to the previous columns. The exception, "other nonwhite," switches from a negative to a positive sign. This category includes several races that have different propensities to marry and differ in composition from the national sample. Hispanics, who represent a larger fraction of the population in California and Texas, might have a higher propensity to marry ( or a lower propensity to divorce) due to their cultural upbringing. A similar argument could be made for Asians in California. Although the model directly controls for Hispanic ethnicity, part of the effect may still come through other nonwhite.
B. Alternative Parameterizations
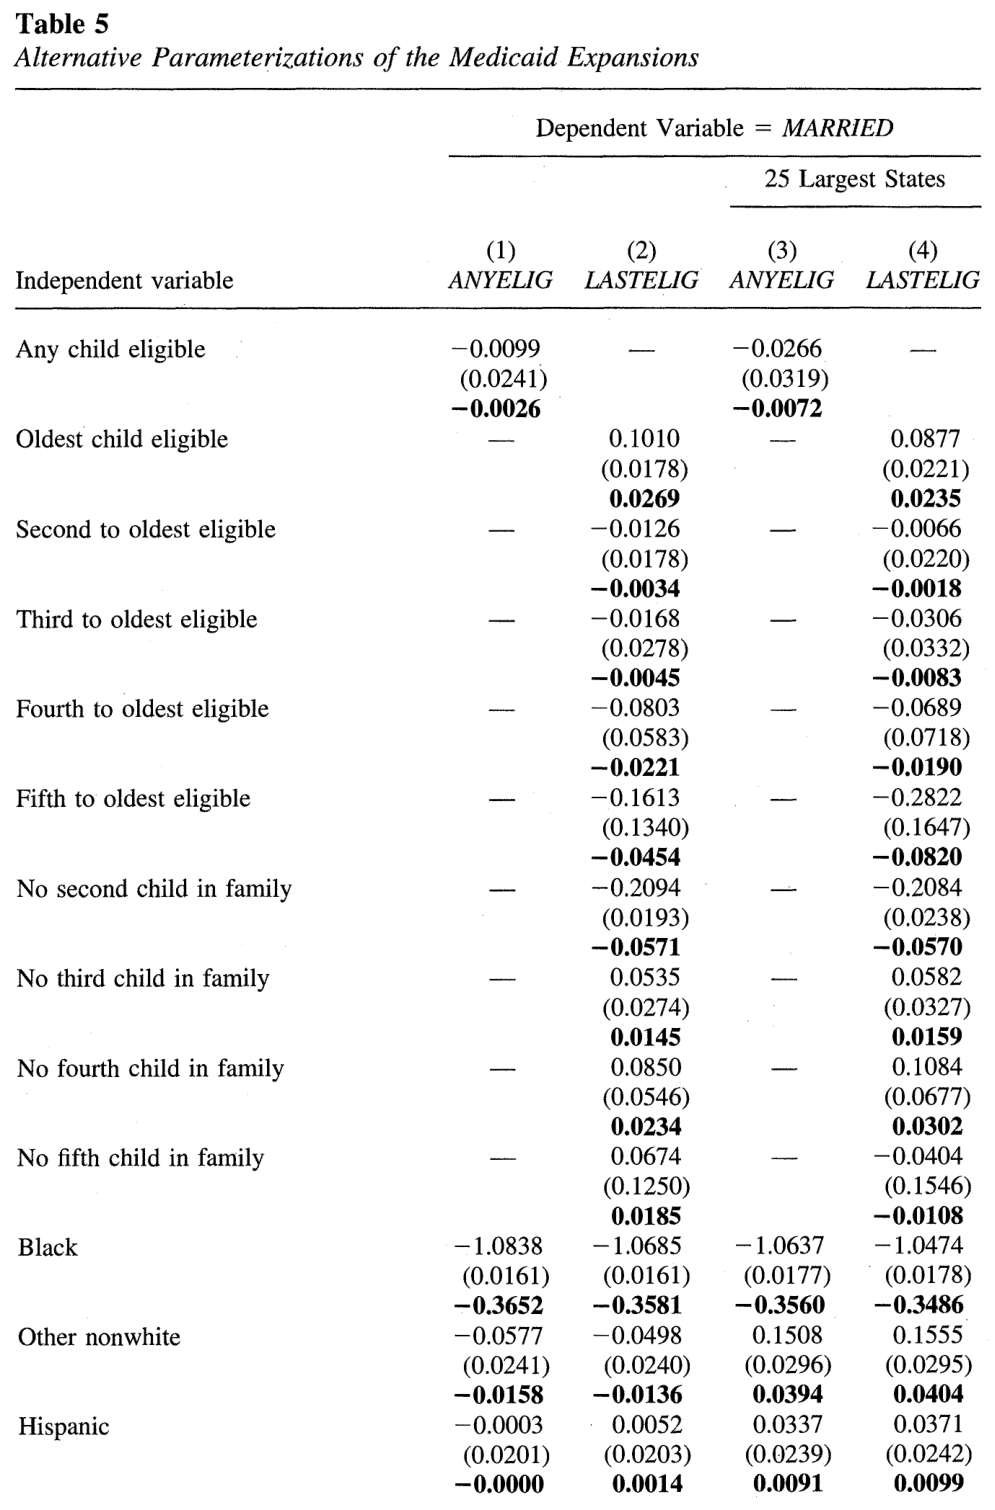
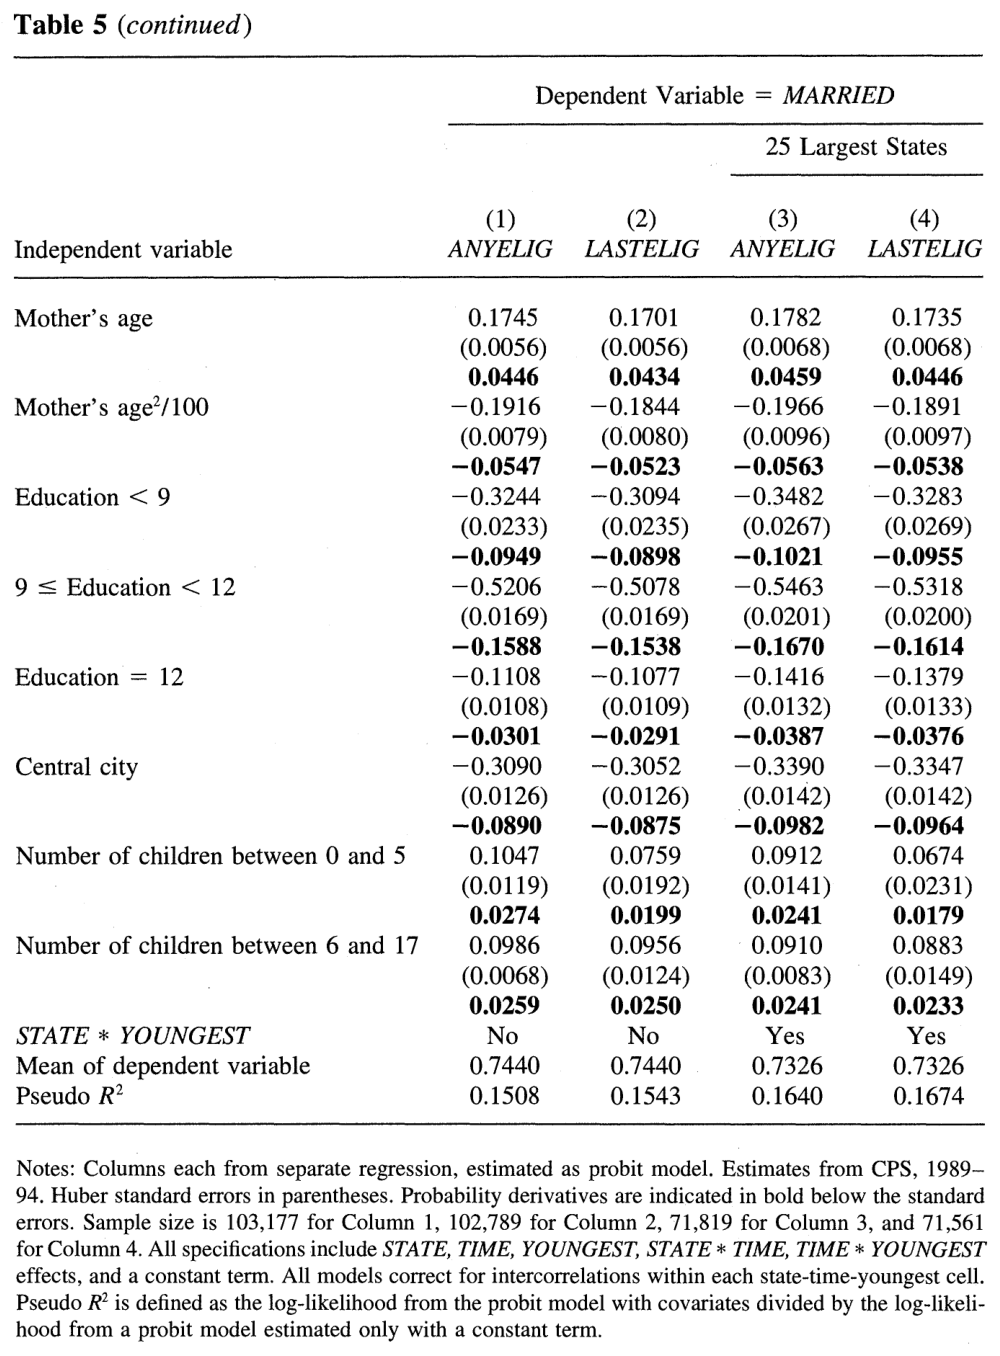
Table 5 explores a second representation of the Medicaid law: Are any children in the family eligible for the Medicaid expansions? Column 1 presents estimates of for the model that includes both and interactions (corresponding to the second column of Table 4). It is likely that the result should be weaker by not necessarily covering every child in the family with Medicaid. Although this intuition is borne out by the table, the results on are still unexpected (given the results on ALLELIG). This measure yields results that are small, negative in sign, and indistinguishable from zero.
One possible reason for the difference between the two measures could be that the effects of covering children are nonlinear. Many private or employer-provided health insurance plans offer different premiums for a single individual than for a family, but very few make a distinction based on the number of children in the family. If a mother has to make a choice between purchasing private coverage and taking up Medicaid, then it is possible that partial Medicaid coverage for her children would be a very imperfect substitute for private coverage. To explore the difference between and further, Column 2 restricts the sample to mothers with five or fewer children. This column attempts to examine where Medicaid eligibility matters by including indicator variables for whether each child in the family was covered. The variable ''Oldest child eligible'' refers to whether or not the oldest child in the family is Medicaid-eligible based on the state rules, time period, and child's age. The variable "Second to oldest eligible" refers to the second oldest child, and so on. Because I examine families with different numbers of children, I also include dummy variables for whether a second child was present in the family, a third child was present, and so on. The results in Column 2 clearly demonstrate that covering the oldest child in a family is associated with a significant effect on marriage rates, although partial coverage has little effect. Covering the last child results in an increase in the probability of marriage of 2.4 percentage points. In contrast, the other eligibility variables are negative and insignificant. Most of the other covariates are of similar sign and significance to the first column. Although the point estimates on number of children aged between zero and five and six and 17 are roughly the same magnitude as Column 1, the standard errors rise considerably because of the inclusion of the dummy variables for presence of a second, third, fourth, and fifth child.
Table 5. Alternative Parameterizations of the Medicaid Expansions
hood from a probit model estimated only with a constant term.
The third and fourth columns of Table 5 estimate the model that also includes interactions, corresponding to the third column of Table 4. The results of estimating this model using the 25 largest states lead to the same conclusion as before: Covering the last child in a family has a significant effect on marriage rates, although partial coverage has little effect. This table has shown the different estimates of the three measures and why they may differ. The remainder of the analysis will therefore focus on the first measure, ALLELIG, and include the same covariates as the model presented in Table 4, Column 2.30
C. The Independence Effect
I next examine potential outflows from marriage due to the ''independence effect.'' This is motivated by previous research on the negative income tax, which finds differences in divorce rates based on whether welfare benefits are awarded to the entire family unit (including the husband), or just to the wife.31 Recall that the expansions severed the link to AFDC eligibility by changing both income and family structure requirements. Because increasing the income limit could lead to new bundles on the single woman's budget set, the previous estimates could understate Medicaid's true impact (because not all of the economic incentives offered by the expansions work in the direction of becoming married).
To control for this independence effect, I restrict the sample to those women in nine states with high AFDC benefits.32 For this group of women, the Medicaid expansions should have little impact on becoming divorced. Because the expansions continued to offer new coverage for married women, they will still have an impact on the decision to marry. Restricting the sample leads to 28,284 observations from high-benefit states. As a contrast, I also select 16,844 observations from nine low-benefit states where the effects of the Medicaid expansion could result in higher divorce rates by dramatically changing the single woman's budget set.
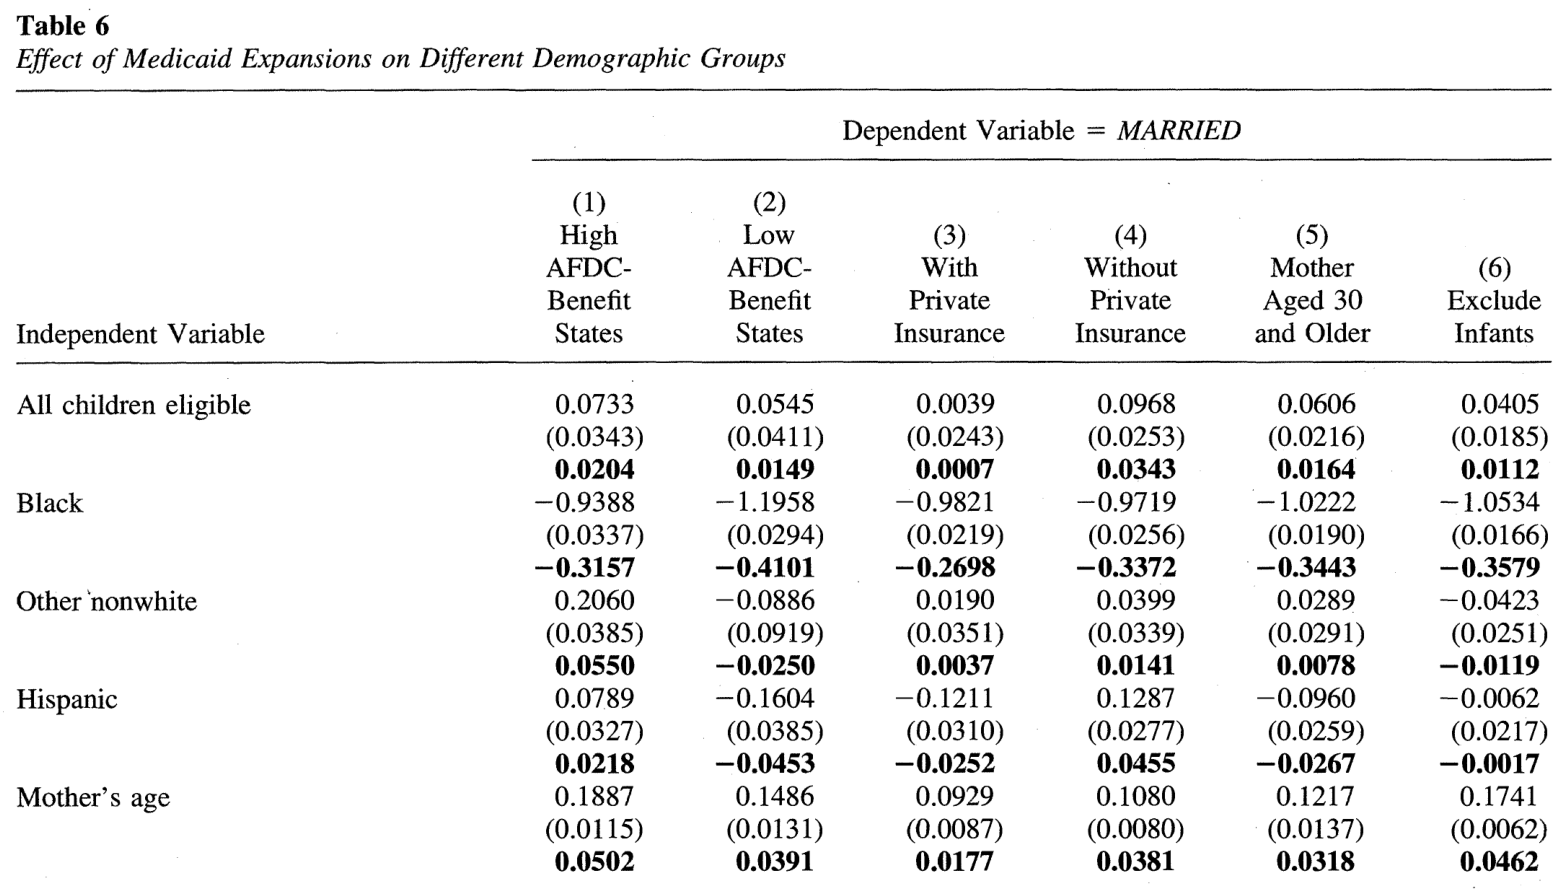
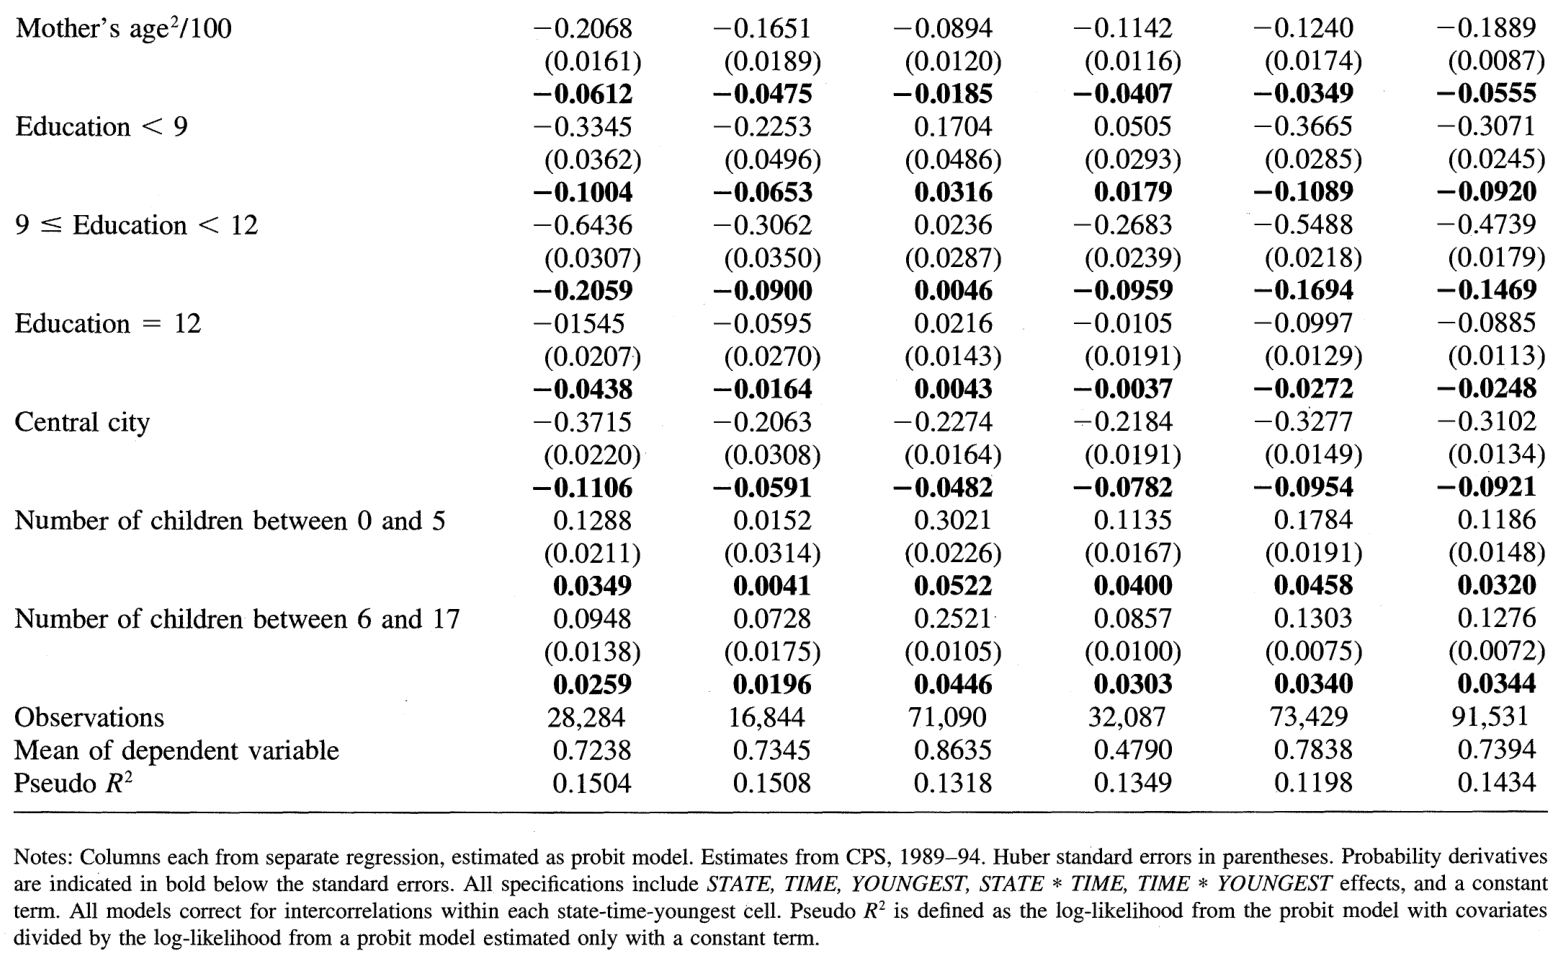
Columns I and 2 of Table 6 show the importance of the independence effect to the coefficient estimates. The first column restricts the sample to high-benefit states. The estimated marginal effect of ALLELIG increases to 2.0 percentage points, or around 10 percent higher than the baseline estimate in Table 4. The second column shows that the estimated positive effect on marriage is somewhat lower for the low-benefit states relative to the baseline estimate. This lower estimate should be expected because a Medicaid expansion that increases the benefit of becoming single will likely result in more divorces. Although these findings show that these outflows are important, the importance of the independence effect is smaller than in the findings of Groeneveld, Hannan, and Tuma (1980). More recent studies that reanalyze the Seattle-Denver Income-Maintenance Experiments and use longitudinal data come to strikingly different conclusions: Cain and Wissoker (1990) find no independence effect, although Hannan and Tuma (1990) find significant responses for blacks and whites. A five-year guarantee of income maintenance increased the rate of dissolution by about 40 percent for blacks and whites (Hannan and Tuma 1990: 1294). Although the independence effect does appear to operate for Medicaid, the magnitude is much smaller than the estimates of Hannan and Tuma (1990).
D. Specification Checks
Several other checks were performed on the plausibility of the results. First, I address the robustness by examining a woman's insurance status. The Medicaid expansions should have little effect on a woman if she has health insurance through a private source. Although the choice to purchase private insurance could be a function of public health insurance availability, looking at it may still provide further confidence in the basic results.33 We should expect to observe a larger effect of Medicaid by excluding women with private coverage. Approximately two-thirds of the mothers had a source of private health insurance coverage and one-third did not.34 Columns 3 and 4 of Table 6 (which contain the same independent variables as in the baseline model) show that the coefficient on ALLELIG increases from 1.7 to 3.4 percentage points for those without private health insurance. On the other hand, covering all children in a family has an insignificant effect on families with employer-provided health insurance, with a probability derivative of 0.1 percentage point.
states were California, Connecticut, Massachusetts, Michigan, Minnesota, New York, Rhode Island, Vermont, and Wisconsin. I also selected nine low-benefit states that had an AFDC benefit of less than $250. These were Alabama, Arkansas, Kentucky, Louisiana, Mississippi, South Carolina, Tennessee, Texas, and West Virginia. After the appropriate institutional detail is accounted for, such as the "30 and 1/3 disregard,'' childcare expenses, and work expenses, the AFDC limit can exceed the new Medicaid limit. Yelowitz (1995) discusses this further.
Table 6. Effect of Medicaid Expansions on Different Demographic Groups
Notes: Notes: Columns each from separate regression, estimated as probit model. Estimates from CPS, 1989-94. Huber standard errors in parentheses. Probability derivatives are indicated in bold below the standard errors. All specifications include STATE, TIME, YOUNGEST, STATE TIME, TIME YOUNGEST effects, and a constant term. All models correct for intercorrelations within each state-time-youngest cell. Pseudo R' is defined as the log-likelihood from the probit model with covariates divided by the log-likelihood from a probit model estimated only with a constant term.
A second important issue is that women might react to the expansions by having additional children. If this is so, the effect of Medicaid that I observe in the data may not be a "marriage effect" but rather a "fertility effect."35 Although Ellwood and Bane (1985) and many subsequent studies find no evidence that higher cash benefits lead to additional births, it remains important to examine this potential source of selection bias. To illustrate, consider a married couple without any children who react to the expansions by having a baby and enrolling the child in Medicaid. The family will then enter into my sample and appear as if they are becoming married in response to the expansions, when in fact they are not.36
I address the childbearing issue in two ways. As Ellwood and Bane (1985) note, childbearing varies substantially by a woman's age. Fertility data from the U.S. Department of Health and Human Services (1988) bear this out. Fertility rates (number of births per thousand women) decline dramatically after age 30. Relative to women aged 25 to 29, births fall by 35 percent for women aged 30 to 34, and by 75 percent for women aged 35 to 39.37 To examine whether the expansions are an avenue to marriage, Column 5 of Table 6 examines women aged 30 and above, who are far less likely to enter the sample from having a child. This specification shows Medicaid increases the probability of marriage by 1.6 percentage points, somewhat less than the baseline specification. This estimate would suggest that roughly 10 percent of the effect that I attribute to marriage in the baseline specification could be due to increased childbearing. As a second check, Column 6 excludes infants. The results from this column show a smaller effect than the previous column, though the economic importance of Medicaid on marriage still remains. Extending Medicaid is now associated with an increase in the probability of marriage of 1.1 percentage points. Overall, these two columns suggest that previous results may be overstated because of selection into the sample through childbearing, but the conclusion that Medicaid encourages marriage still holds.
A final issue is that my main model does not include income, which I argue is endogenous. By excluding income, my study follows methods similar to other reduced-form studies that examine AFDC cash benefits (for example, Haynes 1993; Moffitt 1990, 1994). Although the effect of income on marriage is itself interesting, the fundamental issue in the context of the Medicaid expansions is whether the Medicaid variable is correlated with omitted income after including other covariates (such as state, year, and child's age dummies), therefore resulting in omitted variables bias. Although the income distributions of families with children who are eligible based on the STATE, TIME and YOUNGEST dimensions should be similar to families of children who are ineligible, it is important to address this concern directly.
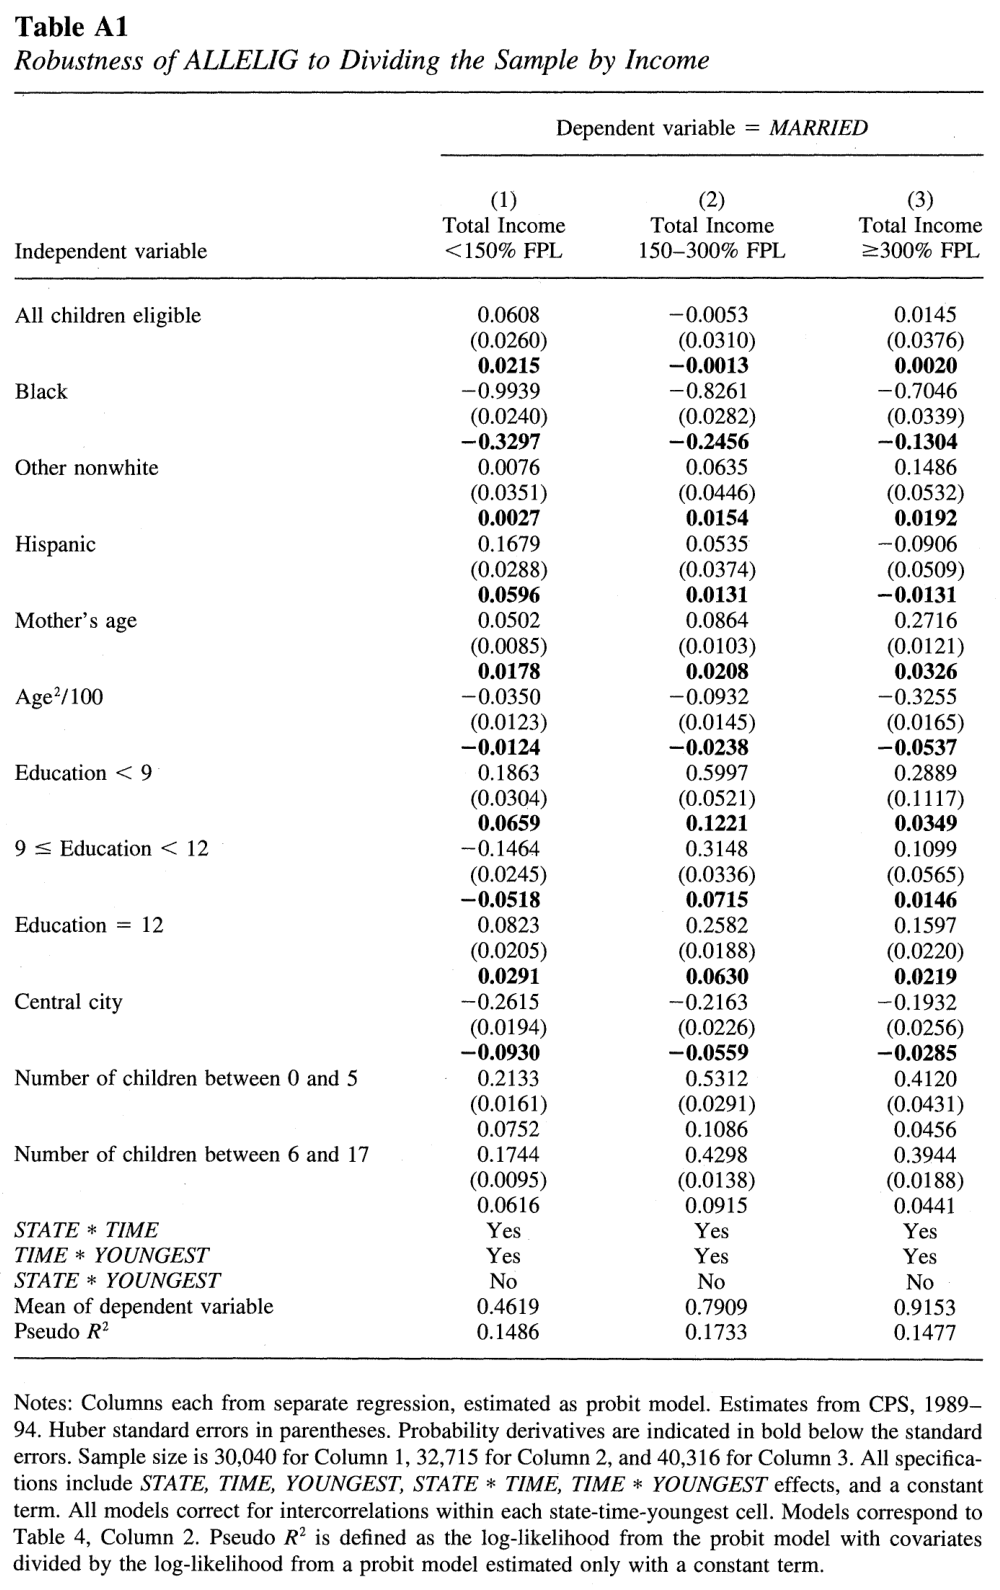
To check the sensitivity of the results to the omission of income, I reestimated the model separating mothers by total family income. The results are in Appendix Table 1 and correspond to the "baseline" model in Table 4, Column 2. I divided the sample into three groups, based on whether their total income was under 150 percent of the poverty line, between 150 and 300 percent, and greater than 300 percent. This is meant to be a specification check. The expansions should not have much effect on nonpoor individuals. This expectation is borne out in Columns 2 and 3-Medicaid eligibility has no effect on marriage. On the other hand, significant effects persist in Column 1, which includes women with total income less than 150 percent of the poverty line.
VI. Concluding Remarks
In this paper, I have attempted to fill a gap in the literature by examining the influence of Medicaid on marriage. This paper has shown that extending Medicaid to all children in a family has a strong impact on the marriage decision, a finding that stands in contrast to previous work on AFDC cash benefits. Using an exogenous source of variation to the mother's budget set and a large, representative sample, I estimate that extending Medicaid to all children in a family increases the probability of marriage by 1.7 percentage points. This finding is robust to the inclusion of state dummies. The magnitude of Medicaid also changes in sensible ways when the model addresses concerns about private health insurance and selection bias from changes in a mother's fertility. The estimates strongly show nonlinear effects of Medicaid coverage. The impact on marriage is concentrated in covering the last child in a household.
Previous work finds smaller effects of cash benefits on the female headship. Why does Medicaid matter while cash does not? There are several ways in which these findings can be reconciled. First, the potential husband may be less able to substitute employer-provided health insurance for Medicaid than wages for AFDC cash benefits. Second, the effect of welfare benefits on the decision to marry and the decision to divorce may be asymmetric. If negative connotations are associated with the latter, through some kind of "divorce stigma," then welfare benefits may not have as much impact. Third, Medicaid may be more highly valued than a small cash grant. Medicaid is kept in its entirety when on AFDC, whereas cash benefits are taxed away. Finally, if the stigma associated with Medicaid participation is smaller than the stigma associated with AFDC participation, then changing Medicaid policy could lead to greater responsiveness than changing AFDC policy.
There are two directions that extensions to this study could go. The most important limitation of the current study is that the estimates rely on cross-sectional data. Longitudinal data such as the Survey of Income and Program Participation (SIPP) could permit direct investigation of marital decisions. The CPS results necessarily combine decisions to marry with decisions to divorce to estimate the effect on marital status, although the SIPP could (in principle) separate these out. The tradeoff, of course, is that using longitudinal data would result in a smaller sample size. A second limitation that could be addressed in future work is a more complete model of the income and marital status decisions. The key difficulty of such a study would be in finding credible instruments for income.
Appendix 1
Recent Legislative Changes in MedicaidOmnibus Budget Reconciliation Act, 1986: Permitted states to extend Medicaid coverage to children under age two with incomes below 100 percent of the federal poverty line effective April 1987. Beginning July 1988, states could increase the age level by one in each fiscal year until all children under age five were included.
Omnibus Budget Reconciliation Act, 1987: Effective July 1988, states could immediately cover children under age five (rather than phasing-in coverage) who were born after September 1983. Effective October 1988, states could expand coverage to children under age eight. Allowed states to extend Medicaid eligibility for infants up to 185 percent of the federal poverty level.
Medicare Catastrophic Coverage Act, 1988: Required states to cover infants on a phased-in schedule: to 75 percent of the federal poverty level, effective July 1989, and to 100 percent, effective July 1990. Family Support Act, 1988: Effective April 1990, required states to continue Medicaid coverage for 12 months for families who received AFDC in three of the previous six months, but became ineligible for assistance because of increased earnings. Families whose incomes exceeded 185 percent of the federal poverty level would not qualify. Families with incomes between 100 and 185 percent of the poverty guidelines could be charged a premium during the second six months.
Omnibus Budget Reconciliation Act, 1989: Required states to extend Medicaid coverage to all children under age 6 with family incomes up to 133 percent of the federal poverty level. Effective April 1990. Omnibus Budget Reconciliation Act, 1990: Starting July 1991, states are required to cover all children under age 19, who were born after September 1983, to 100 percent of the FPL.
Table A1. Robustness of ALLELIG to Dividing the Sample by Income
Blank, Rebecca. 1989. "The Effect of Medical Need and Medicaid on AFDC Participation." Journal of Human Resources 24(1):54-87.
Cain, Glen, and Douglas Wissoker. 1990. "A Reanalysis of Marital Stability in the Seattle-Denver Income-Maintenance Experiment." American Journal of Sociology 95(5): 1235-69.
Currie, Janet, and Jonathan Gruber. 1996a. "Health Insurance Eligibility, Utilization of Medical Care, and Child Health." Quarterly Journal of Economics 111(2):431-66.
---. 1996b. "Saving Babies: The Efficacy and Cost of Recent Changes in the Medicaid Eligibility of Pregnant Women." Journal of Political Economy 104(6):1263-96.
Cutler, David, and Jonathan Gruber. 1996. "Does Public Insurance Crowd Out Private Insurance?" Quarterly Journal of Economics 111(2):391-430.
Danziger, Sheldon, George Jakubson, Saul Schwartz, and Eugene Smolensky. 1982. "Work and Welfare as Determinants of Female Poverty and Household Headship." Quarterly Journal of Economics 97(3):519-34.
Decker, Sandra. 1995. "Medicaid, AFDC, and Female Headship." Mimeo, New York University.
Duncan, Greg, and Saul Hoffman. 1990. "Welfare Benefits, Economic Opportunities, and Out-of-Wedlock Births among Black Teenage Girls." Demography 27(4):519-35.
Ellwood, David, and Mary Jo Bane. 1985. "The Impact of AFDC on Family Structure and Living Arrangements." In Research in Labor Economics, Vol. 7, ed. R. Ehrenberg, pp. 137-207. Greenwich, Conn.: JAI Press.
Groeneveld, Leonard, Michael Hannan, and Nancy Tuma. 1980. "The Effects of Negative Income Tax Programs on Marital Dissolution." Journal of Human Resources 15(4): 654-74.
Hannan, Michael, and Nancy Tuma. 1990. "A Reassessment of the Effect of Income Maintenance on Marital Dissolution in the Seattle-Denver Experiment." American Journal of Sociology 95(5): 1270-98.
Hoffman, Saul, and Greg Duncan. 1988. "A Comparison of Choice-Based Multinomial and Nested Logit Models: The Family Structure and Welfare Use Decisions of Divorced or Separated Women." Journal of Human Resources 23(4):550-62.
Hoynes, Hilary. 1993. "Female Headship and AFDC Benefits: State Effects or Welfare Effects?" Mimeo, University of California, Berkeley.
---. 1996. "Welfare Transfers in Two Parent Families: Labor Supply and Welfare Participation Under AFDC-UP." Econometrica 64(2):295-332.
Hutchens, Robert, George Jakubson, and Saul Schwartz. 1989. "AFDC and the Formation of Subfamilies." Journal of Human Resources 24(4):599-628.
Intergovernmental Health Policy Project. 1987-91. "Major Changes in State Medicaid and Indigent Care Programs," ed. Debra J. Lipson, Rhona S. Fisher, and Constance Thomas. Washington, D.C.: The George Washington University.
Lundberg, Shelly, and Robert Plotnick. 1995. "Adolescent Premarital Childbearing: Do Economic Incentives Matter?" Journal of Labor Economics 13(2):177-200.
Moffitt, Robert. 1990. "The Effect of the U.S. Welfare System on Marital Status." Journal of Public Economics 41(1):101-24.
---. 1992. "Incentive Effects of the U.S. Welfare System: A Review." Journal of Economic Literature 30(1):1-61.
---. 1994. "Welfare Effects on Female Headship with Area Effects." Journal of Human Resources 29(2):621-36.
Moffitt, Robert, Robert Reville, and Anne Winkler. 1994. "State AFDC Rules Regarding the Treatment of Cohabitors: 1993." Social Security Bulletin 57(4):26-33.
---. 1995. "State AFDC Rules Regarding the Treatment of Cohabitors: 1993." IRP Discussion Paper, 1058.
Moffitt, Robert, and Barbara Wolfe. 1992. "The Effect of the Medicaid Program on Welfare Participation and Labor Supply." Review of Economics and Statistics 74(4):615-26.
Moulton, Brent. 1986. "Random Group Effects and the Precision of Regression Estimates." Journal of Econometrics 32(3):385-97.
Plotnick, Robert. 1983. "Turnover in the AFDC Population: An Event History Analysis." Journal of Human Resources 18(1):65-81.
---. 1990. "Welfare and Out-of-Wedlock Childbearing: Evidence from the 1980s." Journal of Marriage and the Family 52(August):735-46.
Scholz, John Karl. 1994. "Tax Policy and the Working Poor: The Earned Income Tax Credit." Focus 15(3):1-12.
Schultz, T. Paul. 1994. "Marital Status and Fertility in the United States: Welfare and Labor Market Effects." Journal of Human Resources 29(2):637-69.
Shore-Sheppard, Lara. 1995. "Stemming the Tide? The Effect of Expanding Medicaid Eligibility on Health Insurance Coverage." Mimeo, Princeton University.
U.S. Department of Health and Human Services. 1988. Vital Statistics of the United States: Natality. Washington, D.C.: GPO.
U.S. House of Representatives. 1993. Medicaid Source Book: Background Data and Analysis (A 1993 Update). Washington D.C.: GPO.
---. Various years. Background Materials and Data on Programs Within the Jurisdiction of the Committee on Ways and Means. Washington D.C.: GPO.
Walker, James. 1994, "Migration Among Low-Income Households: Helping the Witch Doctors Reach Consensus." IRP Discussion Paper, 1031.
Winkler, Anne. 1991. "The Incentive Effect of Medicaid on Women's Labor Supply." Journal of Human Resources 26(2):308-37.
---. 1995. "Does AFDC-UP Encourage Two-Parent Families?" Journal of Policy Analysis and Management 14(1):4-24.
Yelowitz, Aaron. 1994. "Is Health Insurance Coverage a Pro-natal Policy?" Mimeo, University of California, Los Angeles.
---. 1995. "The Medicaid Notch, Labor Supply and Welfare Participation: Evidence from Eligibility Expansions." Quarterly Journal of Economics 110(4):909-39.
1. Traditionally, eligibility for Medicaid has been contingent on eligibility for Aid to Families with Dependent Children (AFDC); that is, one simultaneously qualifies for Medicaid and AFDC by having net income under a state's income eligibility limit. The health insurance is retained as long as the AFDC recipient earns less than the "AFDC break-even level," the point at which AFDC eligibility is lost. Medicaid is entirely lost once earned income goes beyond the break-even level, generating a marginal tax rate in excess of 100 percent.
2. Between fiscal years 1989 and 1991, medical prices rose by 8.4 percent per year, about 71 percent faster than general inflation. Medicaid payments per beneficiary grew by 8.2 percent per year between 1985 and 1991 (U.S. House of Representatives 1993).
3. Most notably, cash benefits under AFDC are restricted to single-parent families and families where one parent is not biologically related to the children. Two-parent families can qualify for AFDC-UP (unemployed parent). The Food Stamp program has no restrictions based on marital status or family structure.
4. Previous research has focused mainly on the effect of AFDC cash benefits on marital dissolution. For the most part, this work has found small but significant positive effects of AFDC benefits on female headship. See, for example, Danziger et al. (1982), Ellwood and Bane (1985), Moffitt (1990), Hoynes (1993), and Schultz (1994). Moffitt (1992) provides a summary of existing work.
5. Decker (1995), who examines the initial introduction of the Medicaid program in the 1960s, is a notable exception.
6. The income eligibility limit for AFDC varies depending on the recipient's work behavior. The limit is highest during the first four months of work, when the recipient faces a tax rate of 66 percent and a $30 monthly standard deduction. She faces a 100 percent tax rate and a $30 standard deduction for the next eight months. Finally, she faces a 100 percent tax rate and no standard deduction after twelve months of work. The limits in the text are calculated after twelve months of work while on AFDC. The variation in AFDC benefit levels has been used in previous work on family structure, including Ellwood and Bane (1985), Hutchens, Jakubson, and Schwartz (1989), Hoffman and Duncan (1988), and Duncan and Hoffman (1990). Several studies on family structure use the sum of the AFDC and Food Stamp guarantees, such as Plotnick (1983, 1990), and Lundberg and Plotnick (1995). Moffitt (1990, 1994) and Hoynes (1993) use the sum of the AFDC and food stamp guarantees along with the average Medicaid expenditure in each state.
7. As recent research has shown, eligibility for AFDC does not hinge on marriage per se (Winkler, 1995; Moffitt, Reville, and Winkler, 1994, 1995). Instead, children in stepparent families can qualify for AFDC too. Another way for two-parent families (in which both parents are biologically related to the child) to qualify for Medicaid is through AFDC-UP, where the principal wage earner has a substantial attachment to the labor force. AFDC-UP has very restrictive work criteria, however, and recent Medicaid expansions might eliminate any advantage to joining this program. Children in two-parent families may be eligible under either regime, but the expansions do not involve the same restrictive work criteria. See Hoynes ( 1996) for more discussion of the AFDC-UP program and Winkler ( 1995) for evidence of its effect on family structure. Because the CPS data do not have very fine living arrangement variables (namely, it is not possible to distinguish whether an unmarried man and woman are simply roommates or partners), this likely produces measurement error in my dependent variable. In addition, subfamilies (young mothers with children who live with their parents) also qualify for AFDC and are included in the analysis. See Hutchens, Jakubson, and Schwartz (1989) for more information on subfamilies. A final avenue onto Medicaid for two-parent families is through the Medically Needy program. This program is largely restricted to those who would otherwise qualify for AFDC except that their income is too high.
8. This assumes, of course, that Medicaid is valued at its average expenditure. Medicaid's cash value is computed only for the AFDC population. This calculation assumes it would be equally valued by nonparticipants.
9. In Illinois, average annual Medicaid expenditure per AFDC child was $717 in 1991 (U.S. House of Representatives 1993: 1664).
10. Currie and Gruber (1996b) examine the impact of related pregnancy expansions on prenatal care and infant health outcomes.
11. The Appendix provides a more detailed account of recent changes in the law.
12. Because the AFDC system taxes nonlabor income at 100 percent, I do not include it in Figure 1.
13. The analysis assumes Medicaid recipients do not pay for the cost of the policy change.
14. The hours threshold is identical when the woman is married or single because her market wage rate is assumed to be equal and the new Medicaid limit is the same.
15. The literature on negative income tax also discusses the "income effect." The idea is that income transfers help relieve financial difficulties and may therefore stabilize a shaky marriage-essentially income changes preferences. In the empirical work, I will not be able to distinguish between changes in preferences and changes in the budget constraint (in Figure 2), because I do not observe transitions to or from marriage in the CPS data. The parameter estimates should be thought of as a combination of the two effects. Because the "income effect" deals with outflows from marriage, while a change in the budget constraint deals with inflows to marriage, longitudinal data would be better suited for isolating these effects.
16. The variable MEDICAID% in Table 2 shows how the Medicaid limit varied across states and over time for infants. In some instances, this limit is less than the previous AFDC limit.
17. Cain and Wissoker (1990: 1239) offer a similar analysis about the impact of the Negative Income Tax.
18. I classify a woman as single if she is never-married, divorced, separated, or widowed. I restrict the sample to households with at most ten family members, because some of the data on a state's AFDC program provide information only for families of ten or fewer. This is a trivial exclusion, and I retain 99.94 percent of the sample. I also include households where the woman lives in a subfamily. I use only children under age 15 because I would need to worry about their family structure decisions after that age. In addition, Table 2 shows that older teenagers were not affected by the expansions until very late in the time frame. The conclusions remain identical by using a shorter time period.
19. The details of the law changes were taken from publications of the Intergovernmental Health Policy Project (1987-91). It is much more difficult to estimate how the value of Medicaid services affects marriage decisions than to estimate the effect of eligibility. Much of the variation in Medicaid services will be subsumed in the state fixed effect in the regression analysis.
20. Medicaid eligibility was evaluated as of December of the previous year. It was also necessary to impute a month and year of birth for each child, because the CPS asks only for the child's age as of March of the survey year. To impute these, I assigned a month in the year that the child could have been born based on a random draw from the empirical birth distribution of the data from the U.S. Department of Health and Human Services (1988). Because eligibility is also a function of birth year and birth month (not just child's age), I imputed eligibility this way because I did not want to systematically assign a particular birth month to all children in a birth cohort.
21. These indicators are clearly measured with error because I do not compute eligibility based on endogenous income. This measurement error likely biases the eligibility coefficient in my model toward zero, so the subsequent estimates may be viewed as lower bounds. Currie and Gruber (1996a) calculate changes in eligibility that use income. Using this measure, they find 31.2 percent of children were eligible for Medicaid in 1992.
22. I include dummy variables for different levels of educational attainment because the CPS changed its education variable in the middle of the sample. The classifications are: Less than high school, some high school, completed high school, and any college.
23. Although state of residence could be endogenous because of welfare-induced migration, Walker (1994) finds no empirical evidence for this.
24. The ELIG variables use variation by STATE, TIME, YOUNGEST, STATE * TIME, TIME * YOUNGEST, STATE * YOUNGEST, and . In a linear model, including the main effects (STATE, TIME, and YOUNGEST) corresponds to the "differences-in-differences" estimator. Including all second-order interactions corresponds to the "differences-in-differences-in-differences" estimator. The correspondence between "differences-in-differences" estimators and the inclusion of dummy variables disappears for nonlinear models, however.
25. I have estimated the models separately for whites and African Americans, because marriage markets may look very different for these groups. In both cases, the results are similar to those reported for the pooled sample. In particular, the model that includes interactions (Table 4, Column 2) yielded the following results: For whites the coefficient on was 0.0597 (standard error of 0.0178) and the probability derivative was 0.0155; for African Americans the coefficient was 0.0420 (standard error of 0.0419) and the probability derivative was 0.0143. Because the coefficient estimates were quite similar, I pooled the sample. It is also possible, however, that African Americans simply respond differently to Medicaid policy changes. The CPS sample size limits my ability to make strong inferences on subgroups.
26. Moulton ( 1986) shows that ignoring these correlations may lead to the standard errors being substantially understated.
27. The probability derivatives were calculated as follows. If a variable was binary, each individual's probability of marriage was calculated with the variable first equal to one and then equal to zero. The difference between these predicted probabilities was then averaged across the entire sample. For continuous variables (mother's age, age squared, and number of children), the probability of marriage was calculated at the original value and that value plus one. The difference was again averaged across the entire sample.
28. In alternate specifications, I have included the AFDC benefit for a family of four (in 1988 dollars). It should not be surprising that when both state and time effects are included, the AFDC benefit is extremely imprecisely estimated, because the impact of cash benefits on marriage is identified through changes in the guarantee within a state over time. Moffitt (1994) also finds that the correlation between female headship and real welfare benefits becomes much weaker when state-fixed effects are included. None of the conclusions about the Medicaid policy variables change by including the AFDC benefit variable, however.
29. For the 26 states that I exclude, the number of observations in each state-time-youngest age cell averaged fewer than 14 observations, making it too difficult to precisely estimate Medicaid's effect.
30. In addition to these eligibility measures, I have constructed a family-specific ''value'' of the Medicaid expansion, using the average Medicaid expenditure in the state per AFDC child and using the average health care expenditure per child from the 1987 National Medical Expenditure Survey. These two measures vary within a given state at a point in time because different families have different numbers of eligible children from the Medicaid expansions. I encountered some of the same difficulties that Blank ( 1989) and Winkler (1991) had, namely that the average expenditure in Medicaid is severely measured with error, which likely biases the coefficient estimates toward zero. In all specifications, the values had a positive effect on becoming married but were always insignificant. Because the CPS does not have good health measures, I was not able to construct an individual "value" along the lines of Moffitt and Wolfe (1992).
31. See Cain and Wissoker ( 1990) and Hannan and Tuma ( 1990) for pertinent discussions.
32. I selected the nine states (excluding Alaska and Hawaii) that had an AFDC benefit of at least $500 per month for a family of three in January 1988 (U.S. House of Representatives 1988: 416-17). These states were California, Connecticut, Massachusetts, Michigan, Minnesota, New York, Rhode Island, Vermont, and Wisconsin. I also selected nine low-benefit states that had an AFDC benefit of less than $250. These were Alabama, Arkansas, Kentucky, Louisiana, Mississippi, South Carolina, Tennessee, Texas, and West Virginia. After the appropriate institutional detail is accounted for, such as the "30 and 1/3 disregard," childcare expenses, and work expenses, the AFDC limit can exceed the new Medicaid limit. Yelowitz (1995) discusses this further.
33. The extent to which Medicaid is a substitute for other forms of coverage is controversial. Cutler and Gruber ( 1996) find significant crowd-out effects of public insurance, but Shore-Sheppard ( 1995) does not.
34. Private health insurance coverage is derived from the CPS question "Was ... covered by private health insurance plan?"
35. Schultz (1994) examines the interrelationship between marriage, fertility, and welfare benefits. He finds that both AFDC and Medicaid have negative effects that are sometimes statistically significant. However, in quantitative terms, there appears to be little effect of welfare on either marriage propensities or fertility. Yelowitz (1994) also examines Medicaid and fertility and finds extremely weak effects.
36. The effect of childbearing will not necessarily bias the coefficient on marriage upward, however. If a newly eligible single woman responds to the Medicaid expansions by having her first child, the coefficient would be biased downward.
37. Although the distribution of a mother's age based on when her first child was born is more appropriate (because having a child is a qualifying characteristic), I was not able to locate such data.