# Health insurance generosity and conditional coverage: Evidence from Medicaid managed care in Kentucky

**Authors:** James Marton and Aaron Yelowitz  
**Citation:** James Marton and Aaron Yelowitz (2015). Health insurance generosity and conditional coverage: Evidence from Medicaid managed care in Kentucky. Southern Economic Journal 82(2): 535–555. DOI: 10.1002/soej.12064.

© 2015 by the Southern Economic Association. Received May 2014; accepted October 2014.  
**JEL classification:** I18, I38, J13


**Affiliations:** James Marton — Department of Economics, P.O. Box 3992, Georgia State University, Atlanta, GA 30302-3992, USA; E-mail marton@gsu.edu. Aaron Yelowitz — Department of Economics, University of Kentucky, 335 Business and Economics Building, Lexington, KY 40506-0034; E-mail aaron@uky.edu; corresponding author.  
**Corresponding author:** Aaron Yelowitz (aaron@uky.edu)  

## Abstract

This article estimates the impact of the introduction of Medicaid managed care (MMC) on the formal Medicaid participation of children. We employ a quasi-experimental approach exploiting the location-specific timing of MMC implementation in Kentucky. Using data from the March Current Population Survey from 1995 to 2003, our findings suggest that the introduction of MMC increases the likelihood of being uninsured and decreases formal Medicaid participation. This finding is consistent with an increase in “conditional coverage,” waiting until medical care is needed to sign up or re-enroll in Medicaid. These effects are concentrated among low-income children and absent for high-income children. We find no evidence of “crowd-in,” substituting private coverage for Medicaid. These results are robust to multiple placebo tests and imply the potential for less formal participation (i.e., more conditional coverage) among the Affordable Care Act-Medicaid expansion population (which is likely to be primarily covered under MMC) than is typically predicted.

## 1. Introduction

The Affordable Care Act (ACA) seeks to expand health insurance coverage in the United States through a combination of mandates, insurance exchanges, subsidies, and expansions in Medicaid coverage. Despite large federal subsidies, states that opted to expand their Medicaid program are being confronted with the challenge of increasing access while at the same time controlling costs.<sup><a href="#source-note-1" aria-label="Source note 1">1</a></sup> Many states have turned to managed care as a means to expand access, control costs, and improve health outcomes among their Medicaid populations. One problem associated with such a strategy is that current or potential enrollees may not participate due to the view that Medicaid managed care (MMC) coverage is less attractive and/or generous than traditional fee-for-service (FFS) Medicaid coverage (Davis et al. 1995; Bergman and Homer 1998). Thus, managed care has the potential to undermine the effectiveness of state Medicaid expansions in terms of reducing the number of uninsured.

In theory, the ACA individual coverage mandate should address any problems associated with Medicaid participation. However, in practice it is not clear how binding the mandate will be. After the full ACA phase-in (2016 and beyond), the penalty is not particularly large; it is the greater of $695 per adult ($347.50 per child) or 2.5% of family income. Of particular importance to the Medicaid population, individuals are exempt from the mandate if they would be forced to pay more than 8% of their income for health insurance or if their family income is below the threshold for filing a federal tax return. Although Massachusetts implemented an individual coverage mandate as part of its 2006 state insurance reform, the rate of nonparticipation in the insurance market and the noncoverage rate were not driven to zero.

Another reason why eligible individuals might choose to not actively take up MMC is the “conditional coverage” phenomenon. This phrase was introduced in the seminal Cutler and Gruber (1996) study of Medicaid crowd-out of private health insurance coverage. Although individuals who delay signing up for health insurance coverage until they get sick will appear to be uninsured in most data sets, Cutler and Gruber (1997) count conditional coverage as a form of insurance.

Despite the fact that there is a large literature describing the impact of MMC on utilization, expenditures, and health outcomes, to date there has been very little work evaluating the relationship between MMC and the formal participation decision of Medicaid enrollees. In this article, we address this gap by estimating the impact of the introduction of MMC on the formal Medicaid participation of children. In particular, we differentiate between Medicaid coverage, private coverage, and being uninsured. This allows us to explicitly examine changes in conditional coverage.

For example, if MMC leads to reductions in Medicaid coverage, increases in uninsured rates, and no change in private coverage, that would be consistent with an increase in conditional Medicaid coverage.

We identify the impact of MMC using a quasi-experimental approach that exploits the timing and locality-specific implementation of MMC in Kentucky in the late 1990s. The Medicaid program in Kentucky changed from a FFS system to managed care in two geographically distinct subsets of counties anchored by the state's two largest cities, Louisville and Lexington. Using data from the Current Population Survey (CPS) from 1995 to 2003, we compare Medicaid participation rates in the “treated” Louisville and Lexington metropolitan statistical areas (MSAs), along with the “partially treated” rural part of Kentucky, to the Northern Kentucky MSA before and after the reform.

Our findings suggest that the introduction of MMC increases the likelihood of being uninsured and decreases formal Medicaid participation. This effect is concentrated among low income children (below 300% of the federal poverty level [FPL]) and absent for high income children. We find no evidence of substitution from Medicaid to private insurance plans as the value of Medicaid falls, which might be thought of as “crowd-in.” This is consistent with an increase in conditional Medicaid coverage. We also stratify by health status and find that the decrease in formal Medicaid participation is concentrated among children that report relatively poor health. These results are robust to multiple placebo tests and imply the potential for less formal participation (i.e., more
conditional coverage) among the ACA Medicaid expansion population (which is likely to be primarily covered under MMC) than is typically predicted.

Although our specific analysis focuses on the impact of MMC on Medicaid participation, there are more general concerns about participation and conditional coverage associated with the entire ACA. Feldstein (2013) describes the potential for a “fatal flaw” in which the ACA reforms to the insurance market regarding pre-existing health conditions and community rating, along with a relatively low cost of nonparticipation, “will encourage those who are not ill to become or remain uninsured until they have a potentially costly medical diagnosis.” Our results potentially suggest that such concerns regarding the shift from formal to conditional coverage may be well-founded.


## 2. Literature Review
There are two primary strands of literature that we contribute to in this article. The first involves estimating the impact of the introduction of managed care into state Medicaid programs. These articles largely focus on the intensive margin of medical care utilization and the associated health outcomes. The articles with the most credible identification strategies in this literature tend to focus on an individual state and often consider the impact of MMC on newborns or children. The second strand of literature deals with policies, including MMC, that impact the extensive margin of Medicaid participation and the associated issue of conditional coverage.
### MMC and the Intensive Margin: Utilization and Health Outcomes
Several articles have used state administrative data to examine the impact of the wave of MMC expansions that occurred in 1990s.<sup><a href="#source-note-2" aria-label="Source note 2">2</a></sup> Like this article, Marton, Yelowitz, and Talbert (2014) focus on the introduction of MMC in Kentucky. Using state administrative Medicaid data, they also use a quasi-experimental research design. They find that MMC leads to significant reductions in outpatient and professional utilization and costs among children, with no change in inpatient utilization. Unlike most of the literature, they include all Medicaid children in their sample, rather than focusing on newborns.

Aizer, Currie, and Moretti (2007) use a mother fixed-effects approach to compare birth outcomes among Medicaid mothers in California that were paid via FFS with those that were paid via managed care. They also describe several other studies that exploit the timing and county-specific implementation of MMC in California and conclude that: “Taken as a whole, these studies suggest that the switch to MMC increased costs, reduced access to care, and worsened infant health outcomes in California.”<sup><a href="#source-note-3" aria-label="Source note 3">3</a></sup>
### Medicaid Policy and the Extensive Margin: Participation and Conditional Coverage
Cutler and Gruber (1996) introduced the phrase “conditional coverage” in their seminal study of the coverage impact of the expansions of Medicaid to pregnant women and children between 1987 and 1992. As they say, “ Many people are “conditionally covered” for Medicaid: they remain uninsured until they become ill (children) or pregnant (women), and then sign up for coverage. These people are officially counted as uninsured but in fact have some conditional insurance through the public sector.” After using a back of the envelope calculation to factor in this form of coverage, they found that approximately 50% of the increase in Medicaid coverage driven by the expansion was associated with a reduction in private coverage.


Rather than looking at the enrollment impact of expanding Medicaid eligibility, Aizer (2007) considers increases in participation among children that are already Medicaid eligible. She does this by evaluating the extent to which increased Medicaid enrollment outreach in California in the late 1990s led to increases in formal Medicaid participation among eligible but nonparticipating children. Outreach increases such as this can be thought of as lowering the costs associated with Medicaid participation, by educating potential enrollees about the existence of the program, their potential eligibility, and the application process. The outreach increase was estimated to be responsible for a 15% increase in Medicaid enrollment, though the extent to which this lowers conditional coverage is unclear because there was no information in the
Medicaid administrative data on whether the child was previously enrolled in private coverage or uninsured.

Currie and Fahr (2005) consider the impact of MMC on Medicaid participation on a national level using data from the National Health Interview Survey. MMC can be thought of as implicitly reducing the benefits associated with Medicaid participation by implementing more stringent managed care practices such as referrals and more tightly managed provider networks.

They find that MMC leads to reductions in Medicaid participation, with differences in magnitude and significance that vary by child demographic category. As was the case with Aizer (2007), it is difficult here to assess the extent to which this translates into increases in conditional coverage because the authors do not distinguish between those with private coverage and those that are uninsured when not participating in Medicaid. Unlike Aizer (2007) and Currie and Fahr (2005), our use of the CPS allows us to differentiate between formal Medicaid participation among children, private insurance coverage, and the decision to remain uninsured/conditionally covered by Medicaid.

More closely related to our work, Aizer, Currie, and Moretti (2007) consider the impact of MMC on the Medicaid participation of a specific subpopulation on potential enrollees, pregnant women, in a single state. As mentioned above, they use a mother fixed-effect approach to compare birth outcomes among Medicaid mothers in California before and after the switch to managed care. Because they have data on all births within the state, they can also estimate the extent to which MMC led to changes in the probability that a birth was paid for via Medicaid or via private health insurance (almost no women were uninsured at delivery). They find that in the counties that introduced MMC with two plan options, women were 3% less likely
to have their delivery paid via Medicaid and 3% more likely to have their delivery paid via private coverage. This result is suggestive of some degree of distaste for MMC resulting in some “crowd-in” to private coverage.

Because the California birth record data only records Medicaid participation at the time of the pregnancy delivery, it is not ideally suited to evaluate conditional coverage. Knowledge of the woman's prior Medicaid participation and other forms of coverage are needed, but this is complicated by the fact that women that are not pregnant face different Medicaid eligibility criteria than pregnant women. Our approach of using the CPS to focus on the insurance status of low-income children over the course of a year allows for analysis that is not tied to a specific service or medical event. We might expect that over the course of a year, many eligible children do not formally participate in Medicaid and that this decision may be impacted by the shift from FFS to managed care. Marton, Yelowitz, and Talbert (2014) use Medicaid administrative data to focus on the impact of the introduction of MMC in Kentucky along the intensive margin without considering changes in Medicaid participation. As was mentioned in the context of Aizer (2007), Medicaid administrative data are not well suited to investigate changes in formal Medicaid participation and conditional coverage. This article compliments Marton, Yelowitz, and Talbert (2014), as a complete description of the impact of MMC would encompass changes along both the intensive and extensive margin.


## 3. Background
In this section, we start by briefly describing the timing and region-specific implementation of MMC in Kentucky. We then discuss potential implicit differences in insurance generosity between MMC coverage and traditional FFS Medicaid coverage.
### MMC in Kentucky

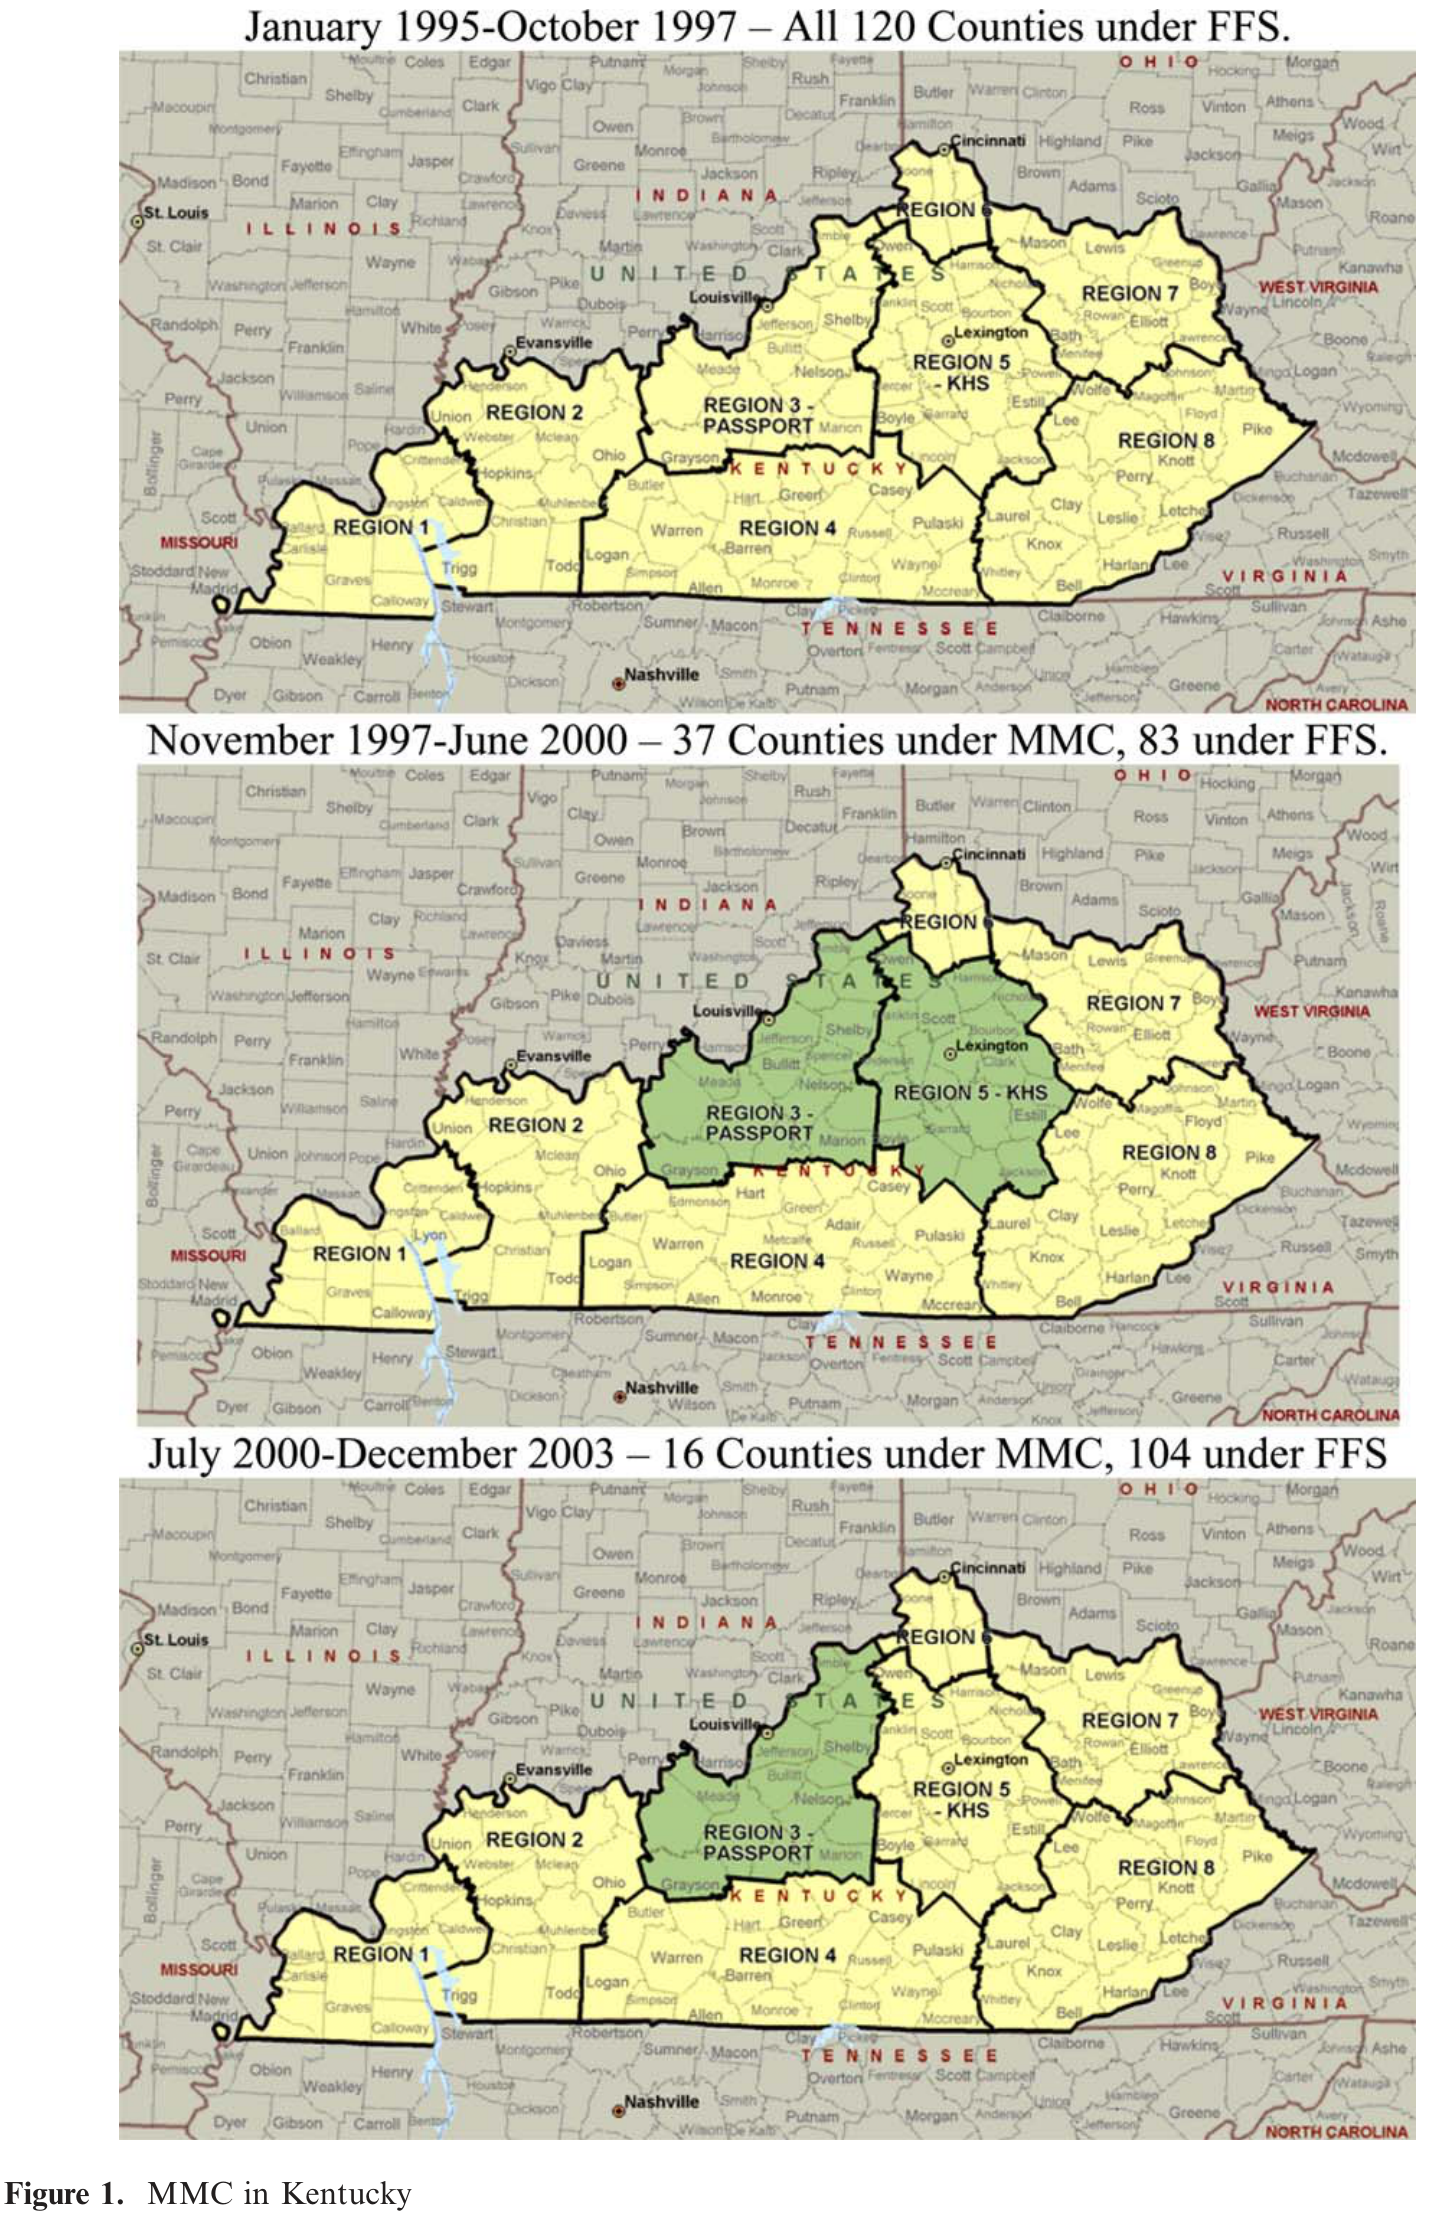
Kentucky, like several other states, received Centers for Medicare and Medicaid approval in the mid to late 1990s to transition its Medicaid population from FFS reimbursement to managed care in an attempt to improve access and quality of care and stabilize cost growth.<sup><a href="#source-note-4" aria-label="Source note 4">4</a></sup> Kentucky’s plan, which was approved in October 1995, involved establishing eight regional managed care networks across the state. Figure 1 illustrates these regions in the first panel. The provision of Medicaid services within each region were intended to be managed by newly formed partnerships of local providers, rather than existing commercial managed care organizations.

Mandatory MMC enrollment began in the two regions that contain the state's two largest cities, Louisville (region 3) and Lexington (region 5), in November 1997 (see second panel of Figure 1). The Louisville plan was named the Passport Health Plan (Passport) and the Lexington plan was named the Kentucky Health Select Plan (KHS). The plans were anchored by the local University hospital systems within each region. Perhaps in part due to a lack of such hospital systems, the other six regions were not able to create local managed care plans and the Medicaid recipients in these regions remained in FFS coverage. In July 2000, the Lexington plan went out of business, leaving all Medicaid recipients outside of region 3 in FFS coverage until late 2011 (see third
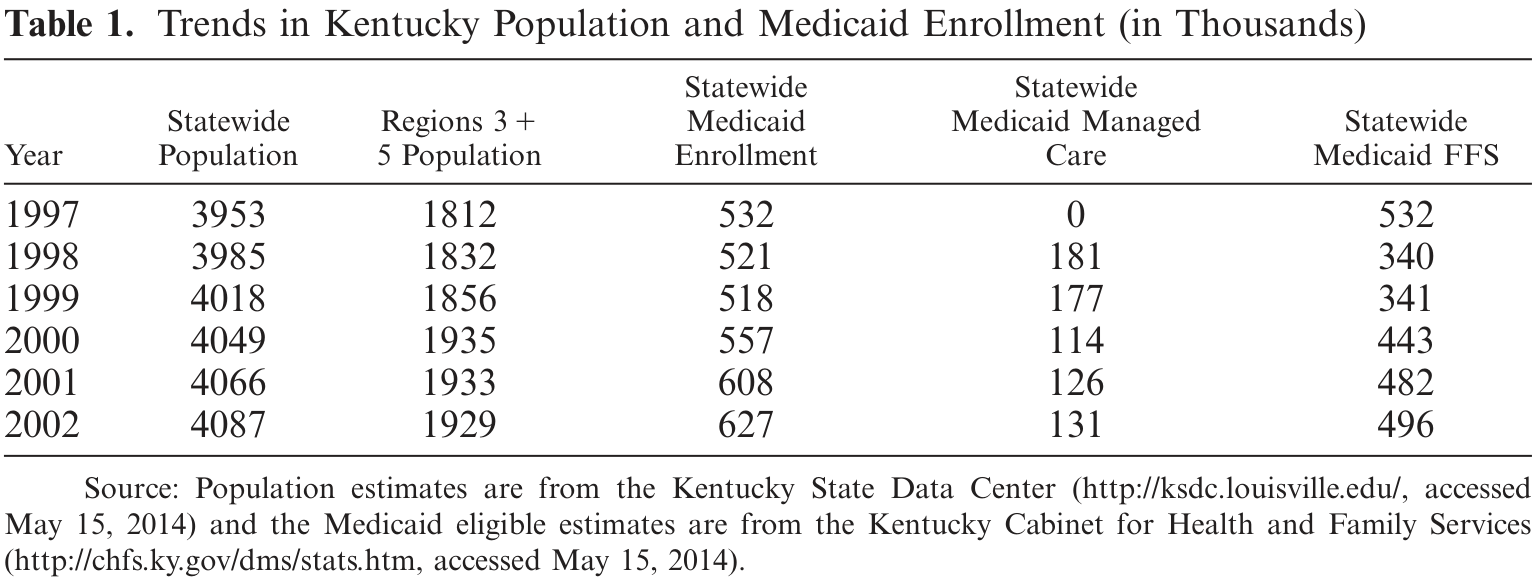
panel of Figure 1). Table 1 illustrates that the impacted regions account for almost half of the state’s total population and approximately 35% of the state’s Medicaid population. Thus, this reform can be characterized as relatively abrupt, far reaching, and mandatory.

A careful comparison of this description of the Kentucky experience with MMC and that given in Currie and Fahr (2005) suggests some potential managed care classification issues. They rely on reports from the Health Care Financing Administration (HCFA) that classify MMC enrollment in Kentucky as over 50% in 1992, 1993, and 1994. This can be explained by a primary care case management program in Kentucky Medicaid known as KENPAC that was introduced statewide prior the plans described above. While all Medicaid recipients were assigned a primary care “gatekeeper” physician through the KENPAC program, we do not view this feature alone as enough to characterize a plan as being truly “managed care” and categorize KENPAC participants as having FFS Medicaid coverage.


### Figure 1. MMC in Kentucky

<figure class="article-figure" id="figure-1"><a href="/files/publications/ay-ja-xfwzrizrrkkr2yew-assets/figure-1.png"><img alt="Figure 1. Kentucky Medicaid managed-care regions in 1995–1997, 1997–2000 and 2000–2003, showing fee-for-service areas and changes in Passport and KHS coverage." height="2216" loading="lazy" src="/files/publications/ay-ja-xfwzrizrrkkr2yew-assets/figure-1.png" width="1436"/></a><figcaption>Figure 1. <a href="/files/publications/ay-ja-xfwzrizrrkkr2yew-assets/figure-1.png">Open full-resolution image</a>.</figcaption></figure>


### Table 1. Trends in Kentucky Population and Medicaid Enrollment (in Thousands)

<figure class="article-figure" id="table-1"><a href="/files/publications/ay-ja-xfwzrizrrkkr2yew-assets/table-1.png"><img alt="Table 1. Kentucky population and Medicaid enrollment in thousands for 1997–2002, separating managed care and fee-for-service." height="584" loading="lazy" src="/files/publications/ay-ja-xfwzrizrrkkr2yew-assets/table-1.png" width="1540"/></a><figcaption>Table 1. <a href="/files/publications/ay-ja-xfwzrizrrkkr2yew-assets/table-1.png">Open full-resolution image</a>.</figcaption></figure>


### MMC and FFS Insurance Generosity
There are many ways in which managed care coverage can be viewed to be less generous than traditional FFS coverage. One of the primary mechanisms is through changes in provider reimbursement. Managed care plans often capitate payments to providers, reducing the marginal revenue associated with providing additional services to zero. This was done in the Kentucky MMC setting in a macro sense, as the state negotiated capitated rates with each plan for different categories of Medicaid enrollees. The details of this negotiation process are described in Bartosch and Haber (2004). Each plan then selected different reimbursement mechanisms for different types of individual providers, such as hospitals and group practices. A second mechanism is through active review of member physician decisions in
order to reduce expenditures on low value services. Both Kentucky plans established protocols for such reviews.

Managed care plans also often restrict provider networks in order to increase coordination among member physicians. However, Marton, Yelowitz, and Talbert (2014) did not find large reductions in provider participation in Kentucky Medicaid after the advent of MMC. Managed care plans typically use referrals for specialist care in order to ensure enrollees are not seeking specialty care when primary care is sufficient to address their needs. Such a system was not enforced in the KENPAC program mentioned above, which highlights the difference between that program and the MMC plans described here. According to Bartosch and Haber (2004), each plan implemented utilization controls for prescriptions after their first year of operation, which included prior authorizations for certain drugs, a focus on fraud and
abuse, and increased dialog with member physicians about prescribing practices.

Taken as a whole, these programmatic changes are meant to improve health outcomes while at the same time reducing overall utilization and health care spending. Several studies have examined the impact of managed care on health outcomes and perceived quality. Bergman and Homer (1998) suggest that children in managed care arrangements are less likely to have access to pediatric specialists and that families are less satisfied with the care their child is receiving. Echoing these results, Davis et al. (1995) summarize the results of a 1994 Commonwealth Fund survey in which low-income managed care enrollees reported high rates of involuntary plan changing, limited choice of physicians, and low levels of satisfaction. As mentioned in the previous section, several studies have found that the introduction of MMC in California led to increased costs and worse infant health outcomes. All of this evidence suggests that managed care coverage can be viewed as less generous than traditional FFS coverage.


## 4. Conceptual Model
Our conceptual model allows for three different insurance outcomes for children. These outcomes are defined as follows:

- *Formal Medicaid Participation:* This will occur when the family values the benefits of FFS (<math xmlns="http://www.w3.org/1998/Math/MathML" display="inline"><mrow><msub><mrow><mi mathvariant="normal">B</mi><mi mathvariant="normal">E</mi><mi mathvariant="normal">N</mi></mrow><mrow><mrow><mi mathvariant="normal">F</mi><mi mathvariant="normal">F</mi><mi mathvariant="normal">S</mi></mrow></mrow></msub></mrow></math>) or MMC (<math xmlns="http://www.w3.org/1998/Math/MathML" display="inline"><mrow><msub><mrow><mi mathvariant="normal">B</mi><mi mathvariant="normal">E</mi><mi mathvariant="normal">N</mi></mrow><mrow><mrow><mi mathvariant="normal">M</mi><mi mathvariant="normal">M</mi><mi mathvariant="normal">C</mi></mrow></mrow></msub></mrow></math>) more than the transaction costs (<math xmlns="http://www.w3.org/1998/Math/MathML" display="inline"><mrow><mi>C</mi></mrow></math>) of getting onto the program, and more than the net benefit of private coverage.
- *Private Insurance Coverage:* This will occur when the net benefit of private coverage is positive and exceeds the net benefit of Medicaid.
- *Uninsured/Conditional Coverage:* This will occur when the net benefits of formal Medicaid participation and private insurance coverage are negative.

This is motivated by the Cutler and Gruber (1996) adoption of the Peltzman (1973) framework to examine the issue of crowd-out of private health insurance with the expansion of Medicaid. Their primary prediction is that as the value of public coverage rises (falls), then individuals will be more likely to drop private insurance (Medicaid) and enroll in Medicaid (private insurance). Their hypothesis is directly testable in our setting, because we argued in the previous section that FFS represents more valuable coverage than MMC. To the extent that crowd-out is important, children should shift from Medicaid to private coverage with the implementation of MMC.

It is difficult to reconcile having an eligible child remain uninsured when a free public health insurance option is available, however. As Currie and Fahr (2005) note, the take-up rates among individuals newly eligible for Medicaid is far from 100%. Aizer (2003) notes that nearly half of the 1.8 million uninsured children in California are eligible for Medicaid but not enrolled. In the context of Medicaid expansions, low take-up rates for Medicaid may suggest high transaction costs, lack of program awareness, or stigma from participation. By holding these costs constant (and positive) and decreasing benefits (i.e., switching from FFS to MMC), it could be the case that the net benefit of a child's Medicaid participation goes from positive to negative, which in turn
could affect Medicaid enrollment.

In the above discussion, the changes in enrollment arise because <math xmlns="http://www.w3.org/1998/Math/MathML" display="inline"><mrow><msub><mrow><mi mathvariant="normal">B</mi><mi mathvariant="normal">E</mi><mi mathvariant="normal">N</mi></mrow><mrow><mrow><mi mathvariant="normal">F</mi><mi mathvariant="normal">F</mi><mi mathvariant="normal">S</mi></mrow></mrow></msub></mrow></math> > <math xmlns="http://www.w3.org/1998/Math/MathML" display="inline"><mrow><mi>C</mi></mrow></math> > <math xmlns="http://www.w3.org/1998/Math/MathML" display="inline"><mrow><msub><mrow><mi mathvariant="normal">B</mi><mi mathvariant="normal">E</mi><mi mathvariant="normal">N</mi></mrow><mrow><mrow><mi mathvariant="normal">M</mi><mi mathvariant="normal">M</mi><mi mathvariant="normal">C</mi></mrow></mrow></msub></mrow></math>.<sup><a href="#source-note-5" aria-label="Source note 5">5</a></sup> Currie and Fahr (2005) argue that <math xmlns="http://www.w3.org/1998/Math/MathML" display="inline"><mrow><msub><mrow><mi mathvariant="normal">B</mi><mi mathvariant="normal">E</mi><mi mathvariant="normal">N</mi></mrow><mrow><mrow><mi mathvariant="normal">M</mi><mi mathvariant="normal">M</mi><mi mathvariant="normal">C</mi></mrow></mrow></msub></mrow></math> is relatively low, because MMC may be more likely to deny care to specialists and because the alternative to Medicaid—ER use—diminishes the value of being insured. They point out that being uninsured does not preclude access to medical care in the event of a medical emergency and that Medicaid participation expands access to nonurgent care, as well as urgent care of potentially higher quality.


This argument relies on the assumption that transaction costs are positive and sufficiently high such that they exceed the benefits of being in MMC. Although Currie and Fahr (2005, footnote 4) present some important arguments why transaction costs might be high, there are also a number of reasons to question this core assumption. First, the eligibility expansions for Medicaid have made the program far less complicated with respect to child enrollment. The expansions in the 1980s and 1990s were fairly broad-based, often with nationally uniform income thresholds (i.e., OBRA 1990 as discussed in Yelowitz 1995), no restrictions based on family structure, clearly delineated eligibility breaks based on age, and much less reliance on asset tests (Gruber and Yelowitz 1999). Second, states made
efforts to increase awareness, destigmatize program participation and reduce the transaction costs. States have devoted $500 million annually to the development of outreach campaigns to increase awareness and take-up among those eligible (Aizer 2003). States also retitled their Medicaid programs with names like “MassHealth” and “Hoosier Healthwise” to reduce the stigma cost of participation. In addition, states reduced both the financial burden and nonfinancial burden of applying for Medicaid. Efforts included dropping asset tests, presumptive eligibility, self-declaration of income, and continuous eligibility. Some choices—such as imposing premiums on CHIP or waiting periods—raised the cost of participating, however.<sup><a href="#source-note-6" aria-label="Source note 6">6</a></sup>
If the efforts described above at both the national and state level lead one to believe that transaction costs (<math xmlns="http://www.w3.org/1998/Math/MathML" display="inline"><mrow><mi>C</mi></mrow></math>) are relatively low (or <math xmlns="http://www.w3.org/1998/Math/MathML" display="inline"><mrow><msub><mrow><mi mathvariant="normal">B</mi><mi mathvariant="normal">E</mi><mi mathvariant="normal">N</mi></mrow><mrow><mrow><mi mathvariant="normal">M</mi><mi mathvariant="normal">M</mi><mi mathvariant="normal">C</mi></mrow></mrow></msub></mrow></math> is fairly high even if <math xmlns="http://www.w3.org/1998/Math/MathML" display="inline"><mrow><msub><mrow><mi mathvariant="normal">B</mi><mi mathvariant="normal">E</mi><mi mathvariant="normal">N</mi></mrow><mrow><mrow><mi mathvariant="normal">F</mi><mi mathvariant="normal">F</mi><mi mathvariant="normal">S</mi></mrow></mrow></msub></mrow></math> - <math xmlns="http://www.w3.org/1998/Math/MathML" display="inline"><mrow><msub><mrow><mi mathvariant="normal">B</mi><mi mathvariant="normal">E</mi><mi mathvariant="normal">N</mi></mrow><mrow><mrow><mi mathvariant="normal">M</mi><mi mathvariant="normal">M</mi><mi mathvariant="normal">C</mi></mrow></mrow></msub></mrow></math> is high too) one again must confront the puzzle of nonparticipation. Cutler and Gruber (1996) suggest that this is consistent with the concept of conditional coverage. Unlike other transfers (such as cash welfare, food stamps, or public housing), the value from Medicaid insurance is very high when one is sick and fairly low when one is healthy. As children are typically in good health, it may take the onset of an illness to get parents to enroll them, and then when a child returns to
good health, such parents may allow Medicaid coverage to lapse. Cutler and Gruber's conditional coverage hypothesis would suggest the process repeats itself the next time the child gets sick.
## 5. Data Description
To examine the impact of managed care on insurance coverage of children (Medicaid, private coverage, and uninsurance), we rely on the March CPS Annual Social and Economic Survey (U.S.

Department of Commerce 2004). For most of the analysis, we use the March 1996–2004 CPS; because health insurance coverage is reported for the previous calendar year, this covers 1995–2003.<sup><a href="#source-note-7" aria-label="Source note 7">7</a></sup>


In some specifications, we also use data going back to 1992. The CPS health insurance questionnaire was quite uniform during the period that is analyzed.<sup><a href="#source-note-8" aria-label="Source note 8">8</a></sup> Using all of these years, we are able to exploit the fact that managed care in the Louisville and Lexington regions was phased in and then phased-out in the Lexington region. The CPS is recognized as a credible and widely respected survey. During the period in question, it was the largest survey that included health insurance coverage at the individual level and geographic identifiers (at the state and local levels). Consequently, it has been used in many academic studies examining the effects of health insurance policies across states, yet has rarely been used to study policies across localities within state.<sup><a href="#source-note-9" aria-label="Source note 9">9</a></sup>
The survey asks health insurance status for all household members; it includes questions about employer-provided health insurance, other private health insurance, and government insurance (Medicaid, Medicare, and Champus/Tricare). Individuals in responding households are recorded as uninsured if they answer “no” to all of the questions. The insurance questions refer to any point during the preceding calendar year, so being uninsured reflects a lack of health insurance throughout the entire previous year.

We initially extracted 18,411 individuals in Kentucky from the March 1996–2004 CPS. In our empirical results, we restrict attention to the 28% of individuals (5153 children) that were under the age of 18.<sup><a href="#source-note-10" aria-label="Source note 10">10</a></sup> Approximately 43% of these respondents lived in the Louisville, Lexington, or Cincinnati metropolitan areas and the remainder lived in unidentified areas. More than 36% of these respondents had some form of imputed information on health insurance; as a result, we estimate all specifications excluding imputed values, leaving us with a sample size of 3286 children.<sup><a href="#source-note-11" aria-label="Source note 11">11</a></sup>
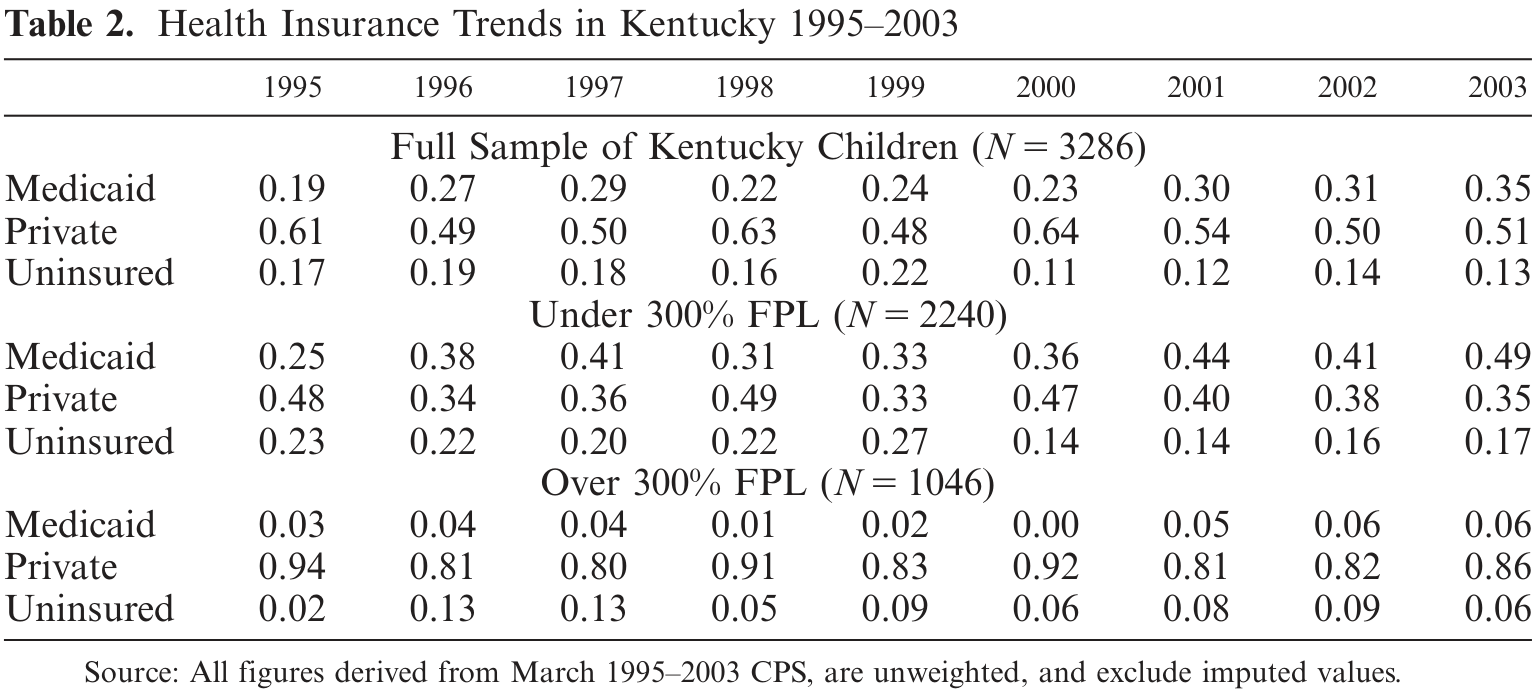
Over the entire 1995 to 2003 time period among children under 18, roughly 28% participated in Medicaid, 54% had private insurance, and 15% were uninsured. Medicaid coverage among children fell from 27–28% in 1996–1997, to 21–24% in 1998–2000, and then increased to 30–35% in 2001–2003. An important caveat associated with using the CPS is that we cannot model dynamics, as it is difficult to follow individuals over time.<sup><a href="#source-note-12" aria-label="Source note 12">12</a></sup> Another caveat that is worth mentioning is that our three insurance categories (Medicaid, private, uninsured) are neither completely mutually exclusive nor mutually exhaustive. Children may have other forms of public coverage, such as CHAMPUS/Tricare (provided to children of armed forces members), or multiple forms of coverage at the same time. Of the 3286 children in our sample, 2968 (90.3%) are either (i) uninsured (15.2%), (ii)
Medicaid-only (25.3%), or (iii) private-only (49.8%). We refer to this as the “mutually exclusive insurance status” subsample. Because the insurance distribution in our full sample is so similar, we do not restrict attention to this subsample in our analysis, other than as a robustness check.<sup><a href="#source-note-13" aria-label="Source note 13">13</a></sup>


Table 2 breaks out the insurance trends separately for low-income (under 300% FPL) and high-income (over 300% FPL) children. For the low-income sample, there is a strong negative correlation (−0.58) between Medicaid changes and uninsurance changes. This would be expected if, when Medicaid becomes less appealing (as with MMC), families drop their enrollment and become conditionally covered. In contrast, for the high-income sample, gains in Medicaid coverage do not translate into reductions in uninsurance (with a correlation coefficient of 0.35). For the low-income sample, Medicaid coverage increased until 1997, then dipped in 1998–2000, and then started to increase again. For the high-income sample, no obvious patterns are present. Although the patterns for the full sample or low-income sample are certainly consistent with the implementation and repeal of
managed care affecting Medicaid participation, other factors clearly matter as well. Kentucky—like the rest of the United States—was experiencing substantial economic growth in the late 1990s until the 2001 recession. The unemployment rate in Kentucky fell from 5.1% in 1996 to 4.1% in 2000, but increased to 5.6% by 2002.
### Table 2. Health Insurance Trends in Kentucky 1995–2003

<figure class="article-figure" id="table-2"><a href="/files/publications/ay-ja-xfwzrizrrkkr2yew-assets/table-2.png"><img alt="Table 2. Medicaid, private insurance and uninsured shares of Kentucky children during 1995–2003, for the full sample and groups below and above 300% of poverty." height="696" loading="lazy" src="/files/publications/ay-ja-xfwzrizrrkkr2yew-assets/table-2.png" width="1540"/></a><figcaption>Table 2. <a href="/files/publications/ay-ja-xfwzrizrrkkr2yew-assets/table-2.png">Open full-resolution image</a>.</figcaption></figure>


### Table 3. Summary Statistics from CPS

<figure class="article-figure" id="table-3"><a href="/files/publications/ay-ja-xfwzrizrrkkr2yew-assets/table-3.png"><img alt="Table 3. CPS insurance and demographic summary statistics for children in Louisville, Lexington, Northern Kentucky and the rest of Kentucky." height="804" loading="lazy" src="/files/publications/ay-ja-xfwzrizrrkkr2yew-assets/table-3.png" width="1540"/></a><figcaption>Table 3. <a href="/files/publications/ay-ja-xfwzrizrrkkr2yew-assets/table-3.png">Open full-resolution image</a>.</figcaption></figure>


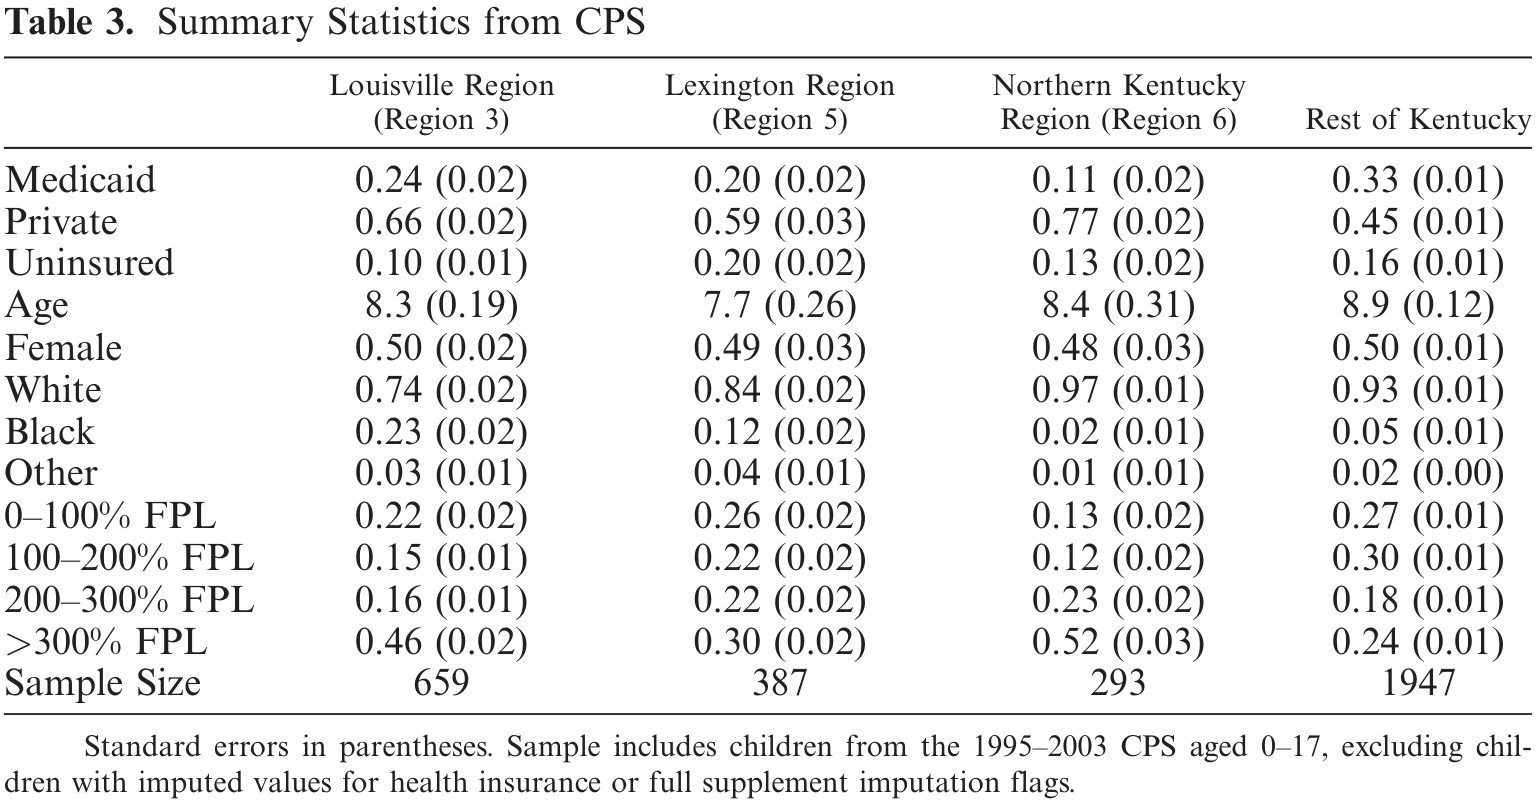
Table 3 provides summary statistics. Across the full sample, almost 90% of children are white, and virtually all remaining children are African-American. Nearly 25% of children live in poverty and another 25% live in near-poverty. Approximately 20% live in the Louisville MSA and another 12% live in the Lexington MSA; thus, a substantial fraction of the sample was subject to the managed care mandate after 1997. Table 3 shows clear differences across the three metro areas in Kentucky, as well as the remainder of the state. Northern Kentucky (which includes the Cincinnati metro area) is relatively affluent, while the “rest of Kentucky” (which includes Appalachia) is far poorer. Both major urban areas in Kentucky—Louisville and Lexington—have far greater minority concentration than the rest of the state. The columns in this table illustrate that there are certainly fixed characteristics
that vary by region that in turn may affect health insurance choices. All empirical specifications will therefore include fixed effects for the Louisville, Lexington, and Northern Kentucky regions (with the rest of Kentucky omitted).
## 6. Empirical Setup
We rely on the CPS to examine health insurance coverage and focus on repeated cross-sections of children under age 18 from Kentucky. We follow Currie and Fahr (2005) and estimate linear probability models. The specification is:

<figure class="article-figure" id="equation-1"><a href="/files/publications/ay-ja-xfwzrizrrkkr2yew-assets/equation-1.png"><img alt="Equation 1. Insurance status equals an intercept plus Medicaid managed-care exposure, individual controls, region and time effects, and an error term." height="64" loading="lazy" src="/files/publications/ay-ja-xfwzrizrrkkr2yew-assets/equation-1.png" width="1108"/></a><figcaption>Equation 1. <a href="/files/publications/ay-ja-xfwzrizrrkkr2yew-assets/equation-1.png">Open full-resolution image</a>.</figcaption></figure>


where <math xmlns="http://www.w3.org/1998/Math/MathML" display="inline"><mrow><msub><mrow><mi mathvariant="normal">I</mi><mi mathvariant="normal">N</mi><mi mathvariant="normal">S</mi></mrow><mrow><mi>i</mi><mi>j</mi><mi>t</mi></mrow></msub></mrow></math> represents insurance coverage (either Medicaid coverage, private coverage, or no coverage) for person i in MSA j (Louisville, Lexington, or Northern Kentucky/Cincinnati, with the rest of the state as the omitted group) in time period <math xmlns="http://www.w3.org/1998/Math/MathML" display="inline"><mrow><mi>t</mi></mrow></math> (1995–2003), and is a dummy variable equal to 1 if the child had that coverage at any time during the previous calendar year. We also include a number of individual controls in <math xmlns="http://www.w3.org/1998/Math/MathML" display="inline"><mrow><msub><mi>X</mi><mi>i</mi></msub></mrow></math> related to the child or the
child's family (age, gender, race, and family income category).<sup><a href="#source-note-14" aria-label="Source note 14">14</a></sup> The variable <math xmlns="http://www.w3.org/1998/Math/MathML" display="inline"><mrow><msub><mrow><mi mathvariant="normal">M</mi><mi mathvariant="normal">M</mi><mi mathvariant="normal">C</mi></mrow><mrow><mi>j</mi><mi>t</mi></mrow></msub></mrow></math> is the full-year Medicaid Managed Care policy indicator and varies only by MSA and time period.<sup><a href="#source-note-15" aria-label="Source note 15">15</a></sup> It represents the fraction of the population in MSA j that would be covered by MMC. It also incorporates the fact the “rest of the state” category includes several counties covered under the Louisville-centered or Lexington-centered managed care plan. The MMC policy indicator accounts for the partial year phase-in of MMC in 1997 and the partial year phase-out in 2000 (in Lexington).

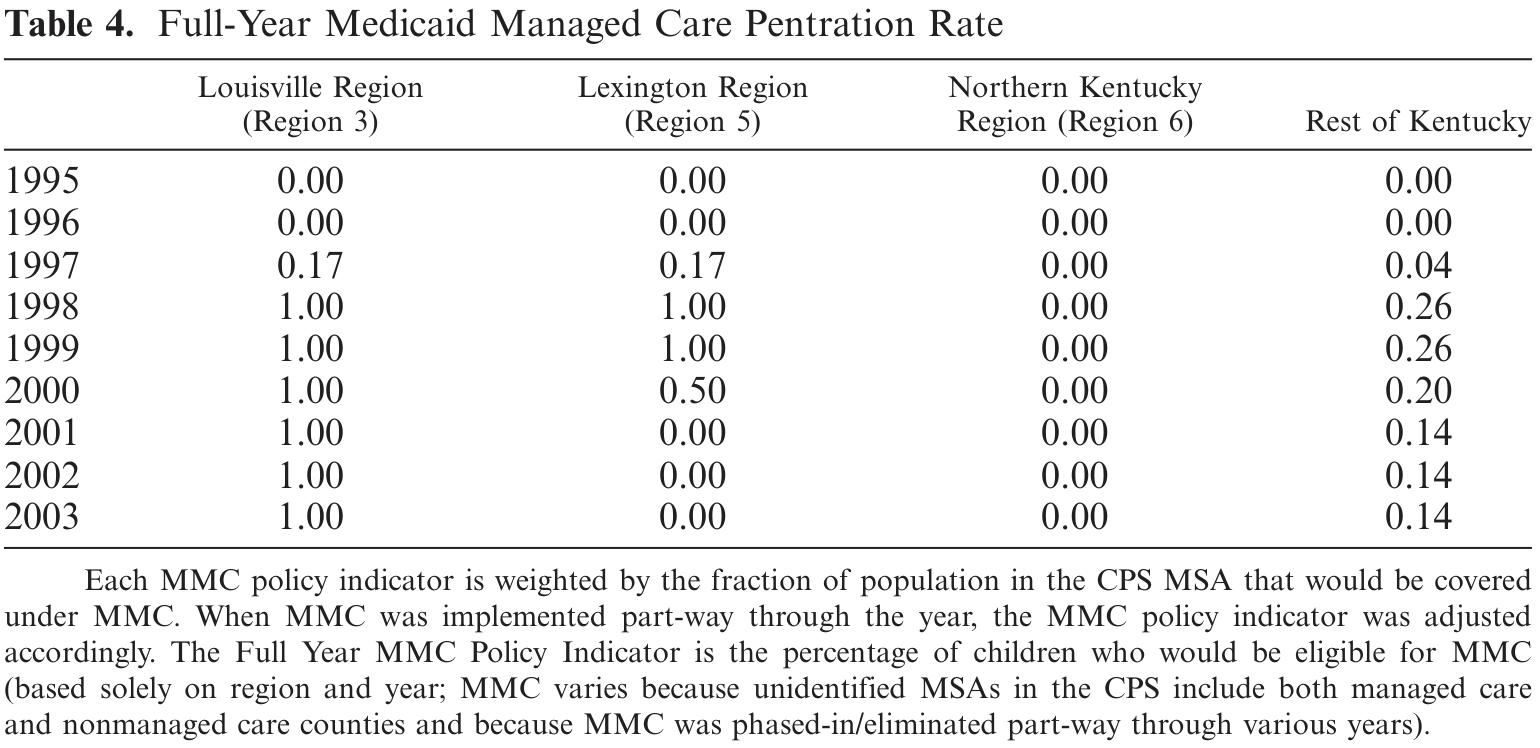
Table 4 illustrates the values for <math xmlns="http://www.w3.org/1998/Math/MathML" display="inline"><mrow><msub><mrow><mi mathvariant="normal">M</mi><mi mathvariant="normal">M</mi><mi mathvariant="normal">C</mi></mrow><mrow><mi>j</mi><mi>t</mi></mrow></msub></mrow></math> used in our analysis, for each of the four regions. The Passport program was implemented in Louisville in late 1997; thus the population was covered for 2/12ths of that year, and then for the full year thereafter. Similarly, KHS was implemented in Lexington in late 1997, but was phased-out in the middle of 2000. Thus, the full-year MMC policy indicator falls back to zero from 2001 onward. Managed care was never available in Northern Kentucky; thus, children in that region are always assigned a value of zero. Finally, the “rest of Kentucky” includes 104 of the 120 counties in Kentucky. Of these 104 counties, 13 of them are relatively close to Louisville and participated in Passport. Another 14 counties are close to Lexington and participated in KHS. The remaining 77 counties did not participate in MMC. The values in the final column of Table 4 reflect the MMC policy indicator for the 104 counties; it incorporates the phase-in of managed care in November 1997 for the 27 counties near Louisville and Lexington, the phase-out of managed care in July 2000 for the 14 counties near Lexington, and the fact that the population in the remaining counties was never covered by managed care.


### Table 4. Full-Year Medicaid Managed Care Pentration Rate

<figure class="article-figure" id="table-4"><a href="/files/publications/ay-ja-xfwzrizrrkkr2yew-assets/table-4.png"><img alt="Table 4. Annual Medicaid managed-care penetration by Kentucky region, 1995–2003, adjusted for population coverage and part-year implementation." height="748" loading="lazy" src="/files/publications/ay-ja-xfwzrizrrkkr2yew-assets/table-4.png" width="1540"/></a><figcaption>Table 4. <a href="/files/publications/ay-ja-xfwzrizrrkkr2yew-assets/table-4.png">Open full-resolution image</a>.</figcaption></figure>


By the construction of the MMC policy indicator, the coefficient <math xmlns="http://www.w3.org/1998/Math/MathML" display="inline"><mrow><msub><mi>&#x003B2;</mi><mn>1</mn></msub></mrow></math> measures the marginal impact on insurance coverage from switching to MMC for a full year. Our specification includes fixed effects for time and region (<math xmlns="http://www.w3.org/1998/Math/MathML" display="inline"><mrow><msub><mi>&#x003B4;</mi><mi>t</mi></msub></mrow></math> and <math xmlns="http://www.w3.org/1998/Math/MathML" display="inline"><mrow><msub><mi>&#x003B4;</mi><mi>j</mi></msub></mrow></math>). Time fixed effects account for time-varying statewide economic conditions or statewide changes in transfer programs. Currie and Fahr (2005) note that changing income cutoffs can confound the effect of MMC. Fixed effects for the four MSA-defined regions account for time-invariant regional differences, such as the underlying differences in the population in Appalachia. With these fixed effects included, the coefficient <math xmlns="http://www.w3.org/1998/Math/MathML" display="inline"><mrow><msub><mi>&#x003B2;</mi><mn>1</mn></msub></mrow></math> can be interpreted as the difference-in-differences estimator and identification comes from the region-time interaction.

A key assumption in the above model, however, is that a child's region is exogenous. One threat to identification comes from the possibility that families systematically move across regions in Kentucky in response to Medicaid policy. In the broader literature on welfare benefits, Gelbach (2004) convincingly finds that among women likely to use cash welfare, movers move to higher-benefit states, and do so earlier in the life cycle. In the context of health insurance, however, Schwartz and Sommers (2014) find that expanding Medicaid did not affect state-to-state moves.

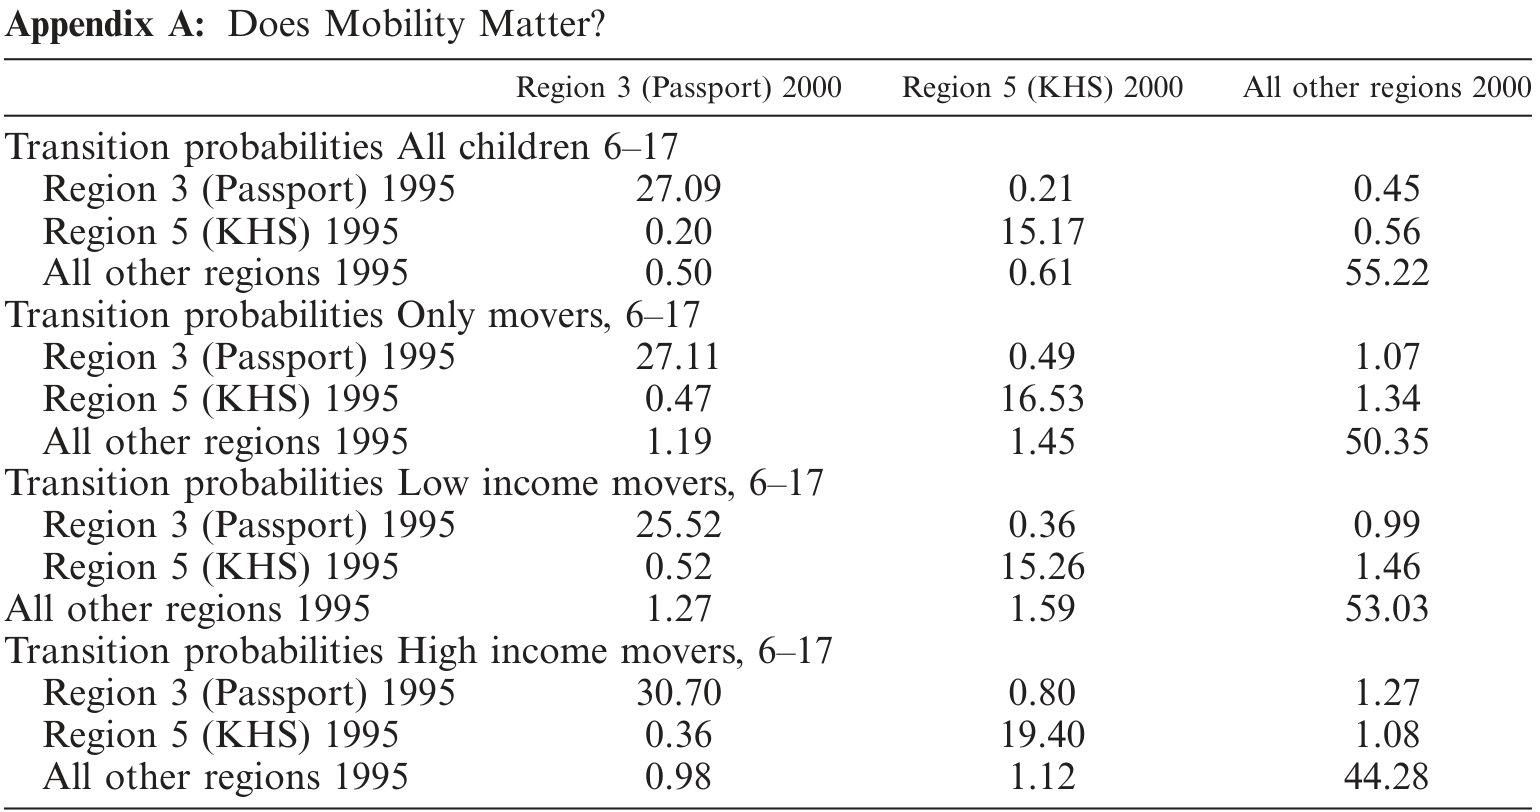
Despite these mixed findings on migration, if one believes that state-to-state moves occur due to differences in cash welfare generosity, then within-state moves (which are clearly less costly for families) due to differences in Medicaid plan generosity may be an important issue. The moving cost may be especially low in Kentucky, which has 120 counties, all of which are fairly small with respect to land area. With longitudinal data, a number of studies have used the family's initial county of residence prior to changes in Medicaid policy as an instrument for the actual policy (Aizer, Currie, and Moretti. 2007; Marton, Yelowitz, and Talbert 2014). These studies tend to find that accounting for migration has little impact on the parameter estimates. Because our CPS data are a series of repeated cross-sections, we cannot employ the approach of Aizer, Currie, and Moretti (2007) or Marton, Yelowitz, and Talbert (2014). Instead, we examine data from the 2000 Census Public-Use Microdata Sample. We use the 5% sample and Census weights to directly explore migration patterns within Kentucky for 30,127 children aged 5–17 in 2000, who resided in Kentucky in both 1995 and 2000. The timespan between 1995 and 2000 is very informative for our purposes, because it encompasses the shift to MMC. For the children in this sample, mobility is fairly high: 42% of children changed residences at some point during the 5-year period. We observe Public Use Microdata Areas (PUMAs) both in 1995 and 2000 for 25 geographic areas within Kentucky. We assign each PUMA to region 3 (Louisville), region 5 (Lexington), or the rest of the state.


The first panel of Appendix A shows mobility matrices from 1995 to 2000 across regions within Kentucky for the full sample. Of children initially in a Passport or KHS region, approximately 1.01% (= 0.45 + 0.56) moved to a FFS region between 1995 and 2000. Of children initially in other regions, approximately 1.11% (= 0.50 + 0.61) moved to a managed care region. Hence, net migration across regions is essentially zero. One concern with this first panel, however, is that by definition, the diagonal includes nonmovers. When we examine the 42% of children who moved in the second panel, the conclusions are essentially unchanged. Around 2.7% of children in a FFS region who moved ended up in a MMC region, and around 2.4% of children in a MMC region who moved ended up in a FFS region.

The final two panels in this table examine low-income and high-income children who moved during the five-year period. Migration induced by transfer programs (either cash welfare or health insurance) would likely affect the low-income, but not high-income group. Among low-income children, 2.86% moved from a FFS to MMC region and 2.45% moved from MMC to FFS.

Among high-income children, these numbers are 2.1 and 2.35%, respectively. The fact that interregional moves are nearly identical for these groups and that the migration flows are relatively balanced suggests that endogenous migration is not a substantive issue.
## 7. Results
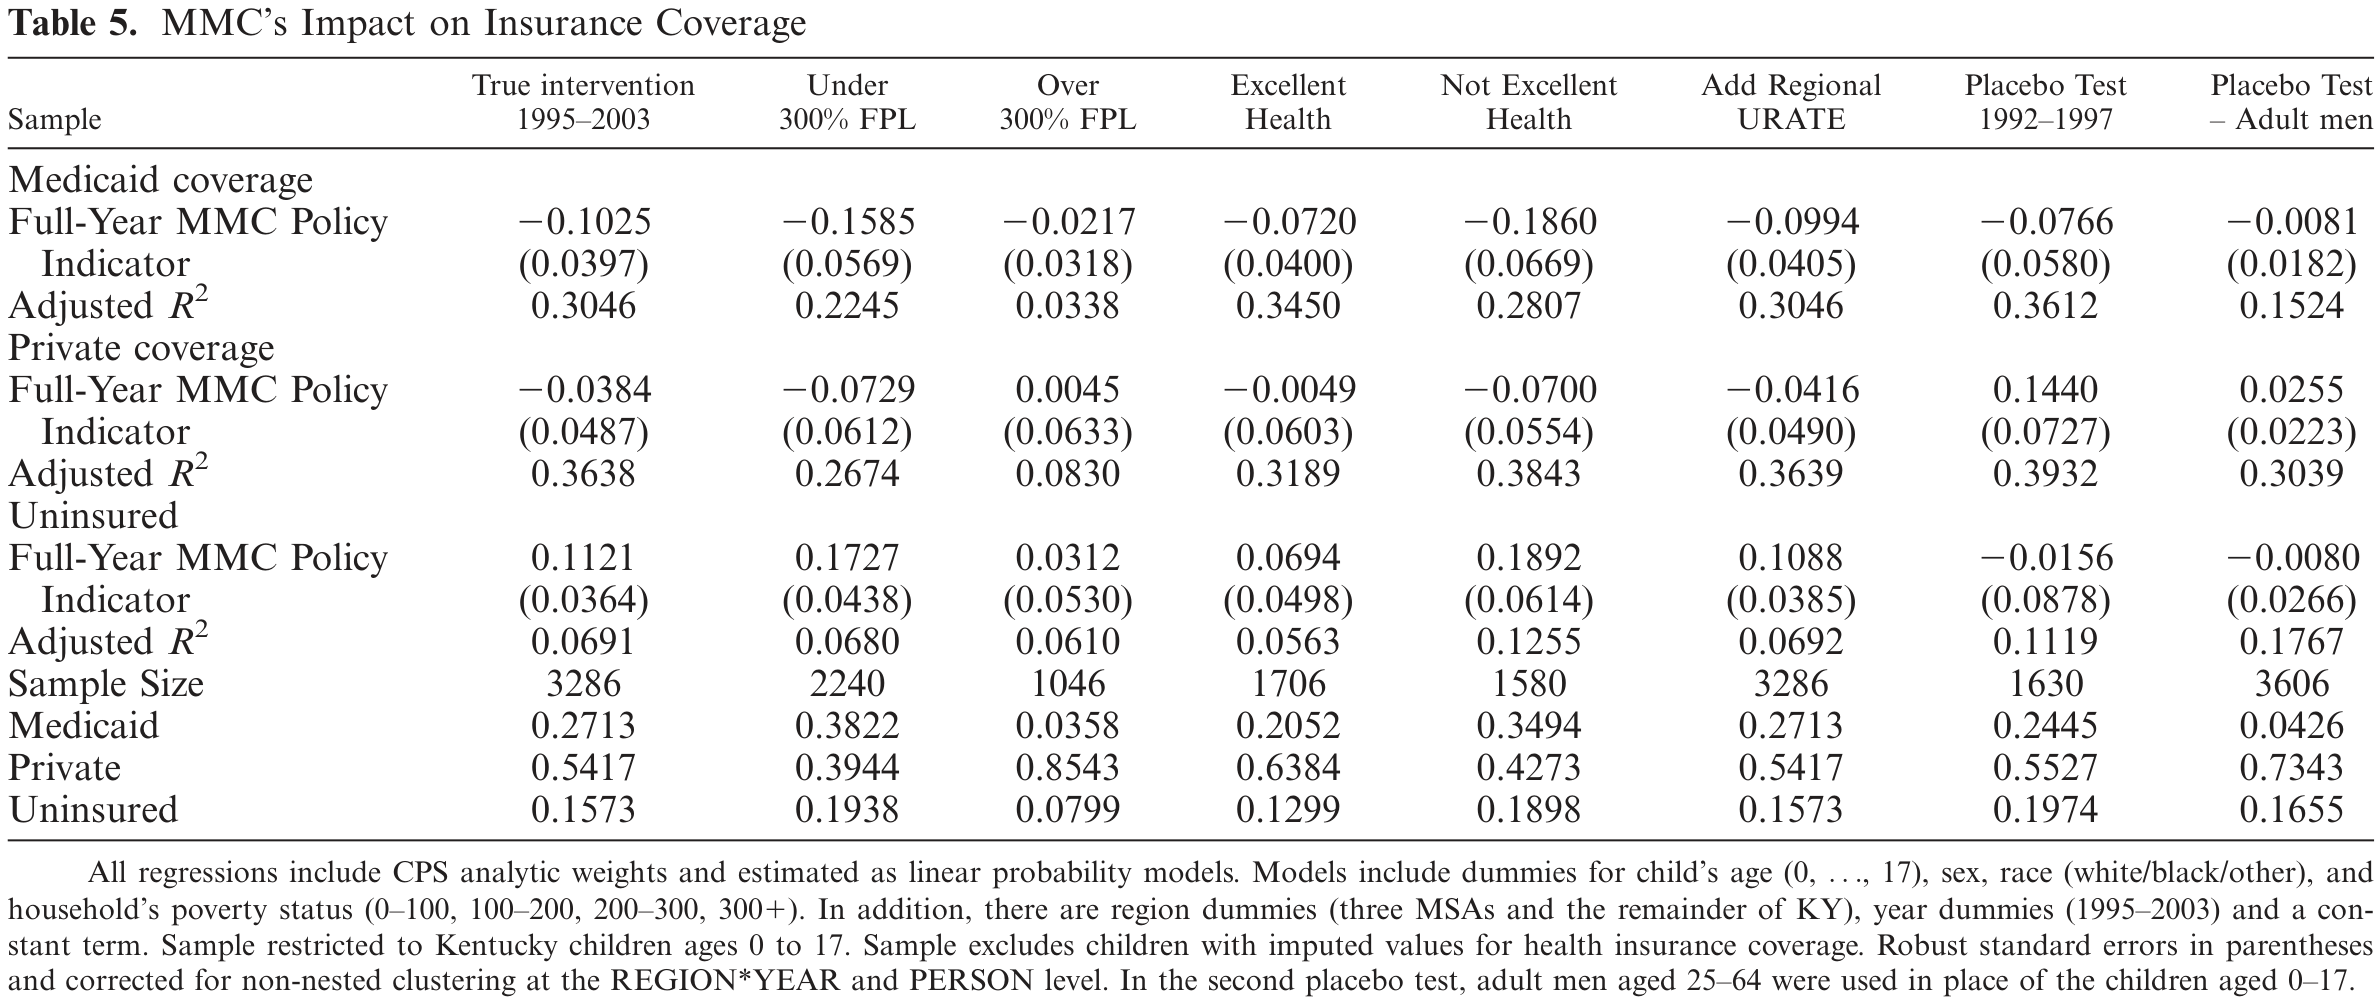
Our analysis starts by examining 3286 children in Kentucky from 1995 to 2003 in Table 5 Column 1 shows that implementing MMC reduces Medicaid participation by roughly 10 percentage points. There is a virtually identical increase in the uninsured rate and no change in private insurance coverage. When combined, these results suggest that, holding other factors constant, MMC is less valuable than FFS. When there are transaction costs for continuing on Medicaid (such as the hassle of recertification) and essentially no barrier in re-enrolling at the time a child gets sick, the pattern of results would suggest a confirmation of Cutler and Gruber’s (1996) conditional coverage hypothesis. The results are substantively large; the baseline Medicaid coverage rate for the full sample over 1995–2003 was 28%, meaning that MMC reduces
participation on the extensive margin by approximately roughly 35%. The baseline uninsured rate is 15%, meaning that MMC increases it by nearly 75%. The evidence presented here of reductions in Medicaid participation are consistent with other analyses of Kentucky’s Medicaid program; Marton (2007) finds that relatively small $20 family premiums for CHIP induce substantial exits from the program.


### Table 5. MMC’s Impact on Insurance Coverage

<figure class="article-figure" id="table-5"><a href="/files/publications/ay-ja-xfwzrizrrkkr2yew-assets/table-5.png"><img alt="Table 5. Estimated managed-care effects on Medicaid, private insurance and uninsured status across income and health subgroups, with regional-control and placebo specifications." height="1004" loading="lazy" src="/files/publications/ay-ja-xfwzrizrrkkr2yew-assets/table-5.png" width="2380"/></a><figcaption>Table 5. <a href="/files/publications/ay-ja-xfwzrizrrkkr2yew-assets/table-5.png">Open full-resolution image</a>.</figcaption></figure>


Medicaid—like other transfer programs—targets low-income groups. Thus, a key prediction is that the impact of MMC should be concentrated among low-income children but not high-income children. Columns 2 and 3 break children out into these two groups, and following the logic of Currie and Fahr (2005), we divide the sample where family income exceeds 300% FPL.

Although the formal income cutoff for Kentucky’s CHIP program is only 200% FPL, it is based on monthly income, while income is measured on an annual basis in the CPS. Thus, in families with volatile income, some children might qualify and report Medicaid coverage even though their annual income is above the CHIP income cutoff. Stratifying at 300% FPL leaves two-thirds of children under this cutoff, and likely means that even with substantial income volatility, we are correctly classifying children ineligible for Medicaid. The results for low-income children in column 2 suggest a highly significant reduction—16 percentage points—in Medicaid participation from MMC and a corresponding one-for-one rise in the uninsured rate. For high-income children, the results are both insignificant and much smaller
in magnitude.

In the next two columns, we explore how health status interacts with MMC. This is motivated by Reichman, Corman, and Noonan (2006) who examine the impacts of child health on various forms of public support. During the 1995–2003 period, the CPS asked respondents to self-report their health into five categories: excellent, very good, good, fair, and poor. Children are overwhelming reported to be in excellent health, so we divide the sample roughly in half by comparing those in excellent health to all other health categories. For those in excellent health, the implicit value of Medicaid health insurance is relatively low, and the change in value from switching from the more generous FFS to the less generous MMC is low, too. As the
change in value from moving to MMC is low, we expect relatively little change in participation for children in excellent health. In contrast, the change in value is higher for children in worse health and we therefore expect a decrease in Medicaid participation and an increase in uninsurance. The results in columns 4 and 5 confirm this behavior. For both children in excellent and worse health, there are one-for-one decreases in Medicaid participation and increases in uninsurance. The magnitude is approximately three times larger for those in worse health, consistent with the idea that there was a larger change in the value of Medicaid. Given that there may be a correlation between child health status and family income, we replicated our results
from columns 4 and 5 on a subsample restricted to children under 300% FPL. We found larger reductions (increases) in Medicaid (uninsurance) for this subsample (results available upon request) as compared to our full sample. The fact that our “conditional coverage” result is also present in this subsample gives us more confidence that the results we report in columns 4 and 5 are picking up the effect of health status and not simply the effect of being impacted by the mandate.

In the final three columns, we explore various issues related to the robustness of the results. We first note that the variation in MMC comes at the region-year level. We control for both region and year effects, meaning the identifying variation comes from the interaction of the two. There is still a concern about omitted variables that vary within a region over time, however. An obvious concern would be the business cycle: economic conditions may change differentially in Louisville relative to Lexington, or relative to Appalachia. To directly address this concern, we explicitly include the unemployment rate, which is readily available from the BLS, for each region and year, aggregated from the counties within those regions. The
results in column 6 suggest that omitted region-year factors do not materially affect our conclusions. The coefficient estimates are quite similar to the original estimates in column 1. Although the estimates are somewhat less precise, both the decline in Medicaid participation and the rise in uninsurance remain statistically significant.


Another concern is that pre-existing trends for health insurance within regions might be correlated with the implementation of MMC, falsely leading to the conclusion that MMC reduced Medicaid participation. To address this, we form a “placebo test” by now calling the 1995–1997 period the “after” period, and the period from 1992 to 1994 as the “before” period. We assign to each region and year the MMC policy indicator from three years later (i.e., 1995 is assigned 1998’s value shown in Table 3). In all cases, the results are insignificant; thus there is no evidence of any effect on any of the outcomes.

Next, we return to the 1995–2003 sample and provide another placebo test by examining 3614 adult men. The Medicaid program during this period was highly targeted to several groups, such as low-income children, pregnant women, and participants in AFDC/TANF or SSI. Adult men typically do not fall into these categories, and Medicaid participation for them is exceedingly low. Nonetheless, if MMC simply proxies for some omitted region-time factor, one might expect similar changes in private coverage or uninsurance for this group. In the final column, the effect private coverage is insignificant and opposite signed to the initial specification for children in column 1. For uninsurance, there is virtually no change due to MMC; the “effect” is less than one percentage point and
insignificant. This stands in stark contrast to the findings in the main specification.

We performed three additional placebo tests whose results are not reported, but are available upon request. First, we explore the construction of the MMC variable. One may be concerned with measurement error, especially for the 104 counties that form a hybrid of regions 3, 5, and the rest of Kentucky. We re-estimate each model given in Table 5, restricting to region-year cells where MMC equals 0 or 1 (see Table 4). Although we have smaller samples, our findings are very similar to our baseline results. Second, we restricted our control group to children in region 6 (Northern Kentucky) and re-estimated each model given in Table 5. The purpose of this robustness check is attempt to make the control group as similar as possible to the treatment group
(see Table 3) in terms of responses to economic cycles over and above those controlled for by our inclusion of the unemployment rate in column 6 of Table 5. Our findings here are once again very similar to our baseline results. Third, we consider whether or not changes in Medicaid eligibility over time confound our results, despite our inclusion of year fixed effects. We test this by restricting our sample to children in families with income below the poverty line, as there were no changes in Medicaid eligibility for these children over the period in question.<sup><a href="#source-note-16" aria-label="Source note 16">16</a></sup> Restricting the sample in this way does not lead to large changes in our results.

Finally, we estimate a Multinomial Logit model of insurance choice on our full sample and on our “mutually exclusive insurance status” subsample. This forces our coefficients to add up across the different categories of insurance coverage. These models produce estimates that are quantitatively similar to our baseline specification.
## 8. Conclusions
In this study, we have examined implementation of MMC in Kentucky on the insurance coverage choices of children. We argue that switching from FFS to MMC implicitly lowers the value of the Medicaid, and should therefore lead to substitution away from Medicaid and toward either private coverage or uninsurance. We find essentially one-for-one substitution away from Medicaid and toward uninsurance. Increasing the MMC policy indicator from 0 to 100% lowers Medicaid participation (and raises uninsurance) by approximately 10 percentage points, a result that is statistically significant, robust to sensible changes in the empirical specification, and substantively important. We find no evidence of substitution to private plans.


Prior work, such as Currie and Fahr (2005), has also found evidence that MMC has reduced Medicaid participation, but with small overall magnitudes and effects that are restricted to important subgroups (such as African Americans and young children). We suspect that the implementation of MMC in Kentucky—which was abrupt, far-reaching, and mandatory—likely led to a larger decline in Medicaid’s value (and thus, a larger decline in participation) compared to their empirical approach which relies on HCFA classifications of MMC across all states. Our approach, for example, classifies Kentucky regions as “managed care” only after they have a comprehensive set of reforms relating to provider reimbursement, consumer choice, and administrative responsibilities (Marton, Yelowitz, and Talbert 2014), whereas HCFA classifies Kentuckians as in managed care once it adopted a gatekeeper model with primary care case management (KENPAC) several years prior to the comprehensive reform, even though the delivery system was still FFS.

Although we argue that the benefits from Medicaid changed due to the switch from FFS to MMC, it is more difficult to argue that the costs of participating changed much or were particularly high to begin with. Importantly, it is difficult to believe that transaction costs increased due to the shift to MMC. For example, there is no evidence that Kentucky’s Medicaid program became more stigmatizing or that the enrollment barriers became more difficult after 1997. Rather, the observed behavior in our data is consistent with low transaction costs—in a sense, children are conditionally covered by Medicaid. Unlike other transfer programs that confer a relatively high benefit flow each period, the value from Medicaid is largely derived when
children are sick. Families can cycle children on and off Medicaid when the child's health changes, in contrast to private market coverage which, at the time, had preexisting condition clauses and benefit carve-outs. Such an explanation would also be consistent with substantively large effects, as families are not forgoing a valuable benefit for the children, but rather procrastinating in signing up for that benefit. The conditional coverage explanation would also be consistent with a lack of flow from Medicaid to private plans since bouncing out of Medicaid into a private plan likely entails a monthly premium cost to the consumer.

To the extent that conditional coverage explains the shift from Medicaid to being uninsured, our findings potentially speak more generally to some important provisions in the ACA. In our study, Kentucky’s Medicaid program was always open enrollment (a child could immediately enroll if they were eligible), guaranteed issue (sick children could enroll), community rated (at an extremely low premium, if any), and had no financial penalties for nonparticipation. Thus, if managed care is the primary coverage mechanism for the Medicaid expansion population, there is the possibility that increases in formal coverage will be smaller than anticipated. Of course, our results focus on children enrolled in Medicaid, so further research is needed to assess the extent to which our conditional
coverage findings apply to older Medicaid enrollees or the broader exchange population.


## Appendix A: Does Mobility Matter?

<figure class="article-figure" id="appendix-a"><a href="/files/publications/ay-ja-xfwzrizrrkkr2yew-assets/appendix-a.png"><img alt="Appendix A. Transition probabilities between Kentucky regions from 1995 to 2000 for children aged 6–17, including all children, movers, low-income movers and high-income movers." height="812" loading="lazy" src="/files/publications/ay-ja-xfwzrizrrkkr2yew-assets/appendix-a.png" width="1540"/></a><figcaption>Appendix A. <a href="/files/publications/ay-ja-xfwzrizrrkkr2yew-assets/appendix-a.png">Open full-resolution image</a>.</figcaption></figure>

## Acknowledgments
We would like to thank Jeff Talbert, Tim Harris, Barry Hirsch, Chris Bollinger, and two anonymous referees for their valuable comments. Any errors are, of course, our own.
## References

Aizer, Anna. 2003. Low take-up in Medicaid: Does outreach matter and for whom? American Economic Review Papers and Proceedings 93(2):238–41.

Aizer, Anna. 2007. Public health insurance, program take-up, and child health. Review of Economics and Statistics 89(3): 400–15.

Aizer, Anna, Janet Currie, and Enrico Moretti. 2007. Does managed care hurt health? Evidence from Medicaid mothers. Review of Economics and Statistics 89(3):385–99.

Aizer, Anna, and Jeffrey Grogger. 2003. Parental Medicaid expansions and health insurance coverage. NBER Working Paper 9907.

Baicker, Katherine, and Amitabh Chandra. 2006. The labor market effects of rising health insurance premiums. Journal of Labor Economics 24(3):609–34.

Baker, Laurence, Susan Schmitt, and Ciaran Phibbs. 2003. Medicaid managed care in California and health care for newborns. Department of Health Research and Policy, Stanford University, Stanford, CA.

Barham, Tania, Paul Gertler, and Kristiana Raube. 2013. Managed care mandates and birth outcomes: Who benefits and does the model matter. Working Paper. Accessed from: http://www.colorado.edu/ibs/hs/barham/PAPERS/Barham_Gertler_Raube_MediCal_April2013.pdf. Accessed 15 May 2014.

Bartosch, William J., and Susan G. Haber. 2004. Evaluation of the Kentucky Health Care Partnership Program: A comparison of the managed care experiences in regions 3 and 5 - Final Report. RTI International. Accessed from: http://www.cms.gov/Research-Statistics-Data-and-Systems/Statistics-Trends-and-Reports/Reports/downloads/Bartosch.pdf. Accessed 15 May 2014.

Bergman, David A., and Charles J. Homer. 1998. Managed care and the quality of children’s health services. Children and Managed Health Care 8(2):60–75.

Bollinger, Christopher R., and Barry T. Hirsch. 2006. match bias from earnings imputation in the current population survey: The case of imperfect matching. Journal of Labor Economics 24(3):483–520.

Buchmueller, Thomas, and John DiNardo. 2002. Did community rating induce an adverse selection death spiral? Evidence from New York, Pennsylvania, and Connecticut. American Economic Review 92(1):280–94.

Cameron, A. Colin, Jonah B. Gelbach, and Douglas L. Miller. 2011. Robust inference with multiway clustering. Journal of Business & Economic Statistics 29(2):238–49.

Center for Budget and Policy Priorities [CBPP]. 2012. How health reform’s Medicaid expansion will impact state budgets. Accessed from: http://www.cbpp.org/files/7-12-12health.pdf. Accessed 15 May 2014.

Currie, Janet, and John Fahr. 2005. Medicaid managed care: Effects on children’s Medicaid coverage and utilization. Journal of Public Economics 89(1):85–108.

Cutler, David M., and Jonathan Gruber. 1996. Does public insurance crowd out private insurance? Quarterly Journal of Economics 111(2):391–430.

Cutler, David M., and Jonathan Gruber. 1997. Medicaid and private insurance: Evidence and implications. Health Affairs 16(1):194–200.

Davis, Karen, Karen Scott Collins, Cathy Schoen, and Cynthia Morris. 1995. Choice matters: Enrollees’ views of their health plans. Health Affairs 14(2):99–112.

Duggan, Mark. 2004. Does contracting out increase the efficiency of government programs? Evidence from Medicaid HMOs. Journal of Public Economics 88(12):2549–72.

Duggan, Mark, and Tamara Hayford. 2013. Has the shift to managed care reduced Medicaid expenditures? Evidence from state and local-level mandates. Journal of Policy Analysis and Management 32(3):505–35.

Feldstein, Martin. 2013. Obamacare’s fatal flaw, published in Project Syndicate: The World’s Opinion Page. Accessed from: http://www.project-syndicate.org/commentary/martin-feldstein-on-how-america-s-health-care-reform-could-unravel. Accessed 15 May 2014.

Gelbach, Jonah B. 2004. Migration, the life cycle, and state benefits: How Low is the bottom? Journal of Political Economy 112(5):1091–130.

Gilmer, Todd P., and Richard G. Kronick. 2009. Hard times and health insurance: How many Americans will be uninsured by 2010? Health Affairs 28(4):573–77.

Gruber, Jonathan, and Aaron Yelowitz. 1999. Public health insurance and private savings. Journal of Political Economy 107(6):1249–74.

Hamersma, Sarah, and Burçin Ünel. 2013. Wearing out your welcome: Examining differential Medicaid eligibility of new entrants and continuing recipients. Working Paper. Accessed from: http://www.maxwell.syr.edu/uploadedFiles/cpr/people/faculty/hamersma/Wearing%20out%20Your%20Welcome%2011-2013.pdf. Accessed 10 August 2014.

Herring, Bradley, and E. Kathleen Adams. 2011. Using HMOs to serve the Medicaid population: What are the effects on utilization and does the type of HMO matter? Health Economics 20(4):446–60.

Hu, Tianyahn, Shin-Yi Chou, and Mary E. Deily. 2013. Pregnancy outcomes for Medicaid patients in mandatory managed care: The Pennsylvania Health Choices Program. Working Paper.

Kaestner, Robert, Lisa Dubay, and Genevieve Kenney. 2005. Managed care and infant health: An evaluation of Medicaid in the U.S. Social Science and Medicine 60(8):1815–33.

Kenney Genevieve, R. Andrew Allison, Julia F. Costich, James Marton, and Joshua McFeeters. 2006. Effects of premium increases on enrollment in SCHIP: Findings from three states. Inquiry 43(4):378–92.

Lo Sasso, Anthony, and Thomas Buchmueller. 2004. The Effect of the State Children’s Health Insurance Program on health insurance coverage. Journal of Health Economics 23(5):1059–82.

Madrian, Brigitte C., and Lars John Lefgren. 2000. An Approach to longitudinally matching current population survey (CPS) respondents. Journal of Economic and Social Measurement 26(1):31–62.

Marton, James. 2007. The impact of the introduction of premiums into a SCHIP Program. Journal of Policy Analysis and Management 26(2):261–79.

Marton, James, Patricia G. Ketsche, and Mei Zhou. 2010. SCHIP premiums, enrollment, and expenditures: A two state, competing risk analysis. Health Economics 19(7):772–91.

Marton, James, and Jeffery C. Talbert. 2010. CHIP premiums, health status, and the insurance coverage of children. Inquiry 47(3):199–214.

Marton, James, Aaron Yelowitz, and Jeffery C. Talbert. 2014. A tale of two cities? The heterogeneous impact of Medicaid managed care. Journal of Health Economics 36(1):47–68.

Nelson, Charles T., and Robert J. Mills. 2001. The March CPS Health Insurance verification question and its effect on estimates of the uninsured. Washington: U.S. Bureau of the Census.

Peltzman, Sam. 1973. The effect of government subsidies-in-kind on private expenditures: The case of higher education. Journal of Political Economy 81(1):1–27.

Reichman, Nance E., Hope Corman, and Kelly Noonan. 2006. Effects of child health on sources of public support. Southern Economic Journal 73(1):136–56.

Schwartz, Aaron L., and Benjamin D. Sommers. 2014. Moving for Medicaid? Recent eligibility expansions did not induce migration from other states. Health Affairs 33(1):88–94.

Simon, Kosali. 2005. Adverse selection in health insurance markets? Evidence from State small-group health insurance reforms. Journal of Public Economics 89(9/10):1865–77.

Swartz, Katherine. 1986. Interpreting the estimates from four national surveys of the number of people without health insurance. Journal of Economic and Social Measurement 14(3):233–42.

Swartz, Katherine. 1997. Changes in the 1995 current population survey and estimates of health insurance coverage. Inquiry 34(1):70–9.

U.S. Department of Commerce, Bureau of the Census, Current Population Survey: Annual Social and Economic (ASEC) Supplement, 2003 [computer file]. Washington, D.C.: U.S. Department of Commerce, Bureau of the Census [producer], 2003. Ann Arbor, MI: Inter-university Consortium for Political and Social Research [distributor], 2004.

Wolfe, Barbara, and Scott Scrivner. 2005. The devil may be in the details: How the characteristics of SCHIP Programs affect takeup. Journal of Policy Analysis and Management 24(3):499–522.

Yelowitz, Aaron. 1995. The Medicaid notch, labor supply and welfare participation: Evidence from eligibility expansions. The Quarterly Journal of Economics 110(4):909–39.

Yelowitz, Aaron. 1998. Why did the SSI-disabled program grow so much? Disentangling the effect of Medicaid. Journal of Health Economics 17(3):321–50.

## Notes

<p id="source-note-1"><strong>1.</strong> During the first three years (2014–2016) of the Medicaid expansion, the federal government will cover 100% of the costs of those made newly eligible for Medicaid as a result of the expansion. This will fall to 95% in 2017, 94% in 2018, 93% in 2019, and 90% in 2020 and thereafter (CBPP 2012). There are 27 states, including Washington DC, that have opted to expand their Medicaid program in 2014. For a summary of state Medicaid expansion plans, see: http://kff.org/medicaid/state-indicator/state-activity-around-expanding-medicaid-under-the-affordable-care-act/ (accessed May 15, 2014).</p>

<p id="source-note-2"><strong>2.</strong> Examples of national studies that estimate the impact of MMC on expenditures, utilization, and health outcomes include Duggan and Hayford (2013), Herring and Adams (2011), and Kaestner, Dubay, and Kenney (2005).</p>

<p id="source-note-3"><strong>3.</strong> These other California MMC birth outcomes studies include Duggan (2004), Baker, Schmitt, and Phibbs (2003), and Barham, Gertler, and Raube (2013). In addition, Hu, Chou, and Deily (2013) look at birth outcomes associated with MMC implementation in Pennsylvania.</p>

<p id="source-note-4"><strong>4.</strong> This section draws heavily from Bartosch and Haber (2004) and Marton, Yelowitz, and Talbert (2014).</p>

<p id="source-note-5"><strong>5.</strong> Yelowitz (1998) discusses the difficulties in valuing Medicaid coverage. Medicaid expenditure—used as a proxy for its value in a number of studies—is an interaction of reimbursement rates, medical services used, and the health composition of the underlying population.</p>

<p id="source-note-6"><strong>6.</strong> The Children’s Health Insurance Program (CHIP) provides public health insurance coverage for near poor, uninsured children whose families have income above Medicaid limits. For literature on CHIP premiums in Kentucky and other states, as well as other policies that raise the cost of participating, see: Kenney et al. (2006), Marton (2007), Marton and Talbert (2010), Marton, Ketsche, and Zhou (2010), and Wolfe and Scrivner (2005).</p>

<p id="source-note-7"><strong>7.</strong> The survey questions refer to health insurance coverage during the prior calendar year, but Swartz (1986) concludes that many responses in fact reflect coverage at the time of the interview.</p>

<p id="source-note-8"><strong>8.</strong> The CPS was redesigned in March 1995 (Swartz 1997). The questions were reordered, and additional questions were added to pick up state-specific means-tested health plans. Gilmer and Kronick (2009) note that the 1995 changes mainly affected coverage estimates for CHAMPUS and dependent coverage. All of our main results are from after the redesign. In addition, the CPS added a verification question for health insurance in 2000 (Nelson and Mills 2001).</p>

<p id="source-note-9"><strong>9.</strong> For interstate studies, see Buchmueller and DiNardo (2002), Aizer and Grogger (2003), Lo Sasso and Buchmueller (2004), Simon (2005), and Baicker and Chandra (2006).</p>

<p id="source-note-10"><strong>10.</strong> While the size of our sample of Kentuckians under age 18 in the nine years of the CPS being used in our analysis is sufficient for estimation, we should note that the CPS is designed to provide reliable estimates at the state level and the 12 largest MSAs. Thus, the CPS does not allow for reliable county level estimates, as not all counties are included in each year. This implies our sample may not be perfectly representative at the localized level of geography we focus on in our analysis. Data sets specifically designed to do within-state analysis do not have the combination of data on income and insurance coverage we require to answer our question of interest.</p>

<p id="source-note-11"><strong>11.</strong> Bollinger and Hirsch (2006) find that in the context of earnings in the CPS, coefficient bias due to the imperfect imputation is widespread and often severe. They suggest that a simple alternative is to exclude imputations, and base estimates on a respondent-only sample.</p>

<p id="source-note-12"><strong>12.</strong> Hamersma and Ünel (2013) examine entry and exit from Medicaid.</p>

<p id="source-note-13"><strong>13.</strong> Cutler and Gruber (1996) discuss this issue in their study of Medicaid coverage crowding out private coverage. On page 410, they explicitly state: “The increase in the Medicaid population plus the fall in private insurance need not sum to the effect on the uninsured because of coverage under other government programs and because individuals may have both Medicaid and private coverage in a given year.” Yelowitz (1995) also discusses this issue.</p>

<p id="source-note-14"><strong>14.</strong> We have also estimated all our models for children including additional controls, such as housing tenure, family size, family type, and educational attainment of the household head/spouse. All conclusions for MMC, both with respect to magnitude and significance, are unchanged with these additional controls.</p>

<p id="source-note-15"><strong>15.</strong> The managed care variable we constructed is measured at the group level, while the CPS data itself is at the individual level. Using an approach described in Madrian and Lefgren (2000), we created a child identifier to determine how many children are present multiple times in our sample. Out of 3286 observations, we have 2760 unique children. Following the recommendation of Cameron, Gelbach, and Miller (2011), we correct our standard errors for non-nested two way clustering, where we cluster on region-year and child identifier.</p>

<p id="source-note-16"><strong>16.</strong> The Kentucky Medicaid/CHIP eligibility cut offs between 1995 and 1997 were 185% FPL for infants, 133% FPL for children under age 6, and 100% FPL for children aged 6 and older. In 1998, this changed to 200% FPL for all children under age 19.</p>