# The short-run impacts of Connecticut's paid sick leave legislation

**Authors:** Thomas Ahn and Aaron Yelowitz  
**Citation:** Thomas Ahn and Aaron Yelowitz (2015). The short-run impacts of Connecticut's paid sick leave legislation. Applied Economics Letters. DOI: 10.1080/13504851.2015.1023934  


**Affiliation:** Department of Economics, University of Kentucky, Lexington, KY 40506, USA

**Corresponding author:** thomas.ahn@uky.edu

© 2015 Taylor & Francis.

Published online-first article. The source PDF uses article pages 1–6. Original tables and the displayed equation retain their published layout. [Read the source PDF](/files/publications/ay-ja-edate7kvi7aklvrv.pdf).  

## Abstract

In 2012, Connecticut became the first state to enact paid sick leave legislation. Using a difference-in-differences framework, we find the law had modest but negative effects on the labour market, particularly on the likelihood of working in the past week.

**Keywords:** paid sick leave; mandated benefits; difference-in-differences; fringe benefits; employment  
**JEL classification:** J33; J38; H75; I18; I12

## I. Introduction
Roughly 80% of low-wage workers in the US do not have access to paid sick leave. Commentators have noted that the US lags behind other countries by failing to mandate employers offer paid sick leave (Heymann et al., 2010). This proposition has been gaining popular and legislative support across many US cities and states. President Obama has called for a federal law to guarantee workers paid sick leave to recover from illness or care for sick family members (Obama, 2014).
Part of the appeal of paid sick leave is that it appears, at first glance, to be relatively painless. Most paid sick leave laws equate to very slight pay increases, and compared to labour reforms such as minimum-wage increases or employer-provided health insurance, impact is expected to be minor (Summers, 1989; Kolstad and Kowalski, 2014).
However, accommodating paid sick leave may not be a trivial increase in costs for employers. Changes in the law and subsequent absenteeism patterns will require adjustments in work schedules and HR policy. Monitoring costs may increase.<sup><a href="#source-note-1" aria-label="Source note 1">1</a></sup> The firm’s flexibility in the use of its work force may decline. These factors may lead to a greater-than anticipated reduction in labour demand. Whether there is an observable impact, of course, is an empirical question; however, greater care must be exercised to ensure that the empirical framework does not suffer from bias, as any impact is expected to be small.
We use the American Community Survey (ACS), a difference-in-differences approach, and the paid sick leave law enacted in Connecticut in 2012 to estimate the initial impacts of the mandate. This approach is attractive for three reasons. First, statewide implementation avoids concerns about overlapping labour markets, an issue present with citywide implementation (Ahn, 2011). Second, Connecticut is surrounded by similar states that serve as a control. Third, several nearby states will soon introduce paid sick leave, which dampens mobility responses across state borders. We find that the law increased unemployment by a modest amount.


In addition to evaluating unemployment numbers, we focus on labour force participation. Unemployment may arise due to decreased labour demand and increased labour supply. We estimate only small changes in labour force participation rate (LFPR), which, along with our negative employment effects, points to a sizable decrease in labour demand as a result of the law.
## II. Data
We use one-year samples of the 2009–2012 ACS Public Use Microdata Sample. The number of records contained in a one-year PUMS file is about 1% of the total in the nation.<sup><a href="#source-note-2" aria-label="Source note 2">2</a></sup> Unlike most surveys, respondents are required to participate in the ACS.<sup><a href="#source-note-3" aria-label="Source note 3">3</a></sup> To create the sample, we examine Connecticut and the five other states that comprise the New England region (Massachusetts, New Hampshire, Vermont, Rhode Island, and Maine).<sup><a href="#source-note-4" aria-label="Source note 4">4</a></sup>
The ACS asks labour force information on individuals aged 16 and older; we focus on individuals aged 16 to 64, excluding individuals who have imputed values on key demographic variables. We also exclude an individual from a particular regression if the pertinent response was imputed.<sup><a href="#source-note-5" aria-label="Source note 5">5</a></sup> We focus on three contemporaneous measures of work activity: work in the previous week, unemployment and labour force participation.<sup><a href="#source-note-6" aria-label="Source note 6">6</a></sup>
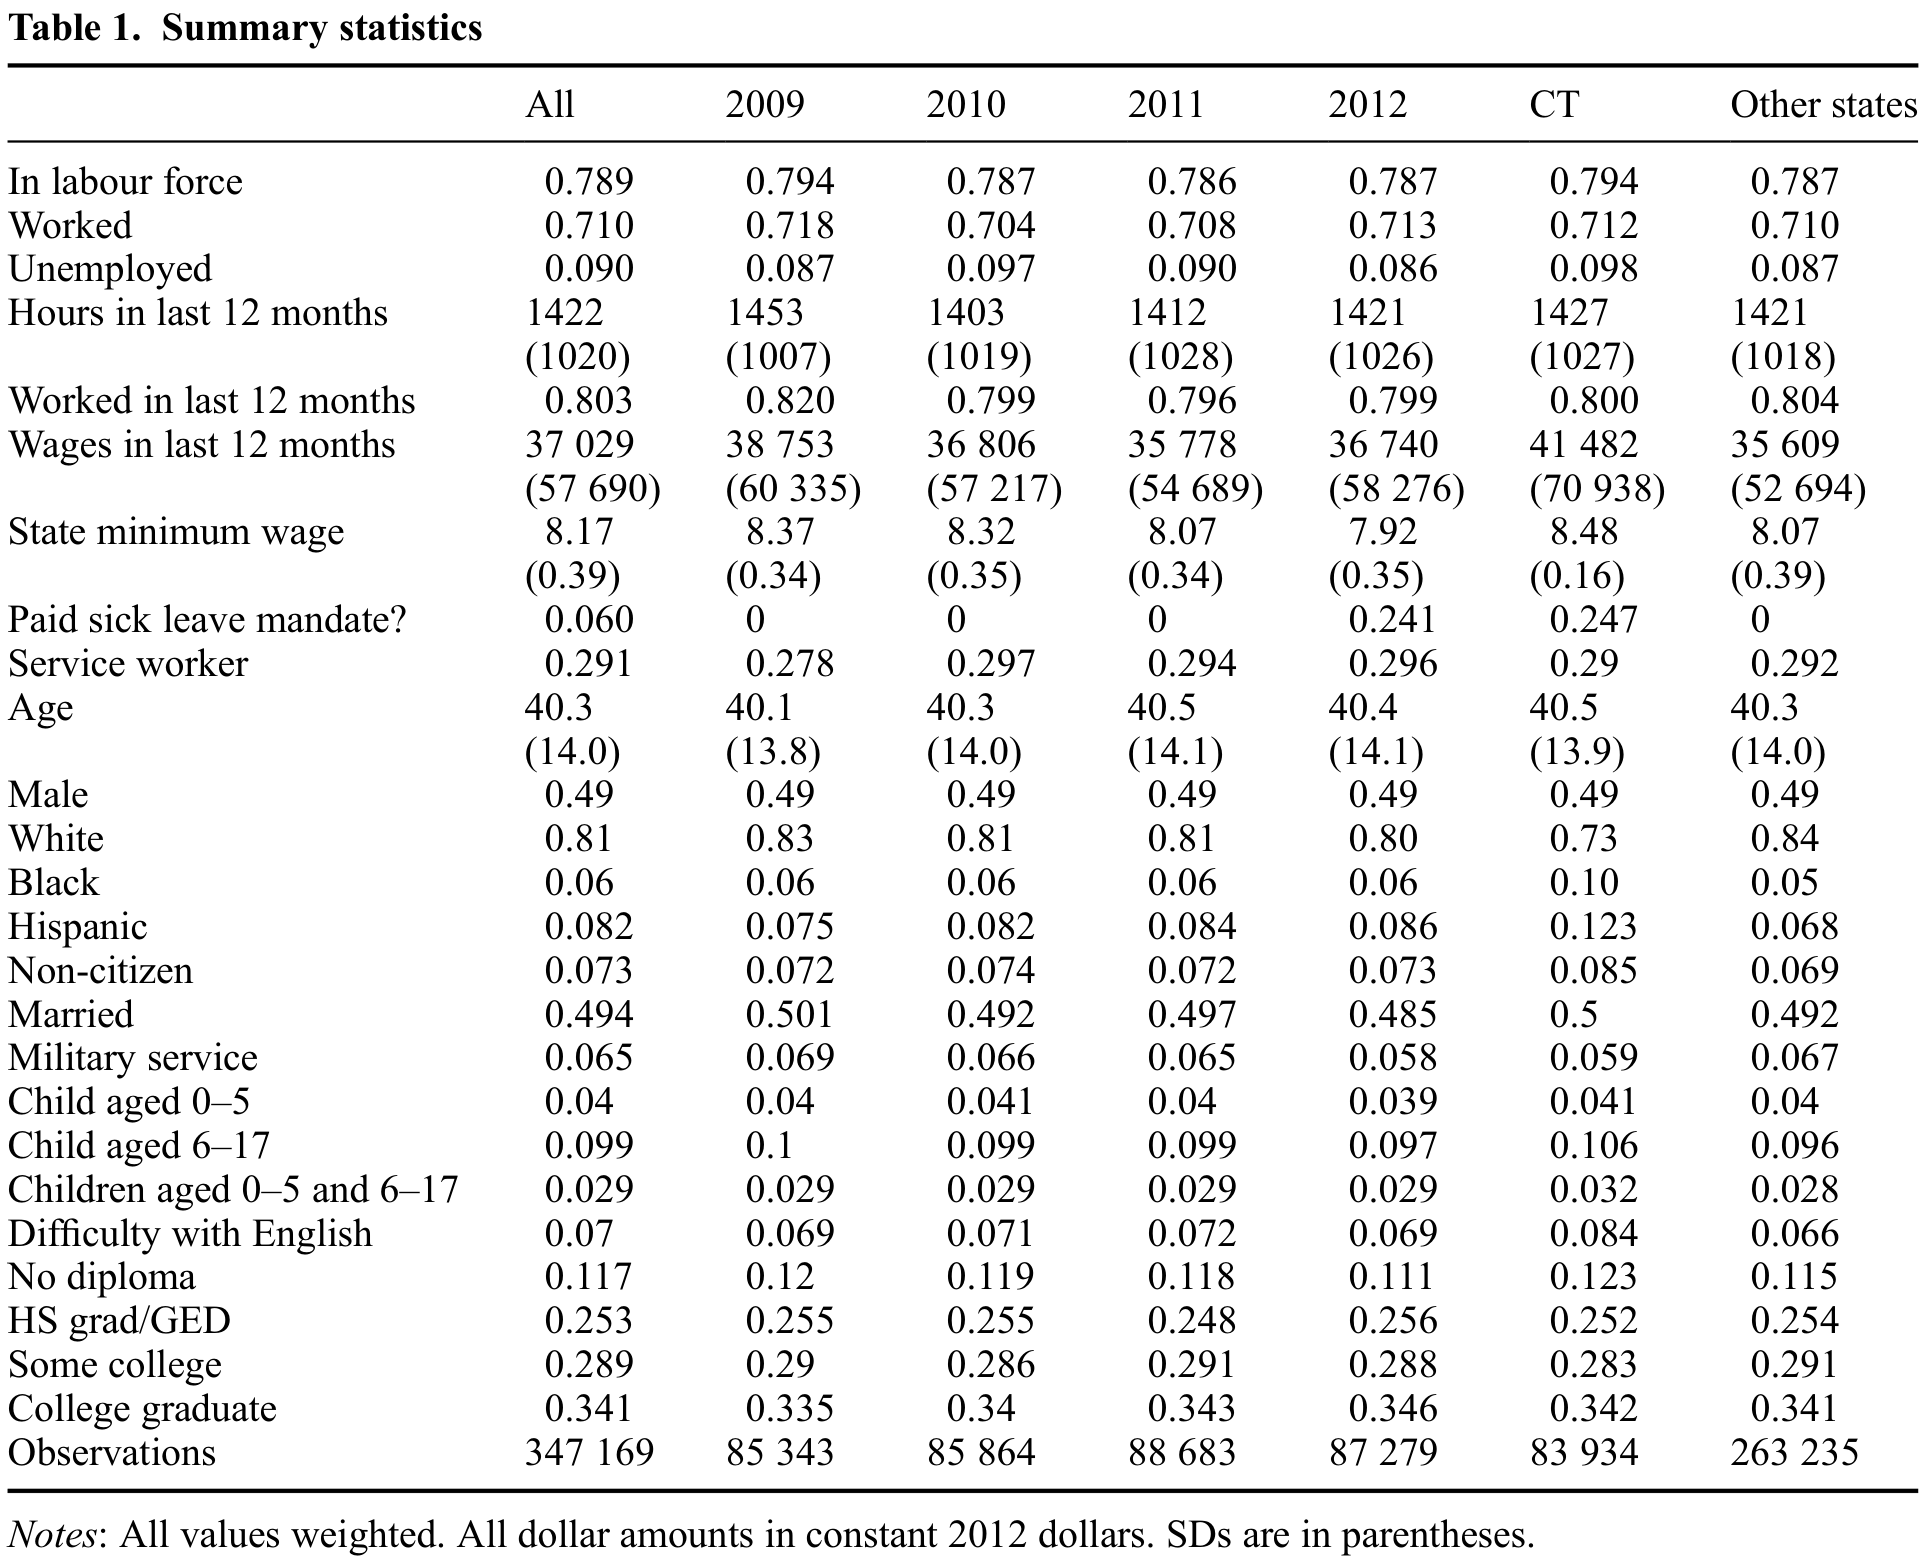
Table 1 presents summary statistics. In the full sample, there are more than 347 000 individuals. The typical respondent worked more than 1400 hours per year. More than three-quarters of the sample was in the labour force, and of those, 9% was unemployed. Approximately 37% of the sample has a high school diploma or less, more than 80% is white, and 7% is legal noncitizens. Labour market outcomes gradually improved over this period, as the economy was emerging from the Great Recession. The final two columns compare Connecticut to other New England states. Although many labour market variables are similar, annual wage income is higher in Connecticut. It also has a larger fraction minority and noncitizens. Among those who are working (or had worked in the past 5 years), nearly 30% are classified as service workers, the occupation targeted by the law.

### Table 1. Summary statistics

<figure class="article-figure" id="table-1"><a href="/files/publications/ay-ja-edate7kvi7aklvrv-assets/table-1.png"><img alt="Table 1. Weighted labor-market and demographic summary statistics for 2009–2012, comparing Connecticut with other states; standard deviations in parentheses." height="1568" loading="lazy" src="/files/publications/ay-ja-edate7kvi7aklvrv-assets/table-1.png" width="1924"/></a><figcaption>Table 1. <a href="/files/publications/ay-ja-edate7kvi7aklvrv-assets/table-1.png">Open full-resolution image</a>.</figcaption></figure>


## III. Description of the Connecticut Paid Sick Leave Law
Connecticut General Statute 31-57r mandates that large firms (50 or more employees) must offer paid sick leave to service workers beginning 1 January 2012. A worker accrues one hour of sick leave for every 40 hours worked, which equates to a 2.5% pay increase at most (if all sick leave hours are used). Workers cannot earn (or use) more than 40 hours of sick leave and are allowed to carry over a maximum of 40 hours from year to year. In 2012, no other New England state had a similar law in place.
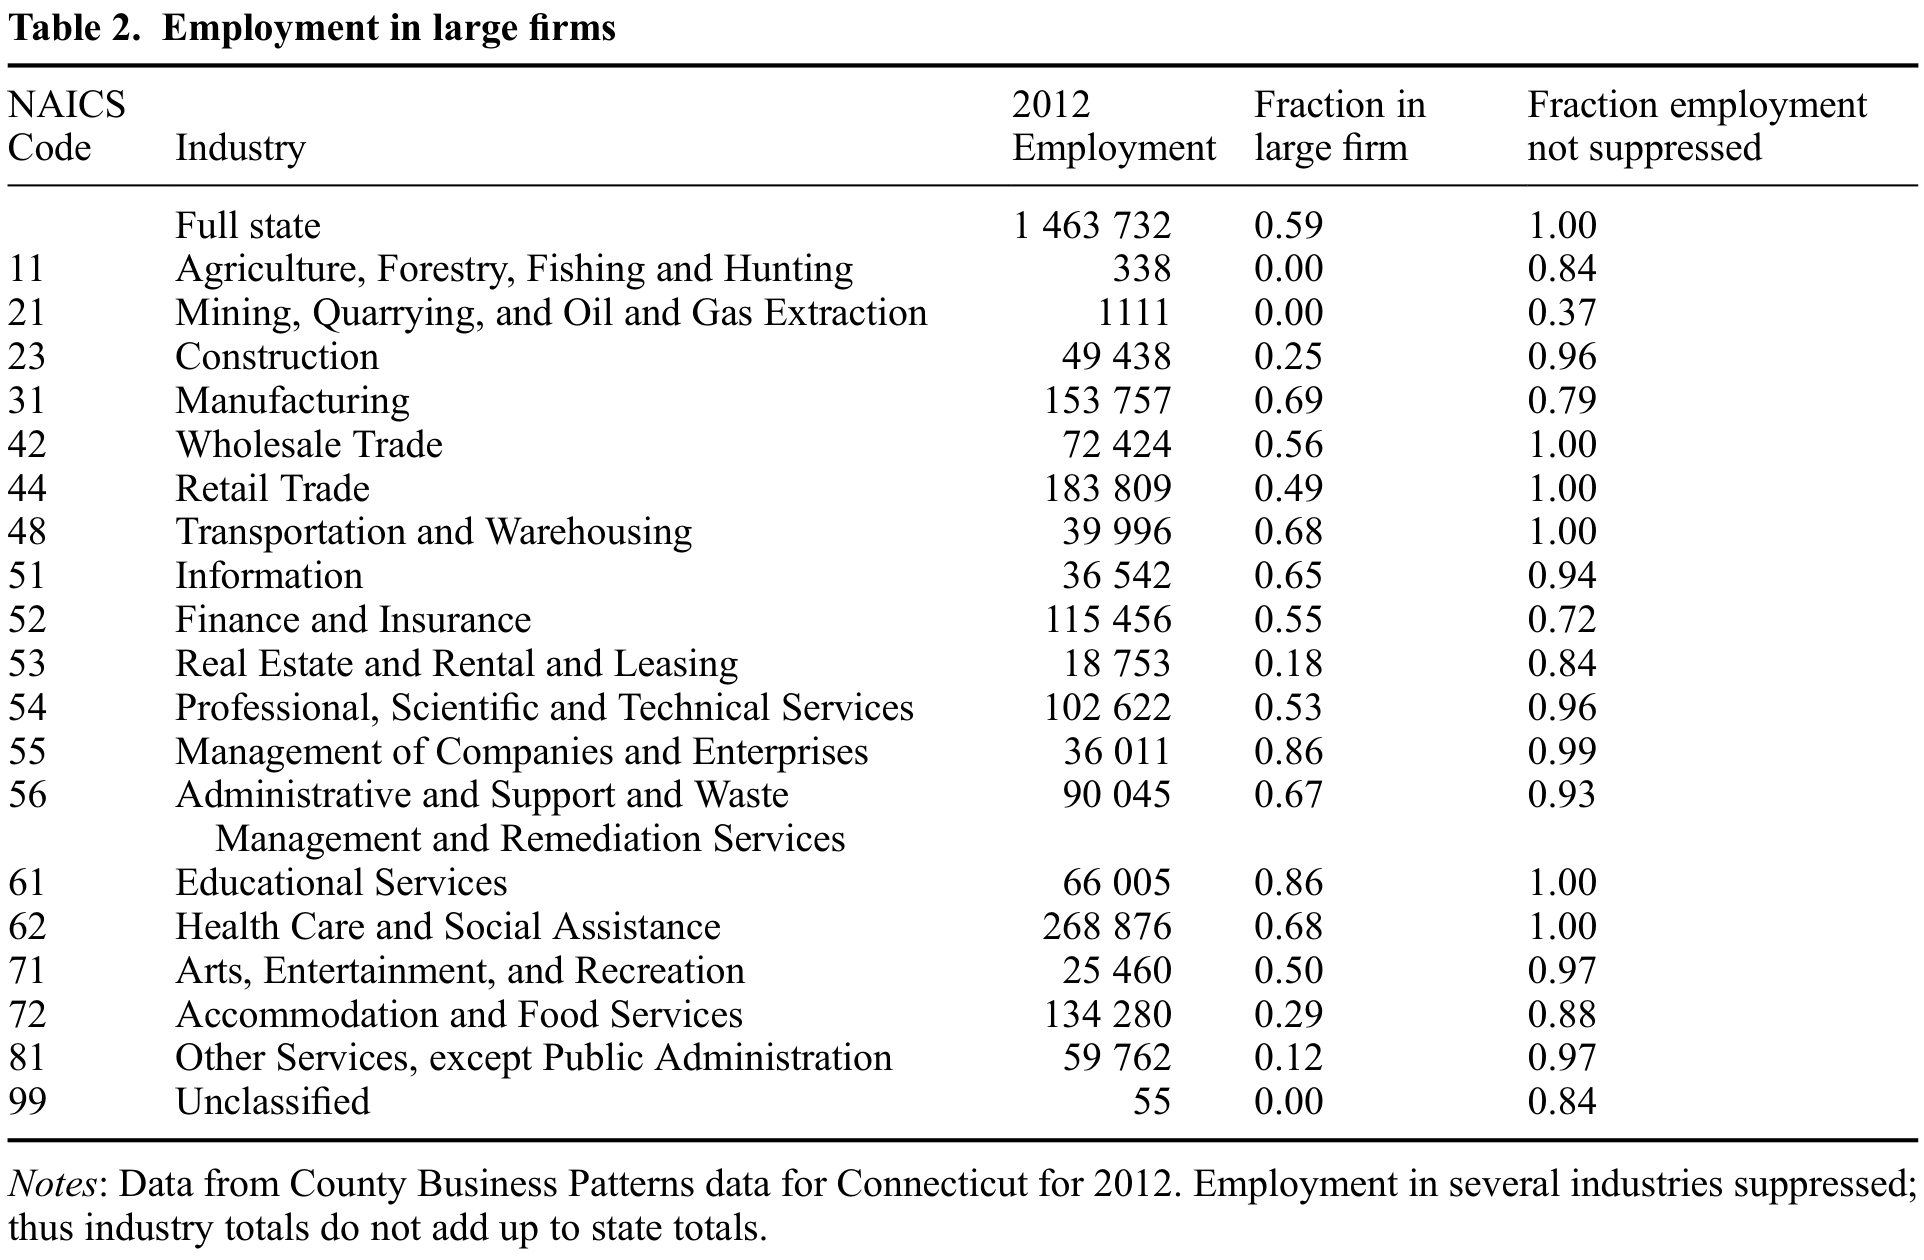
Table 2 shows – using County Business Patterns data for Connecticut in 2012 – the fraction of workers in each industry employed at large firms. The mandate would be expected to have large impacts on the ‘Educational Services,’ ‘Management of Companies and Enterprises,’ ‘Health Care and Social Assistance,’ ‘Administrative and Support,’ ‘Transportation and Warehousing,’ and ‘Information’ sectors. Although ‘Manufacturing’ should have many affected workers, this industry was exempt from the mandate.

### Table 2. Employment in large firms

<figure class="article-figure" id="table-2"><a href="/files/publications/ay-ja-edate7kvi7aklvrv-assets/table-2.png"><img alt="Table 2. Connecticut employment by NAICS industry in 2012, showing employment totals, fraction in large firms and fraction of employment not suppressed." height="1260" loading="lazy" src="/files/publications/ay-ja-edate7kvi7aklvrv-assets/table-2.png" width="1924"/></a><figcaption>Table 2. <a href="/files/publications/ay-ja-edate7kvi7aklvrv-assets/table-2.png">Open full-resolution image</a>.</figcaption></figure>


## IV. Empirical Analysis
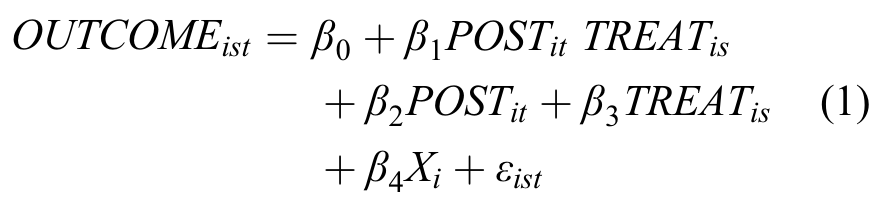
We rely on a ‘difference-in-differences’ estimator:

<figure class="article-figure" id="equation-1"><a href="/files/publications/ay-ja-edate7kvi7aklvrv-assets/equation-1.png"><img alt="Equation 1. Regression of an outcome on POST×TREAT, POST, TREAT, individual controls X and an error term, with coefficients beta zero through four." height="200" loading="lazy" src="/files/publications/ay-ja-edate7kvi7aklvrv-assets/equation-1.png" width="876"/></a><figcaption>Equation 1. <a href="/files/publications/ay-ja-edate7kvi7aklvrv-assets/equation-1.png">Open full-resolution image</a>.</figcaption></figure>


where <math xmlns="http://www.w3.org/1998/Math/MathML" display="inline"><mrow><msub><mrow><mi mathvariant="normal">O</mi><mi mathvariant="normal">U</mi><mi mathvariant="normal">T</mi><mi mathvariant="normal">C</mi><mi mathvariant="normal">O</mi><mi mathvariant="normal">M</mi><mi mathvariant="normal">E</mi></mrow><mrow><mi>i</mi><mi>s</mi><mi>t</mi></mrow></msub></mrow></math> is one of the contemporaneous labour market outcomes for individual <math xmlns="http://www.w3.org/1998/Math/MathML" display="inline"><mrow><mi>i</mi></mrow></math> in state <math xmlns="http://www.w3.org/1998/Math/MathML" display="inline"><mrow><mi>s</mi></mrow></math> in year <math xmlns="http://www.w3.org/1998/Math/MathML" display="inline"><mrow><mi>t</mi></mrow></math>, <math xmlns="http://www.w3.org/1998/Math/MathML" display="inline"><mrow><msub><mrow><mi mathvariant="normal">P</mi><mi mathvariant="normal">O</mi><mi mathvariant="normal">S</mi><mi mathvariant="normal">T</mi></mrow><mrow><mi>i</mi><mi>t</mi></mrow></msub><msub><mrow><mi mathvariant="normal">T</mi><mi mathvariant="normal">R</mi><mi mathvariant="normal">E</mi><mi mathvariant="normal">A</mi><mi mathvariant="normal">T</mi></mrow><mrow><mi>i</mi><mi>s</mi></mrow></msub></mrow></math> is the interaction term that proxies for Connecticut’s paid sick leave mandate, and <math xmlns="http://www.w3.org/1998/Math/MathML" display="inline"><mrow><msub><mi>X</mi><mi>i</mi></msub></mrow></math> is a set of characteristics that vary at the individual level. In various specifications, we include dummy variables for <math xmlns="http://www.w3.org/1998/Math/MathML" display="inline"><mrow><msub><mrow><mi mathvariant="normal">P</mi><mi mathvariant="normal">O</mi><mi mathvariant="normal">S</mi><mi mathvariant="normal">T</mi></mrow><mrow><mi>i</mi><mi>t</mi></mrow></msub></mrow></math> (or a set of year dummies), <math xmlns="http://www.w3.org/1998/Math/MathML" display="inline"><mrow><msub><mrow><mi mathvariant="normal">T</mi><mi mathvariant="normal">R</mi><mi mathvariant="normal">E</mi><mi mathvariant="normal">A</mi><mi mathvariant="normal">T</mi></mrow><mrow><mi>i</mi><mi>s</mi></mrow></msub></mrow></math> (or a set of state dummies), and state-year trends. By including state-year trends, we control for pre-existing trends that might be correlated with Connecticut’s sick leave law. In general, the inclusion of trends does not have a noticeable impact on the magnitude of our results, especially for ‘working last week.’ See Wolfers (2006) for a discussion of the difficulties of separating out pre-existing trends from dynamic effects of a policy shock. All specifications are estimated as linear models with weights, and SEs are corrected for with nonnested two-way clustering at the state and year levels (Cameron et al., 2011).
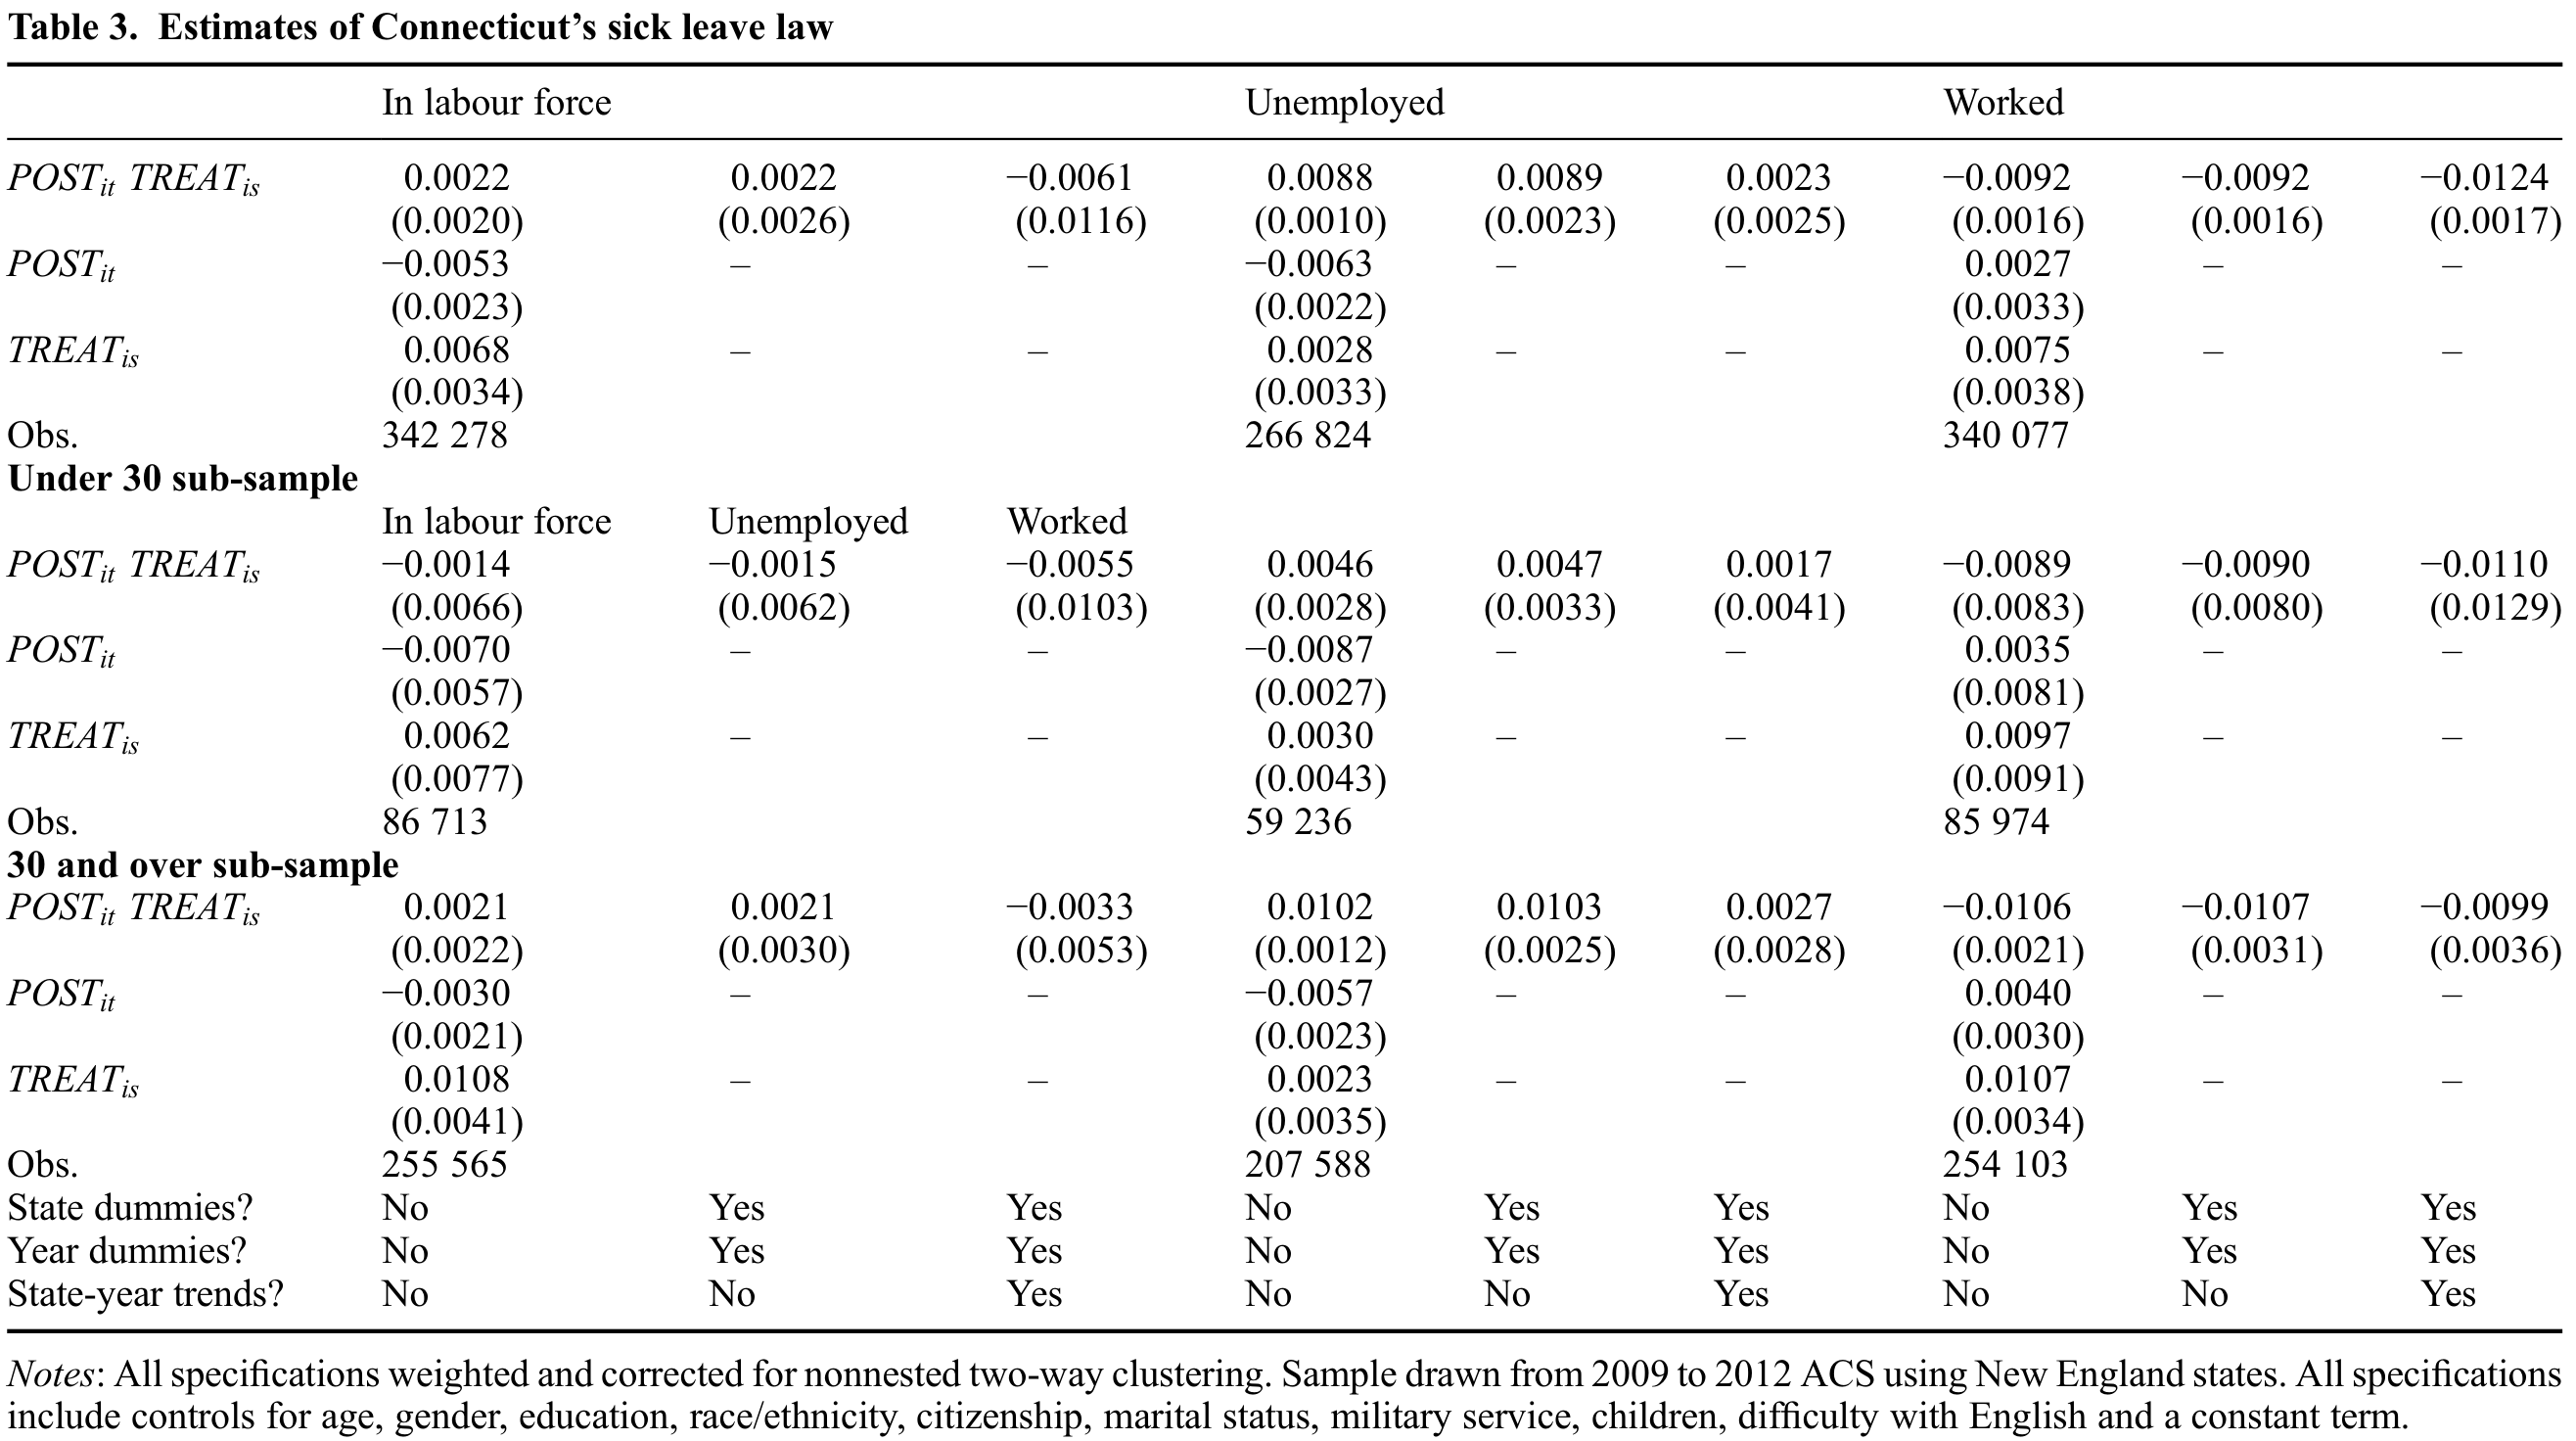
The results in Table 3 show that the sick leave law had negative economic consequences. The effect on labour supply is small; LFPR increases by 0.3%. It is imprecisely estimated and, at most, suggestive of a small number of marginal workers being induced to enter the labour force. Negative unemployment effects are remarkably robust to specifications and very precisely estimated.<sup><a href="#source-note-7" aria-label="Source note 7">7</a></sup> As a result of decreased labour demand (and not from increased competition from new labour market entrants), the fraction of unemployed workers increases by 0.9 percentage points. Because firms respond by reducing the number of vacancies, deadweight loss is positive. The likelihood of working decreases by a similar amount. At the bottom of Table 3, we separate the results by age (under 30 years /30 years and above), for several reasons. First, education may be incomplete for young workers. Second, sick leave is more valuable to those in poor health or those who have sick children, and older age proxies for this. Results suggest that older workers have a higher valuation of sick leave, and firms perceive older workers as more costly.<sup><a href="#source-note-8" aria-label="Source note 8">8</a></sup> Alternative specifications where we stratify the sample by gender and more age categories show that men aged 30 to 54 and women aged 40 to 54 are particularly hard hit by decreased labour demand. Unemployment increases for these groups by roughly 1.4 percentage points. Teenage workers who are mostly engaged in temporary, summer work are unaffected by changes in sick-leave policy. We also find that workers 55 years and older are not impacted. This may be because older workers may have already self-selected into companies (or advanced to positions) that offer more generous health benefits, including sick-leave.<sup><a href="#source-note-9" aria-label="Source note 9">9</a></sup>


### Table 3. Estimates of Connecticut’s sick leave law

<figure class="article-figure" id="table-3"><a href="/files/publications/ay-ja-edate7kvi7aklvrv-assets/table-3.png"><img alt="Table 3. Estimated effects of Connecticut’s sick-leave law on labor-force participation, unemployment and work, for the full sample and age subgroups; standard errors and specification controls included." height="1472" loading="lazy" src="/files/publications/ay-ja-edate7kvi7aklvrv-assets/table-3.png" width="2632"/></a><figcaption>Table 3. <a href="/files/publications/ay-ja-edate7kvi7aklvrv-assets/table-3.png">Open full-resolution image</a>.</figcaption></figure>


## V. Conclusion
We analysed the short-run impacts of Connecticut’s sick leave law and found a small decrease in employment concentrated on older workers. Although there are real labour market impacts, the magnitudes seem rather small to justify the level of political and popular interest in the policy.

It is important to acknowledge that our study examines the short-run impacts of Connecticut’s law. Indeed, given the retrospective nature of some of the ACS questions, we are unable to examine usual hours of work or wage rates for workers, because neither question is asked post-implementation. As a consequence, we cannot currently exploit the variation in Connecticut’s sick leave law with respect to how it treated service workers from nonservice workers, or workers in large firms from workers in small firms, both of which would allow for a ‘triple-differences’ specification. In addition, our results do not offer insight into long-run consequences. For instance, firms near state borders may relocate or adjust employee numbers/work hours. Firms in affected industries may also shift costs back to workers (Summers, 1989; Gruber, 1994). Our future work will examine these outcomes when data become available. The key market failure motivating paid sick leave laws is mitigating the spread of infectious disease. Given the modest labour market impacts, future studies should also examine whether such benefits have appeared.


### Supplemental Data
Supplemental data for this article can be accessed [here](https://doi.org/10.1080/13504851.2015.1023934).
## References
- Ahn, T. (2011) Distributional impacts of a local living wage increase with ability sorting, Economics Letters, 112, 283–6. doi:10.1016/j.econlet.2011.05.035
- Bollinger, C. R. and Hirsch, B. T. (2006) Match bias from earnings imputation in the current population survey: the case of imperfect matching, Journal of Labor Economics, 24, 483–519. doi:10.1086/504276
- Cameron, A. C., Gelbach, J. B. and Miller, D. L. (2011) Robust inference with multiway clustering, Journal of Business & Economic Statistics, 29, 238–49. doi:10.1198/jbes.2010.07136
- Gruber, J. (1994) The incidence of mandated maternity benefits, American Economic Review, 84, 622–41.
- Heymann, J., Rho, H. J., Schmitt, J. et al. (2010) Ensuring a healthy and productive workforce: comparing the generosity of paid sick day and sick leave policies in 22 countries, International Journal of Health Services, 40, 1–22.
- Kolstad, J. and Kowalski, A. (2014) Mandate-Based Health Reform and the Labor Market: evidence from the Massachusetts Reform, NBER Working Paper 17933.
- Obama, B. (2014) State of the Union Address. Available at http://www.washingtonpost.com/politics/full-text-of-obamas-2014-state-of-the-union-address/2014/01/28/e0c93358-887f-11e3-a5bd-844629433ba3_story.html (accessed 26 August 2014).
- Summers, L. (1989) Some simple economics of mandated benefits, American Economic Review, 79, 177–84.
- Wolfers, J. (2006) Did unilateral divorce laws raise divorce rates? A reconciliation and new results, American Economic Review, 96, 1802–20. doi:10.1257/aer.96.5.1802
- Ziebarth, N. R. and Karlsson, M. (2010) A natural experiment on sick pay cuts, sickness absence, and labor costs, Journal of Public Economics, 94, 1108–22. doi:10.1016/j.jpubeco.2010.09.001
- Ziebarth, N. R. and Karlsson, M. (2014) The effects of expanding the generosity of the statutory sickness insurance system, Journal of Applied Econometrics, 29, 208–30. doi:10.1002/jae.2317

## Notes

<p id="source-note-1"><strong>1.</strong> Other studies of changes in mandated sick leave benefits in Germany show that employees may use more generous benefits as a means to shirk work. See Ziebarth and Karlsson (2010) and Ziebarth and Karlsson (2014).</p>

<p id="source-note-2"><strong>2.</strong> http://www.census.gov/acs/www/data_documentation/public_use_microdata_sample/</p>

<p id="source-note-3"><strong>3.</strong> http://www.census.gov/acs/www/Downloads/language_brochures/ACSQandA_ENG10.pdf</p>

<p id="source-note-4"><strong>4.</strong> We also estimate our models with an alternate control: New York and New Jersey. Results are qualitatively similar to results with New England states. See Supplementary Tables 1 and 2 at sites.google.com/site/tomsyahn/</p>

<p id="source-note-5"><strong>5.</strong> This follows Bollinger and Hirsch (2006).</p>

<p id="source-note-6"><strong>6.</strong> The ACS contains annual measures of work, but we cannot use them in the analysis because the answers mostly pertain to the period before the sick leave law.</p>

<p id="source-note-7"><strong>7.</strong> If we include state and year fixed effects, state-year trends, individual demographic characteristics, and the state minimum wage, results become statistically insignificant. See Supplementary Table 3.</p>

<p id="source-note-8"><strong>8.</strong> See supplementary material for a simple theory model.</p>

<p id="source-note-9"><strong>9.</strong> See Supplementary Table 4 for complete results.</p>