# Racial disparities in life insurance coverage

**Authors:** Timothy F. Harris and Aaron Yelowitz  
**Citation:** Applied Economics, 50(1), 2018, 94–107. DOI: 10.1080/00036846.2017.1319562  

**Affiliation:** Department of Economics, University of Kentucky, Gatton School of Business and Economics, Lexington, KY, USA.

**Corresponding author:** Aaron Yelowitz, aaron@uky.edu.

© 2017 Informa UK Limited, trading as Taylor & Francis Group.

Published article, Applied Economics 50(1), pp.94–107. Original tables, figure and displayed equations retain their published layout. [Read the published PDF](/files/publications/ay-ja-dt3mhtypba24yav3.pdf).

## Abstract

We evaluate the extent to which there are racial disparities in life insurance coverage using multiple years of the Survey of Income and Program Participation between 2001 and 2010. We find that African Americans hold significantly more life insurance – especially whole life insurance – after controlling for other factors. We demonstrate that our findings diverge from prior work because we examine all households instead of focusing exclusively on married and cohabitating households. Although earning shocks due to mortality likely contribute to racial disparities in wealth, the influence is mitigated by the racial composition of life insurance holdings.

**Keywords:** Life insurance; racial disparities  
**JEL classification:** D31; G22; J15


## I. Introduction
Median net worth of white households is an order of magnitude larger than that of black households.<sup><a href="#source-note-1" aria-label="Source note 1">1</a></sup> Large differences in wealth remain even after controlling for confounding factors such as earnings or family structure (Choudhury 2001; Barsky et al. 2002; Altonji and Doraszelski, 2005). The racial wealth gap has persisted over time, and the Great Recession widened it to the highest level in 30 years (Pfeffer, Danziger, and Schoeni 2013; Kochhar and Fry 2014). Possible explanations for this wealth gap include differential saving behaviour, asset composition and bequests (Smith 1995; Menchik and Jianakoplos 1997; Choudhury 2001; Even and Macpherson 2003; Gittleman and Wolff 2004; Kochhar and Fry 2014; Kuan, Cullen, and Modrek 2015)

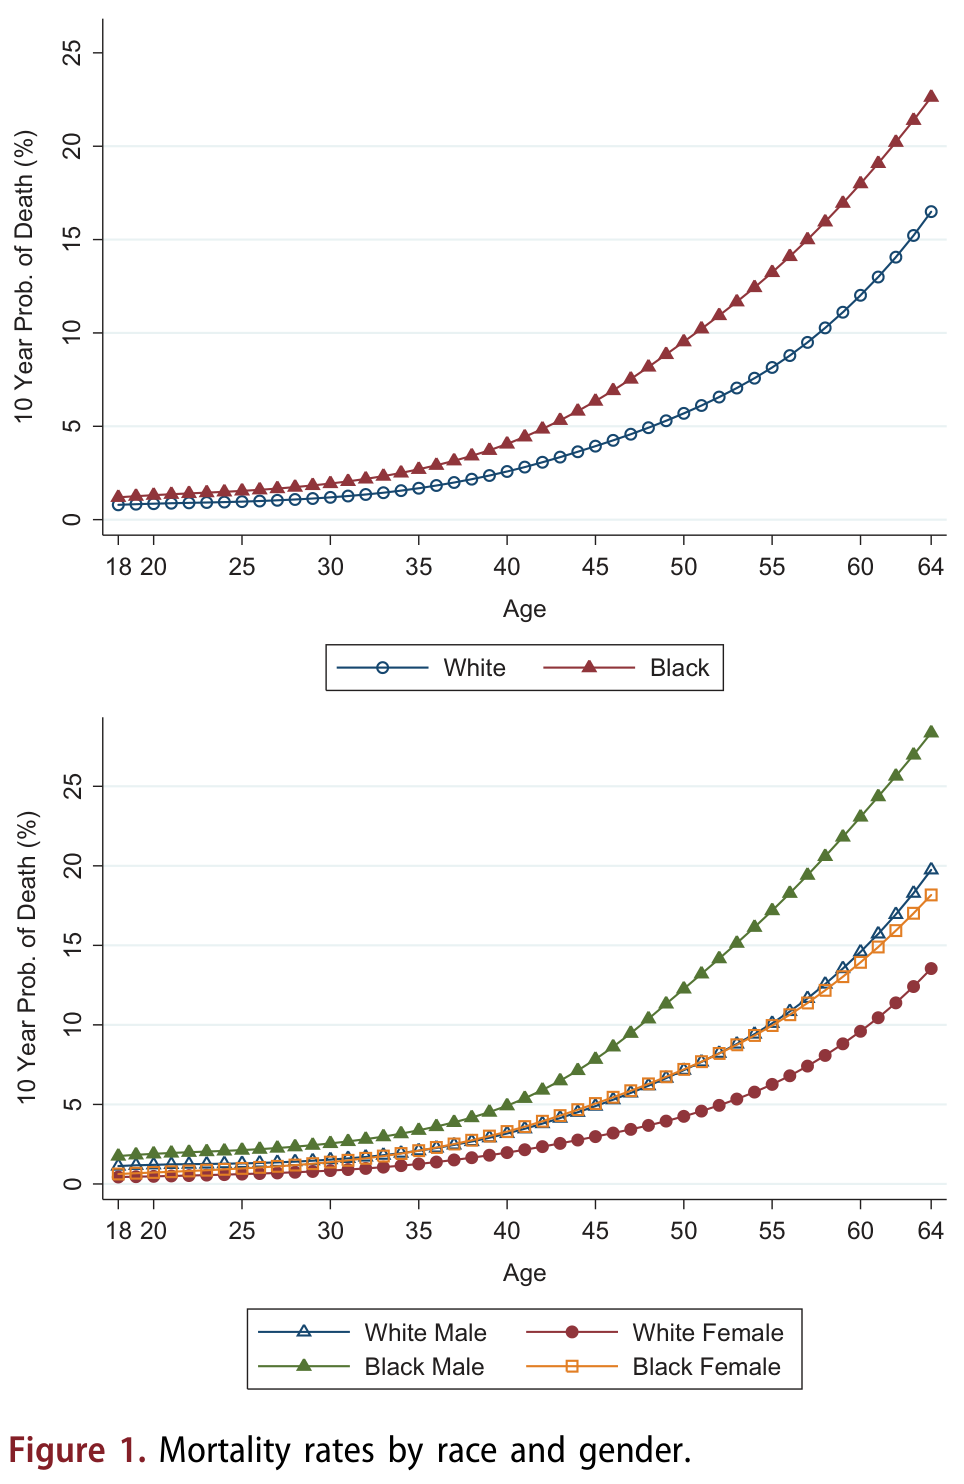
Another possible contributing factor for the black–white wealth gap – one that is ignored in existing work – is the consequence of black–white differences in mortality prior to retirement.<sup><a href="#source-note-2" aria-label="Source note 2">2</a></sup> Early death increases poverty through lost earnings of a breadwinner and end-of-life expenses (Attanasio and Hoynes 2000; McGarry and Schoeni 2005). Figure 1 illustrates these stark differences in mortality.<sup><a href="#source-note-3" aria-label="Source note 3">3</a></sup> Approximately 6% of all 50-year-olds die before
age 60. The 10-year mortality rate at age 50 is nearly 70% higher for blacks relative to whites.<sup><a href="#source-note-4" aria-label="Source note 4">4</a></sup> More than 12% of black males die within this age span, double the rate in the entire population. Similar racial differences emerge at both younger and older ages.

Large negative earnings shocks such as early death can lead households to make financial errors or suboptimal choices, which in turn affects subsequent wealth accumulation (Bertrand, Mullainathan, and Shafir 2004; Mullainathan and Shafir 2013). However, the differences in pre-retirement mortality will not necessarily influence the wealth gap because households can purchase life insurance to hedge against a breadwinner’s lost earnings from pre-retirement death. Among households with life insurance, those experiencing early death would receive a payout, making them far less likely to make costly financial choices, such as carrying balances on credit cards, using payday loans or being unbanked. Although a voluntary purchase, life insurance ownership is widespread, with 59% of adults having coverage in 2010 (Prudential 2013). Life insurance coverage is more prevalent where
the consequences from death of a breadwinner are greater. For example, 71% of married individuals with a child and mortgage have coverage in comparison to just 27% for individuals who are single, childless and rent apartments. All else equal, if black individuals purchase less life insurance coverage relative to whites, then the wealth gap would be exacerbated by differential mortality risk. Conversely, if black individuals respond to increased mortality risk by holding proportionately more life insurance, then mortality differences should not cause wealth gaps.


### Figure 1. Mortality rates by race and gender

<figure class="article-figure" id="figure-1"><a href="/files/publications/ay-ja-dt3mhtypba24yav3-assets/figure-1.png"><img alt="Figure 1. Ten-year probability of death by age 18–64; upper panel compares white and black adults, and lower panel separates race and sex, with labeled series and percentage axes." height="1484" loading="lazy" src="/files/publications/ay-ja-dt3mhtypba24yav3-assets/figure-1.png" width="964"/></a><figcaption>Figure 1. <a href="/files/publications/ay-ja-dt3mhtypba24yav3-assets/figure-1.png">Open full-resolution image</a>.</figcaption></figure>

**Caption:** Mortality rates by race and gender.

The purpose of our study is to explore the existence of racial gaps in life insurance holdings. Although several recent empirical studies have analysed demand for, and adverse selection in, life insurance (Cawley and Philipson 1999; He 2009; 2011; Harris and Yelowitz 2014; Hedengren and Stratmann 2016; Harris 2017), only the work of Bernheim et al. (2003) and Gutter and Hatcher (2008) examine racial disparities in life insurance coverage. Douglas et al. (2003) find that nonwhites are less likely to hedge against the
financial consequences of a spouse’s death through life insurance.<sup><a href="#source-note-5" aria-label="Source note 5">5</a></sup> Gutter and Hatcher (2008) find no disparities in life insurance ownership on the extensive margin (whether the household has any life insurance holdings) and some evidence of disparities on the intensive margin (face value of coverage). An important limitation to both studies is that they restrict attention to married or cohabitating households/individuals. This type of restriction misses a significant variation, as family structure drastically differs across race. In 2010, of those that were ever married, 19% of whites were divorced in comparison to 31% of blacks. In addition, blacks were almost twice as likely as whites to be single parents (i.e. separated, divorced, widowed or never married with children).<sup><a href="#source-note-6" aria-label="Source note 6">6</a></sup> Given the family structure
differences, these studies limited a disproportionate amount of black individuals who would have reason to purchase life insurance.

In contrast to both studies, we find that blacks have greater participation in life insurance markets after controlling for other confounding characteristics. Given the high levels of life insurance coverage, our basic finding suggests that differential mortality is less likely to contribute to racial wealth disparities. Using multiple years of the survey of income and program participation (SIPP), our preferred specification estimates that blacks are 2 percentage points more likely to hold life insurance, from an overall baseline coverage rate of roughly 60%. Digging deeper, we find that black individuals are much more likely to hold whole life insurance and slightly less likely to hold term life coverage. In addition, they have higher participation in employer-sponsored life insurance (ESLI). We show that
a key reason our life insurance findings contrast with previous work is that we include single-headed households, while existing studies restrict analysis to married and cohabitating households.

The remainder of the article is organized as follows: Section II describes the data and structure of life insurance, Section III presents the empirical model, Section IV discusses results, Section V reconciles our results with previous studies and Section VI concludes.


## II. Data
For our primary analysis, we use data from the 2001, 2004 and 2008 panels of the SIPP to examine racial differences in life insurance holdings. These data have been used in recent studies on demand for life insurance (Harris and Yelowitz 2014; Hedengren and Stratmann 2016; Harris 2017). This nationally representative longitudinal sample is constructed through individual interviews in four-month intervals known as ‘waves’. Each wave contains responses regarding income, labour force activity and participation in government assistance programmes. In addition to the ‘core’ monthly questions, the survey covers less-frequently asked subjects in ‘topical modules’. The wealth topical modules contain information on assets and liabilities including life insurance holdings. The key motivations for using the SIPP include a broad age cohort, individual-level responses, large sample sizes
and information on source of life insurance.

We restrict our analysis to white and African American adults aged 18–64 who provided answers to life insurance questions.<sup><a href="#source-note-7" aria-label="Source note 7">7</a></sup> The age restriction is implemented to focus on the group that is the most likely to elect life insurance coverage. Additionally, this restriction is meant to include only those of working-age population, as the primary role of life insurance is to replace lost earnings of the principal breadwinner.

To compare our results with those from Gutter and Hatcher (2008), we apply similar screens to data from the survey of consumer finances (SCF) for years 2001, 2004, 2007, 2010 and 2013. The SCF is a triennial survey sponsored by the Board of Governors of the Federal Reserve System in cooperation with the Statistics of Income Division of the Internal Revenue Service. The survey collects detailed information about family finances including life insurance, income, net worth and credit use in addition to basic demographics including marital status and education. The SCF is widely used to study issues where wealth and financial data are important, and oversamples high-income individuals in order to capture the full distribution of wealth
(Kennickell 2008).<sup><a href="#source-note-8" aria-label="Source note 8">8</a></sup> Notwithstanding the prevalence of SCF in life insurance analysis (e.g. Lin and Grace 2007; Liebenberg, Carson, and Dumm 2012), the sample is limited to observing participation and levels of life insurance holdings at the household level. This is problematic because life insurance is priced and purchased at the individual level and not as a household. Thus, it is not possible to conclusively link a life insurance policy to the main breadwinner versus a secondary earner.

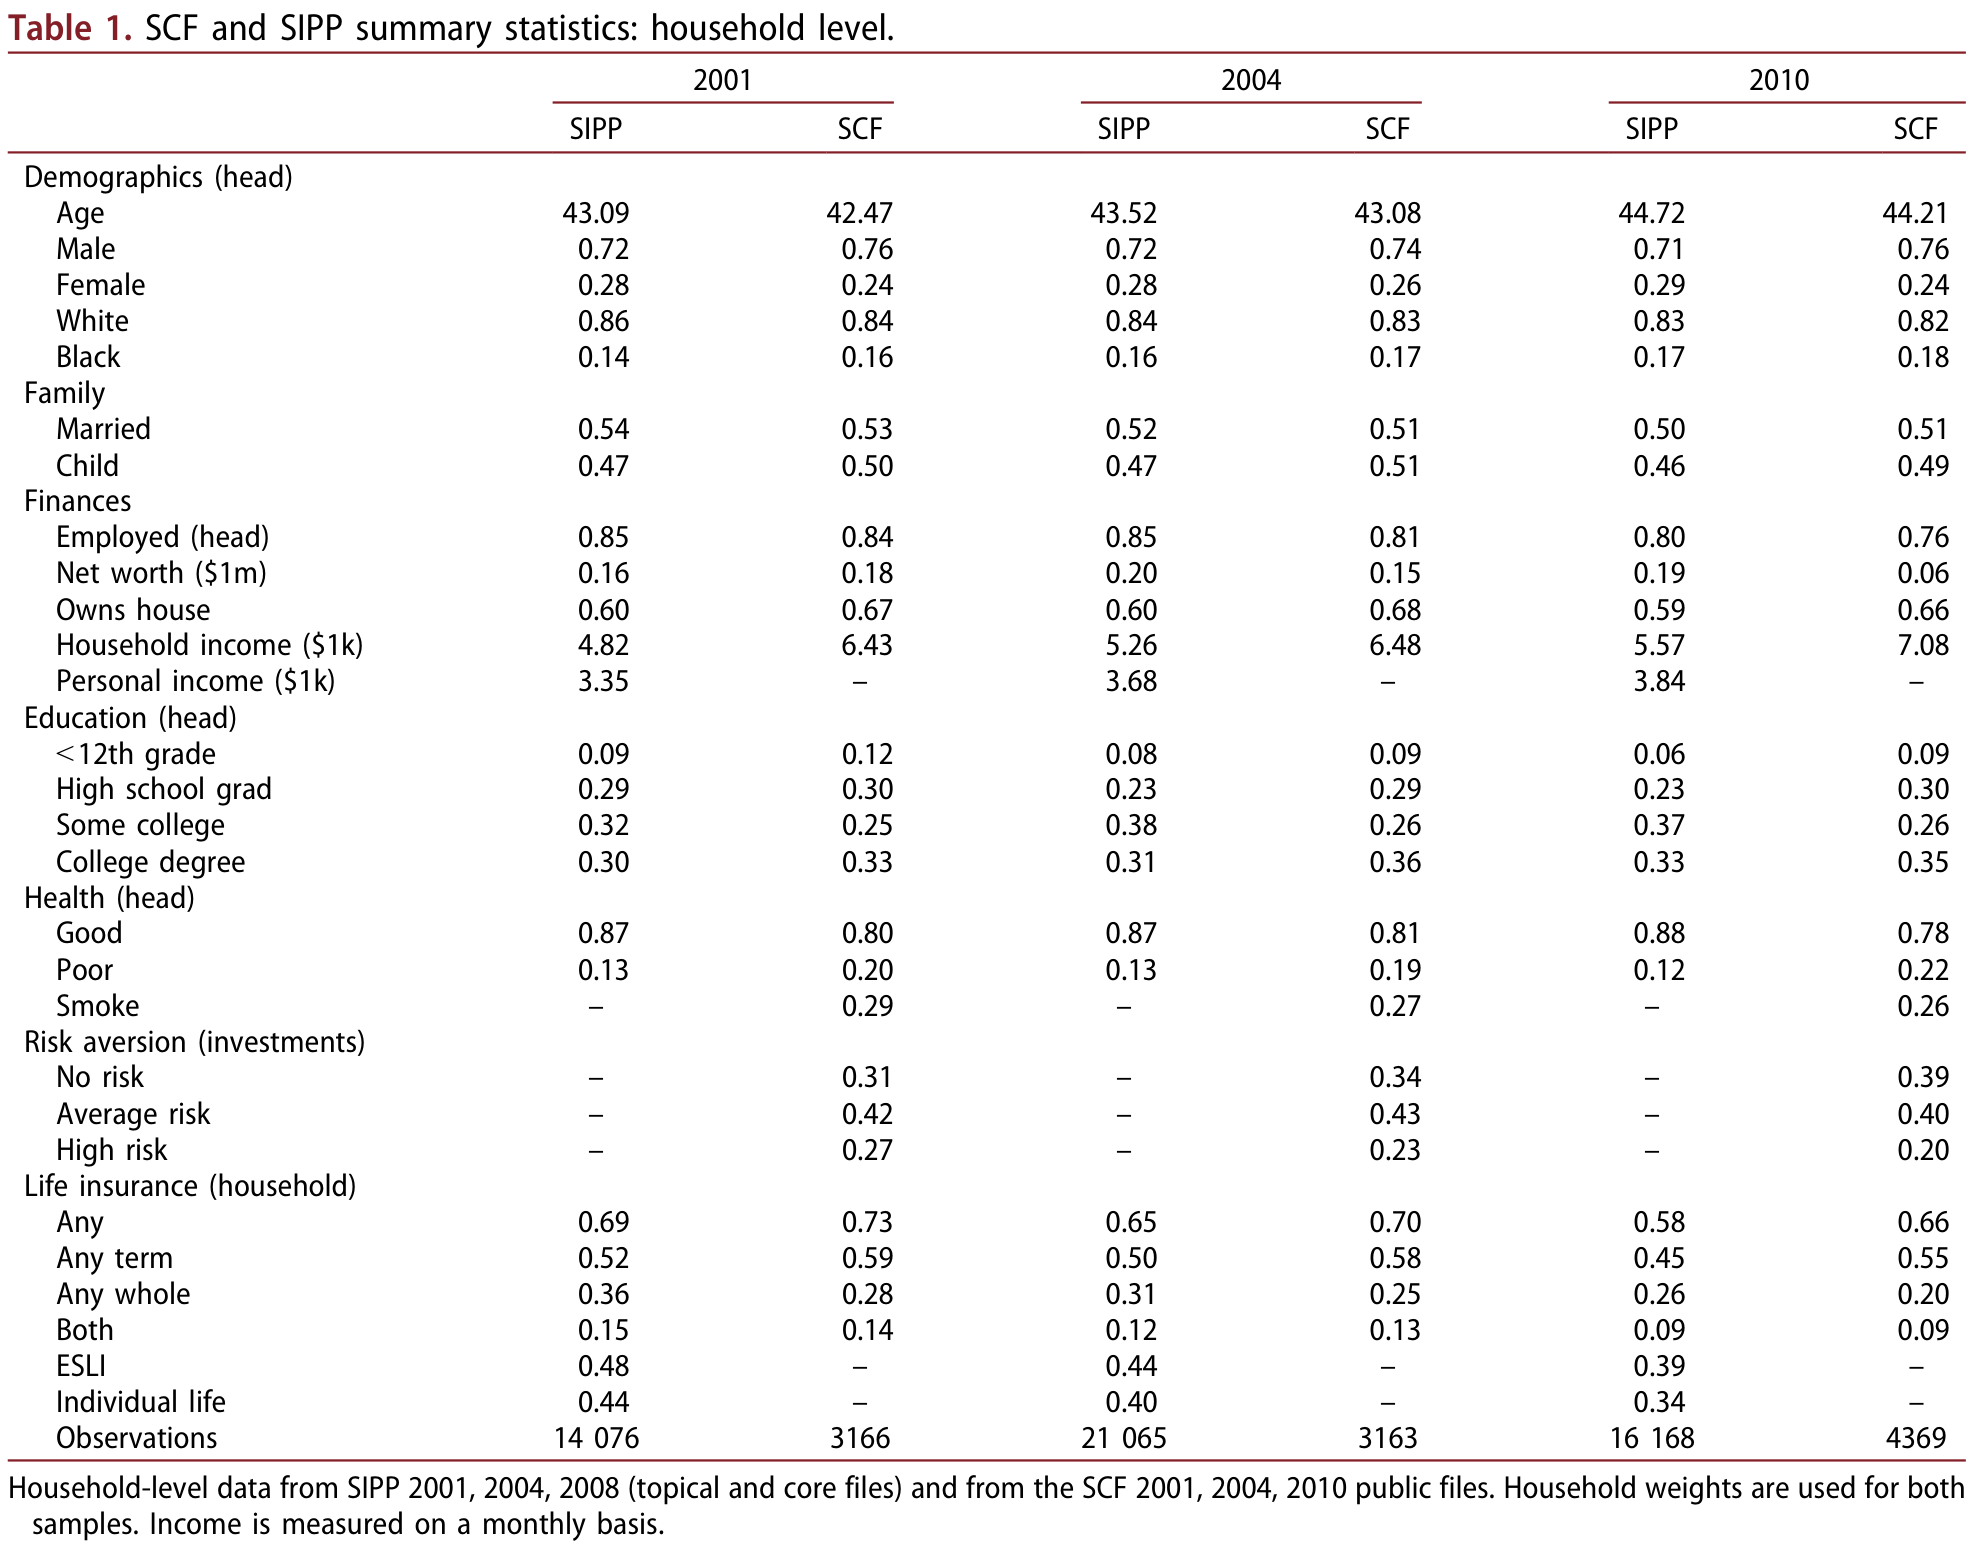
The two data sets directly overlap for calendar years 2001, 2004 and 2010, which allows for a side-by-side comparison. We aggregate the SIPP from the individual level to the household level in Table 1 to make it comparable with the SCF. However, in the subsequent regression analysis, we utilize the individual-level SIPP data to better link life insurance demand to underlying mortality risk.<sup><a href="#source-note-9" aria-label="Source note 9">9</a></sup> Table 1 shows that the samples are generally quite similar with respect to family structure, racial representation, finances, employment, education and health. Several important variables are only available in one of the two data sets; the SIPP includes specific questions about ESLI and individual life insurance, while the SCF asks about risk aversion and smoking.

As can be seen in this table, life insurance ownership is quite common, with roughly 65% of households having some kind of plan. These levels are very similar to the findings by life insurance industry groups (e.g. LIMRA 2013). An important trend that is prevalent across both data sets is the decline in life insurance over time. There are 11 and 7 percentage point decreases in life insurance coverage, respectively, for the SIPP and SCF samples from 2001 to 2010. Similar declining trends are present for term, whole, employer-sponsored and individual life insurance. These declines are consistent with the industry-level findings that ownership of life insurance is at a 50-year low (Prudential 2013). Households are far more likely to hold term life insurance than whole life
insurance. In addition, ESLI is slightly more prevalent than individual life coverage.


The SIPP explicitly asks about ESLI and total life insurance coverage. The difference between total and ESLI holdings allows us to infer individual life insurance holdings.<sup><a href="#source-note-10" aria-label="Source note 10">10</a></sup> ESLI constitutes a large portion of all life insurance holdings with 39% of households having ESLI in 2010. In contrast to other types of life insurance, ESLI is often provided automatically for full-time workers. The National Compensation Survey conducted by the Bureau of Labor Statistics reports that for full-time civilian workers in 2010, 76% had access to ESLI and 74% participated, leading to a takeup rate of 97%.<sup><a href="#source-note-11" aria-label="Source note 11">11</a></sup> Take-up is extraordinarily high because fewer than 10% of workers at firms with basic life insurance coverage are required to make a contribution. In the case of death, slightly more than half of
all workers (54%) with ESLI would receive a benefit payment in a fixed multiple of annual earnings for their beneficiaries, while almost all the rest would receive a flat dollar amount (40%). Many policies provide a flat dollar amount of $50 000 or less because of the tax exemptions.<sup><a href="#source-note-12" aria-label="Source note 12">12</a></sup> The median payout for a flat-dollar policy was just $16 000 in 2010 – which might be thought of as covering funeral expenses and other short-run costs, and the 90th percentile was $50 000.

Of the employer policies that provide benefits as a multiple of annual earnings, 58% of workers have a plan with 1× earnings, and almost all the rest (37%) have a plan with 1 –2× earnings. Consequently, even though ESLI is quite prevalent, it tends to provide small amounts of insurance coverage.

In addition to mandatory coverage, ESLI policies often allow employees to purchase supplemental coverage, although evidence suggests that many employees do not take advantage of this.<sup><a href="#source-note-13" aria-label="Source note 13">13</a></sup> These policies are typically community rated, meaning they are priced based on group rather than individual characteristics. In contrast, individual life insurance premiums are individually underwritten consisting of health examinations, blood samples, family history and assessment of risky behaviour (although such applications do not ask about race).

### Table 1. SCF and SIPP summary statistics: household level

<figure class="article-figure" id="table-1"><a href="/files/publications/ay-ja-dt3mhtypba24yav3-assets/table-1.png"><img alt="Table 1. Household-level SIPP and Survey of Consumer Finances summary statistics for 2001, 2004 and 2010, covering demographics, finances, health, risk aversion and life insurance types." height="1544" loading="lazy" src="/files/publications/ay-ja-dt3mhtypba24yav3-assets/table-1.png" width="1976"/></a><figcaption>Table 1. <a href="/files/publications/ay-ja-dt3mhtypba24yav3-assets/table-1.png">Open full-resolution image</a>.</figcaption></figure>


Consequently, ESLI policies are relatively better for employees in worse health as they pay premiums based on the entire pool of employees. A major limitation with ESLI is that employees generally only qualify for the coverage while they are employed.

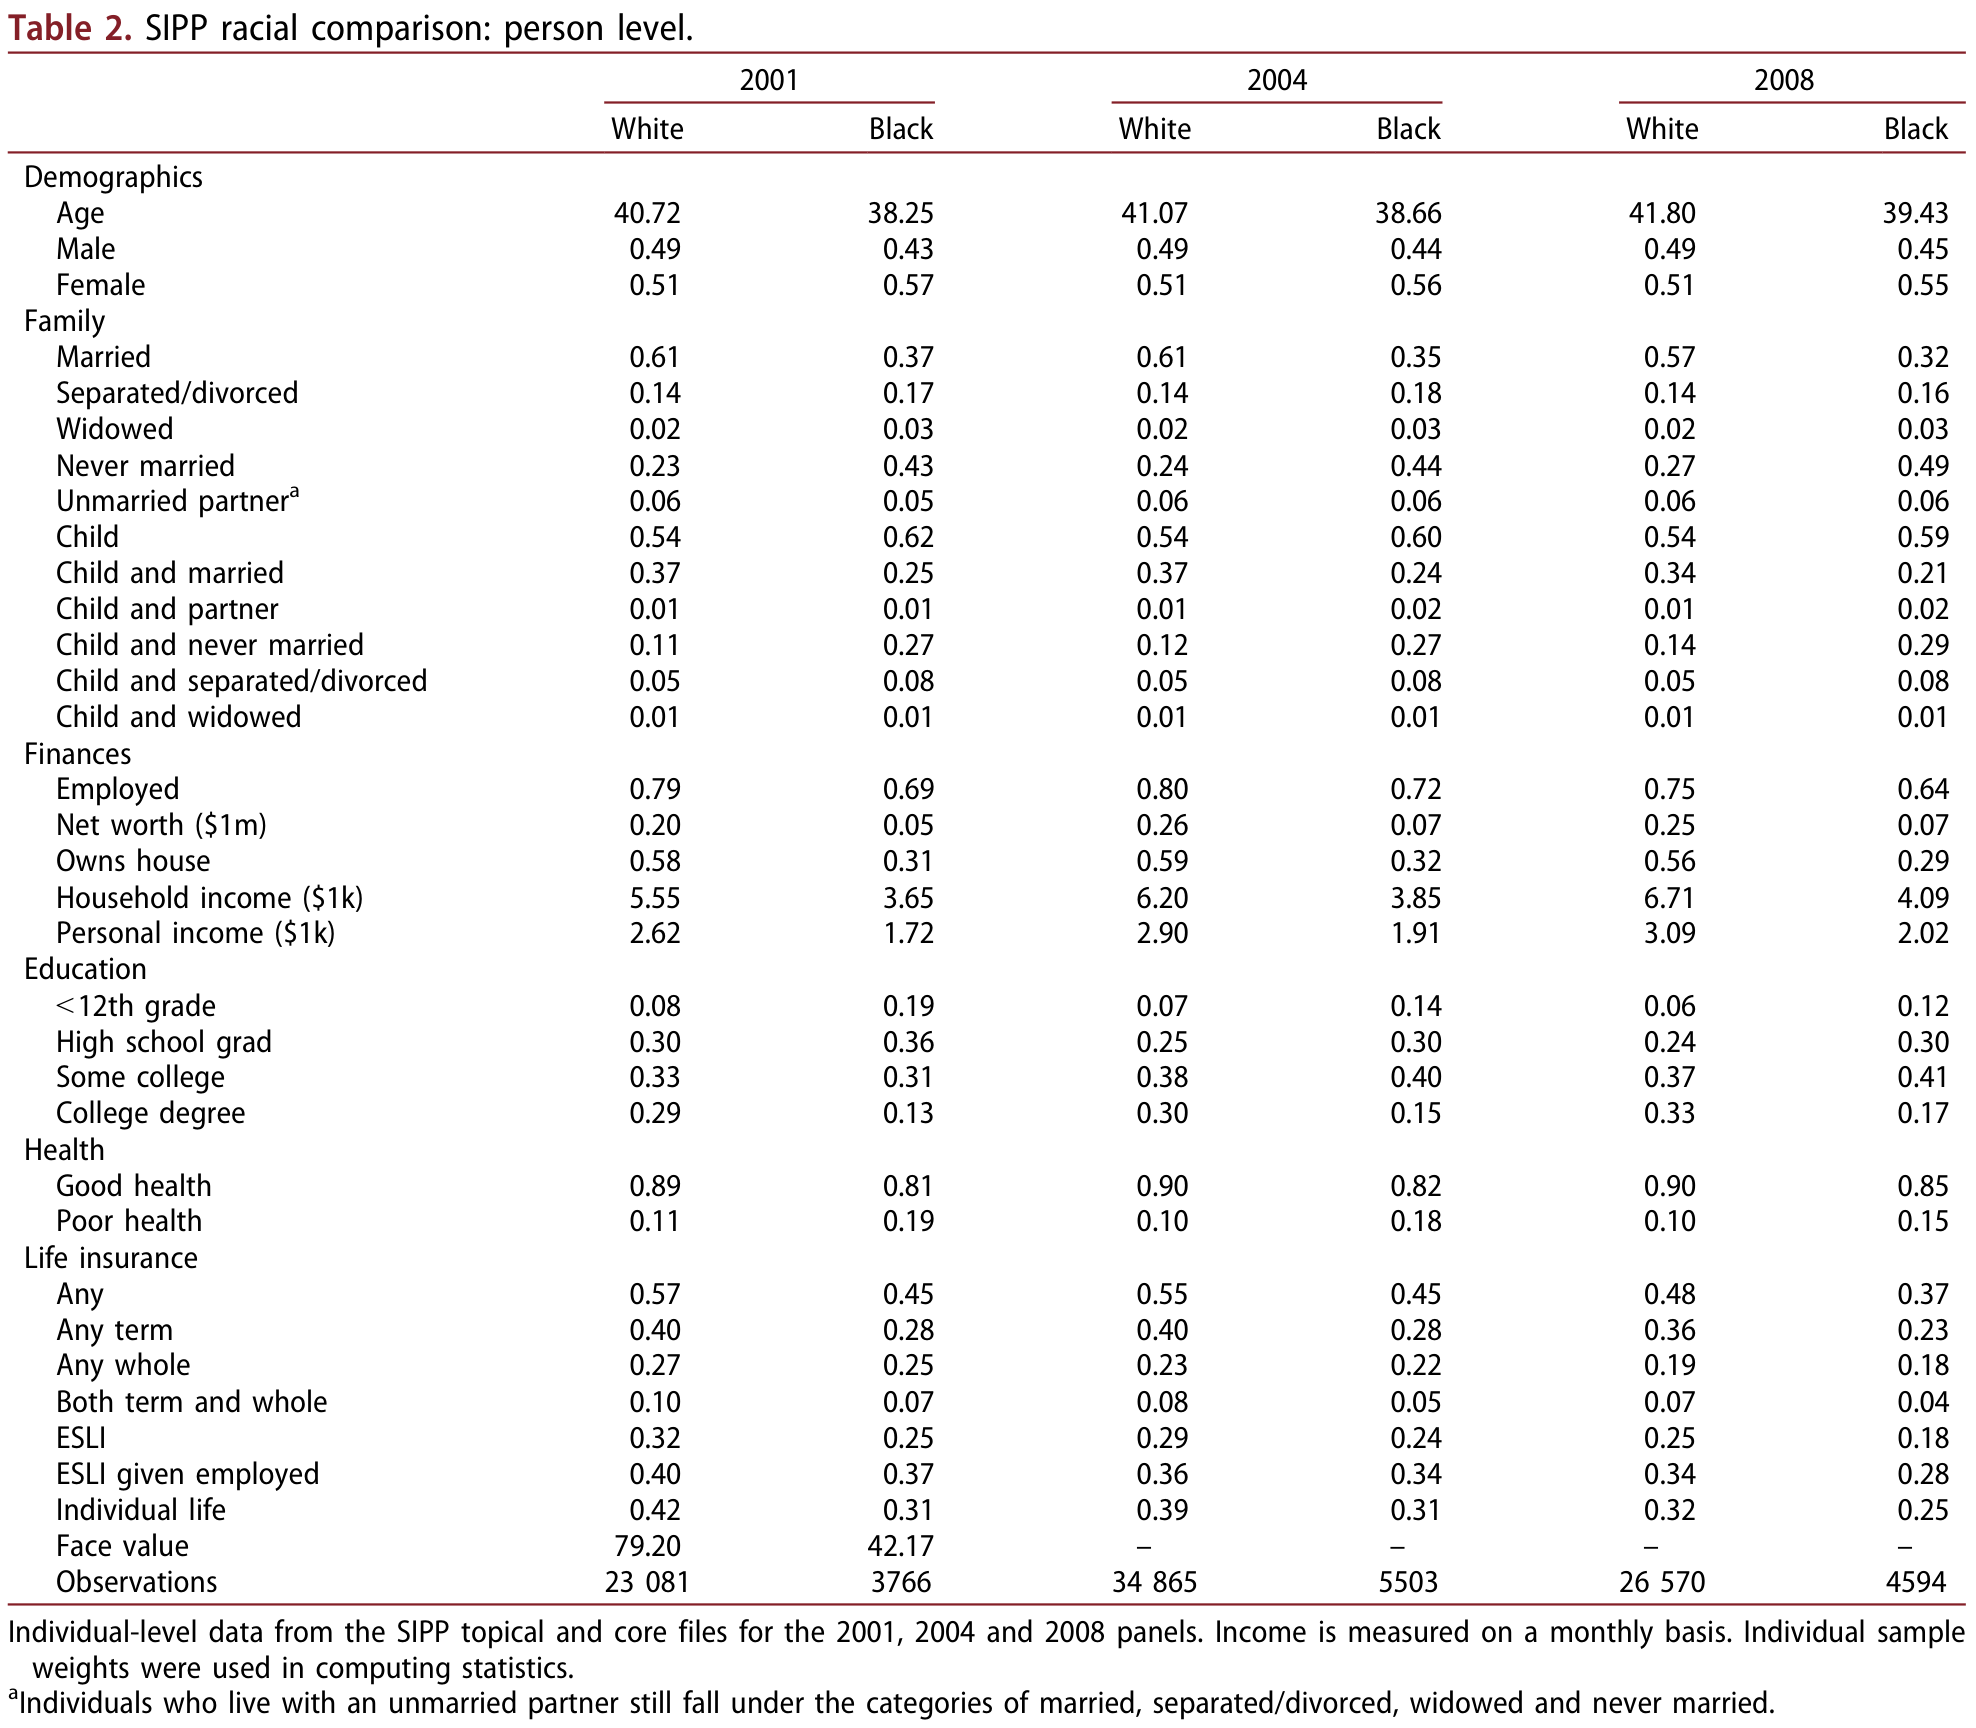
Summary statistics presented in Table 2 show that black individuals have substantially less monthly income and lower net worth, consistent with the existing literature. In addition, they are less likely to have a college education and report being in worse health. African Americans are less likely to have life insurance, with an ownership gap of 10 percentage points. The aforementioned decrease in life insurance holdings over time is present for both races. After conditioning on employment, participation in ESLI is more similar across races, but blacks are still less likely to hold life insurance. There are also differences in coverage based on insurance type. The two most common forms of life insurance are term and whole.<sup><a href="#source-note-14" aria-label="Source note 14">14</a></sup> Term life insurance covers an individual for a specified period (i.e. a 10-year term policy) and payment only occurs in the case of death. Whole life insurance policies are guaranteed for the life of the policyholder conditional on premium payment and have a ‘cash value’ which can be accessed through termination of the contract. The racial disparity exists for term life insurance with mean participation of 36% and 23% for whites and blacks, respectively, in the last sample year. This gap is much smaller for whole life insurance with a 1 percentage point difference in whole life insurance coverage.

### Table 2. SIPP racial comparison: person level

<figure class="article-figure" id="table-2"><a href="/files/publications/ay-ja-dt3mhtypba24yav3-assets/table-2.png"><img alt="Table 2. SIPP person-level comparisons of white and black respondents in the 2001, 2004 and 2008 panels, including family structure, income, health and life insurance holdings." height="1728" loading="lazy" src="/files/publications/ay-ja-dt3mhtypba24yav3-assets/table-2.png" width="1976"/></a><figcaption>Table 2. <a href="/files/publications/ay-ja-dt3mhtypba24yav3-assets/table-2.png">Open full-resolution image</a>.</figcaption></figure>


Finally, Table 2 illustrates some of the differences in family structure. Whites are more likely to marry, less likely to separate and less likely to divorce conditional on ever being married. Blacks are more likely to have a child but less likely to be married with a child. In 2010, black individuals were twice as likely to have never been married and have a child relative to white individuals. These differences in family composition could greatly influence the need and desire for life insurance holdings.
## III. Demand determinants and empirical model
One of the major roles of insurance is to mitigate a drop in family consumption due to premature death. The existence of a dependent family member such as a spouse or child should increase demand for life insurance (Inkmann and Michaelides 2012). One would expect, ceteris paribus, that a single parent would have an increased demand for life insurance relative to a married individual because of the lack of a provider in the case of early death.<sup><a href="#source-note-15" aria-label="Source note 15">15</a></sup> Therefore, the aforementioned exclusion of single-headed households by previous work has the potential to affect the analysis. The desire to leave a bequest or the emphasis that the individual places on surviving dependents’ well-being also directly influences both life insurance participation and coverage amounts.

The canonical expected utility model shows that with actuarially fair pricing and risk-averse individuals, everybody with dependents should purchase insurance. A majority of the population has some form of life insurance coverage, but this is far from the theoretical prediction of full participation for individuals with dependents. Individuals may deviate from the predictions of the rational frictionless environment and fail to purchase life insurance due to fixed costs, which vary greatly based on type. For example, term life insurance is associated with extensive underwriting whereas ESLI has much lower fixed costs. These fixed costs are less of a concern for large coverage amounts or longer terms. All else equal, as the fixed costs increase, individuals are less likely to buy
life insurance.

Various psychological frictions or costs exist that cause deviations from the frictionless rational model as well. Implicit costs due to the difficulty of evaluating the relative advantages for the various types of insurance can decrease coverage (Iyengar, Huberman, and Jiang 2004; Bikker and Van Leuvensteijn, 2008; Handel 2013; Handel and Kolstad 2015). Furthermore, the psychological cost of thinking about death decreases the likelihood of purchasing life insurance (Kopczuk and Slemrod 2005). Price misconceptions can also influence the participation rate. A recent study found that 80% of Americans misjudged the cost of life insurance (LIMRA 2015). These misconceptions likely decrease life insurance participation.

Another consideration for life insurance participation is heterogeneity in health. Life insurance companies may reject individuals in poor health to avoid potential losses (Hendren 2013). This type of rejection is more relevant for individual term policies due to underwriting. In addition, individuals in the best health may not purchase insurance due to adverse selection and actuarially unfair premiums (Akerlof 1970).

The factors that influence life insurance coverage could vary by race. Equation 1 presents a linear probability model used to test the influence of race on life insurance participation:
<figure class="article-figure" id="equation-1"><a href="/files/publications/ay-ja-dt3mhtypba24yav3-assets/equation-1.png"><img alt="Equation 1. Life insurance L for person i equals an intercept, a coefficient on the Black indicator, a coefficient vector on characteristics X, and an error." height="88" loading="lazy" src="/files/publications/ay-ja-dt3mhtypba24yav3-assets/equation-1.png" width="808"/></a><figcaption>Equation 1. <a href="/files/publications/ay-ja-dt3mhtypba24yav3-assets/equation-1.png">Open full-resolution image</a>.</figcaption></figure>


where <math xmlns="http://www.w3.org/1998/Math/MathML" display="inline"><mrow><mi>B</mi><mi>l</mi><mi>a</mi><mi>c</mi><msub><mi>k</mi><mi>i</mi></msub></mrow></math> is an indicator variable that the individual was African American, <math xmlns="http://www.w3.org/1998/Math/MathML" display="inline"><mrow><msub><mi>X</mi><mi>i</mi></msub></mrow></math> represents a vector of covariates including age, gender, marital status, children, income, net worth, education, home ownership, mortgage, employment, industry and health following work reviewed by Liebenberg, Carson, and Dumm (2012). <math xmlns="http://www.w3.org/1998/Math/MathML" display="inline"><mrow><msub><mi>L</mi><mi>i</mi></msub></mrow></math> is an indicator variable that represents having any, term, whole, ESLI or individual life insurance depending on the specification. In addition, we use OLS and Tobit analysis to estimate the effect of race on the face value of life insurance.
## IV. Results
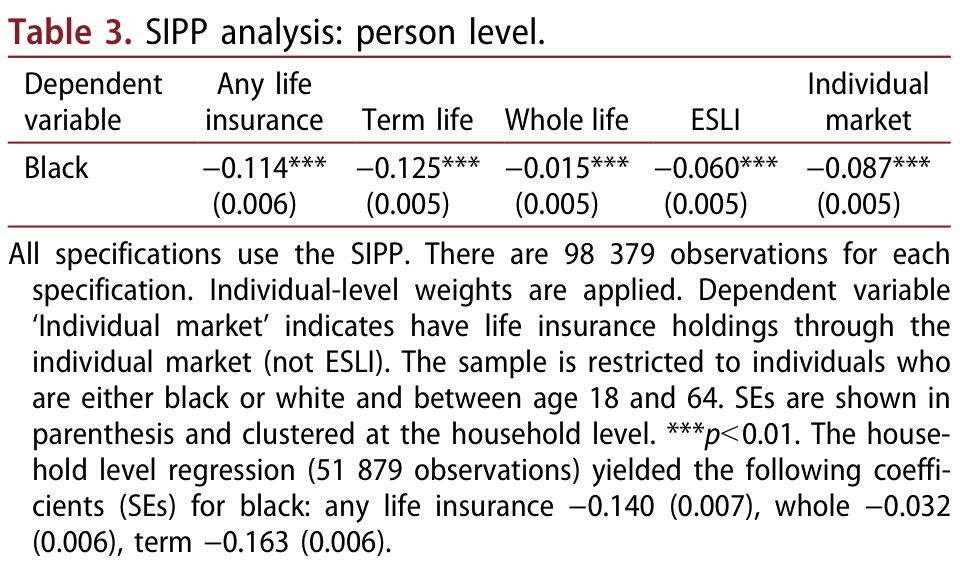
We first run bivariate regressions to formally measure the relationship between life insurance and race.<sup><a href="#source-note-16" aria-label="Source note 16">16</a></sup> Table 3 shows that <math xmlns="http://www.w3.org/1998/Math/MathML" display="inline"><mrow><msub><mi>&#x003B2;</mi><mn>1</mn></msub></mrow></math> is negative and statistically significant for participation in all of the different types of life insurance. In particular, black individuals are approximately 11.4 percentage points less likely to hold any life insurance relative to white individuals. This negative coefficient is present for all specifications but with varying magnitudes.

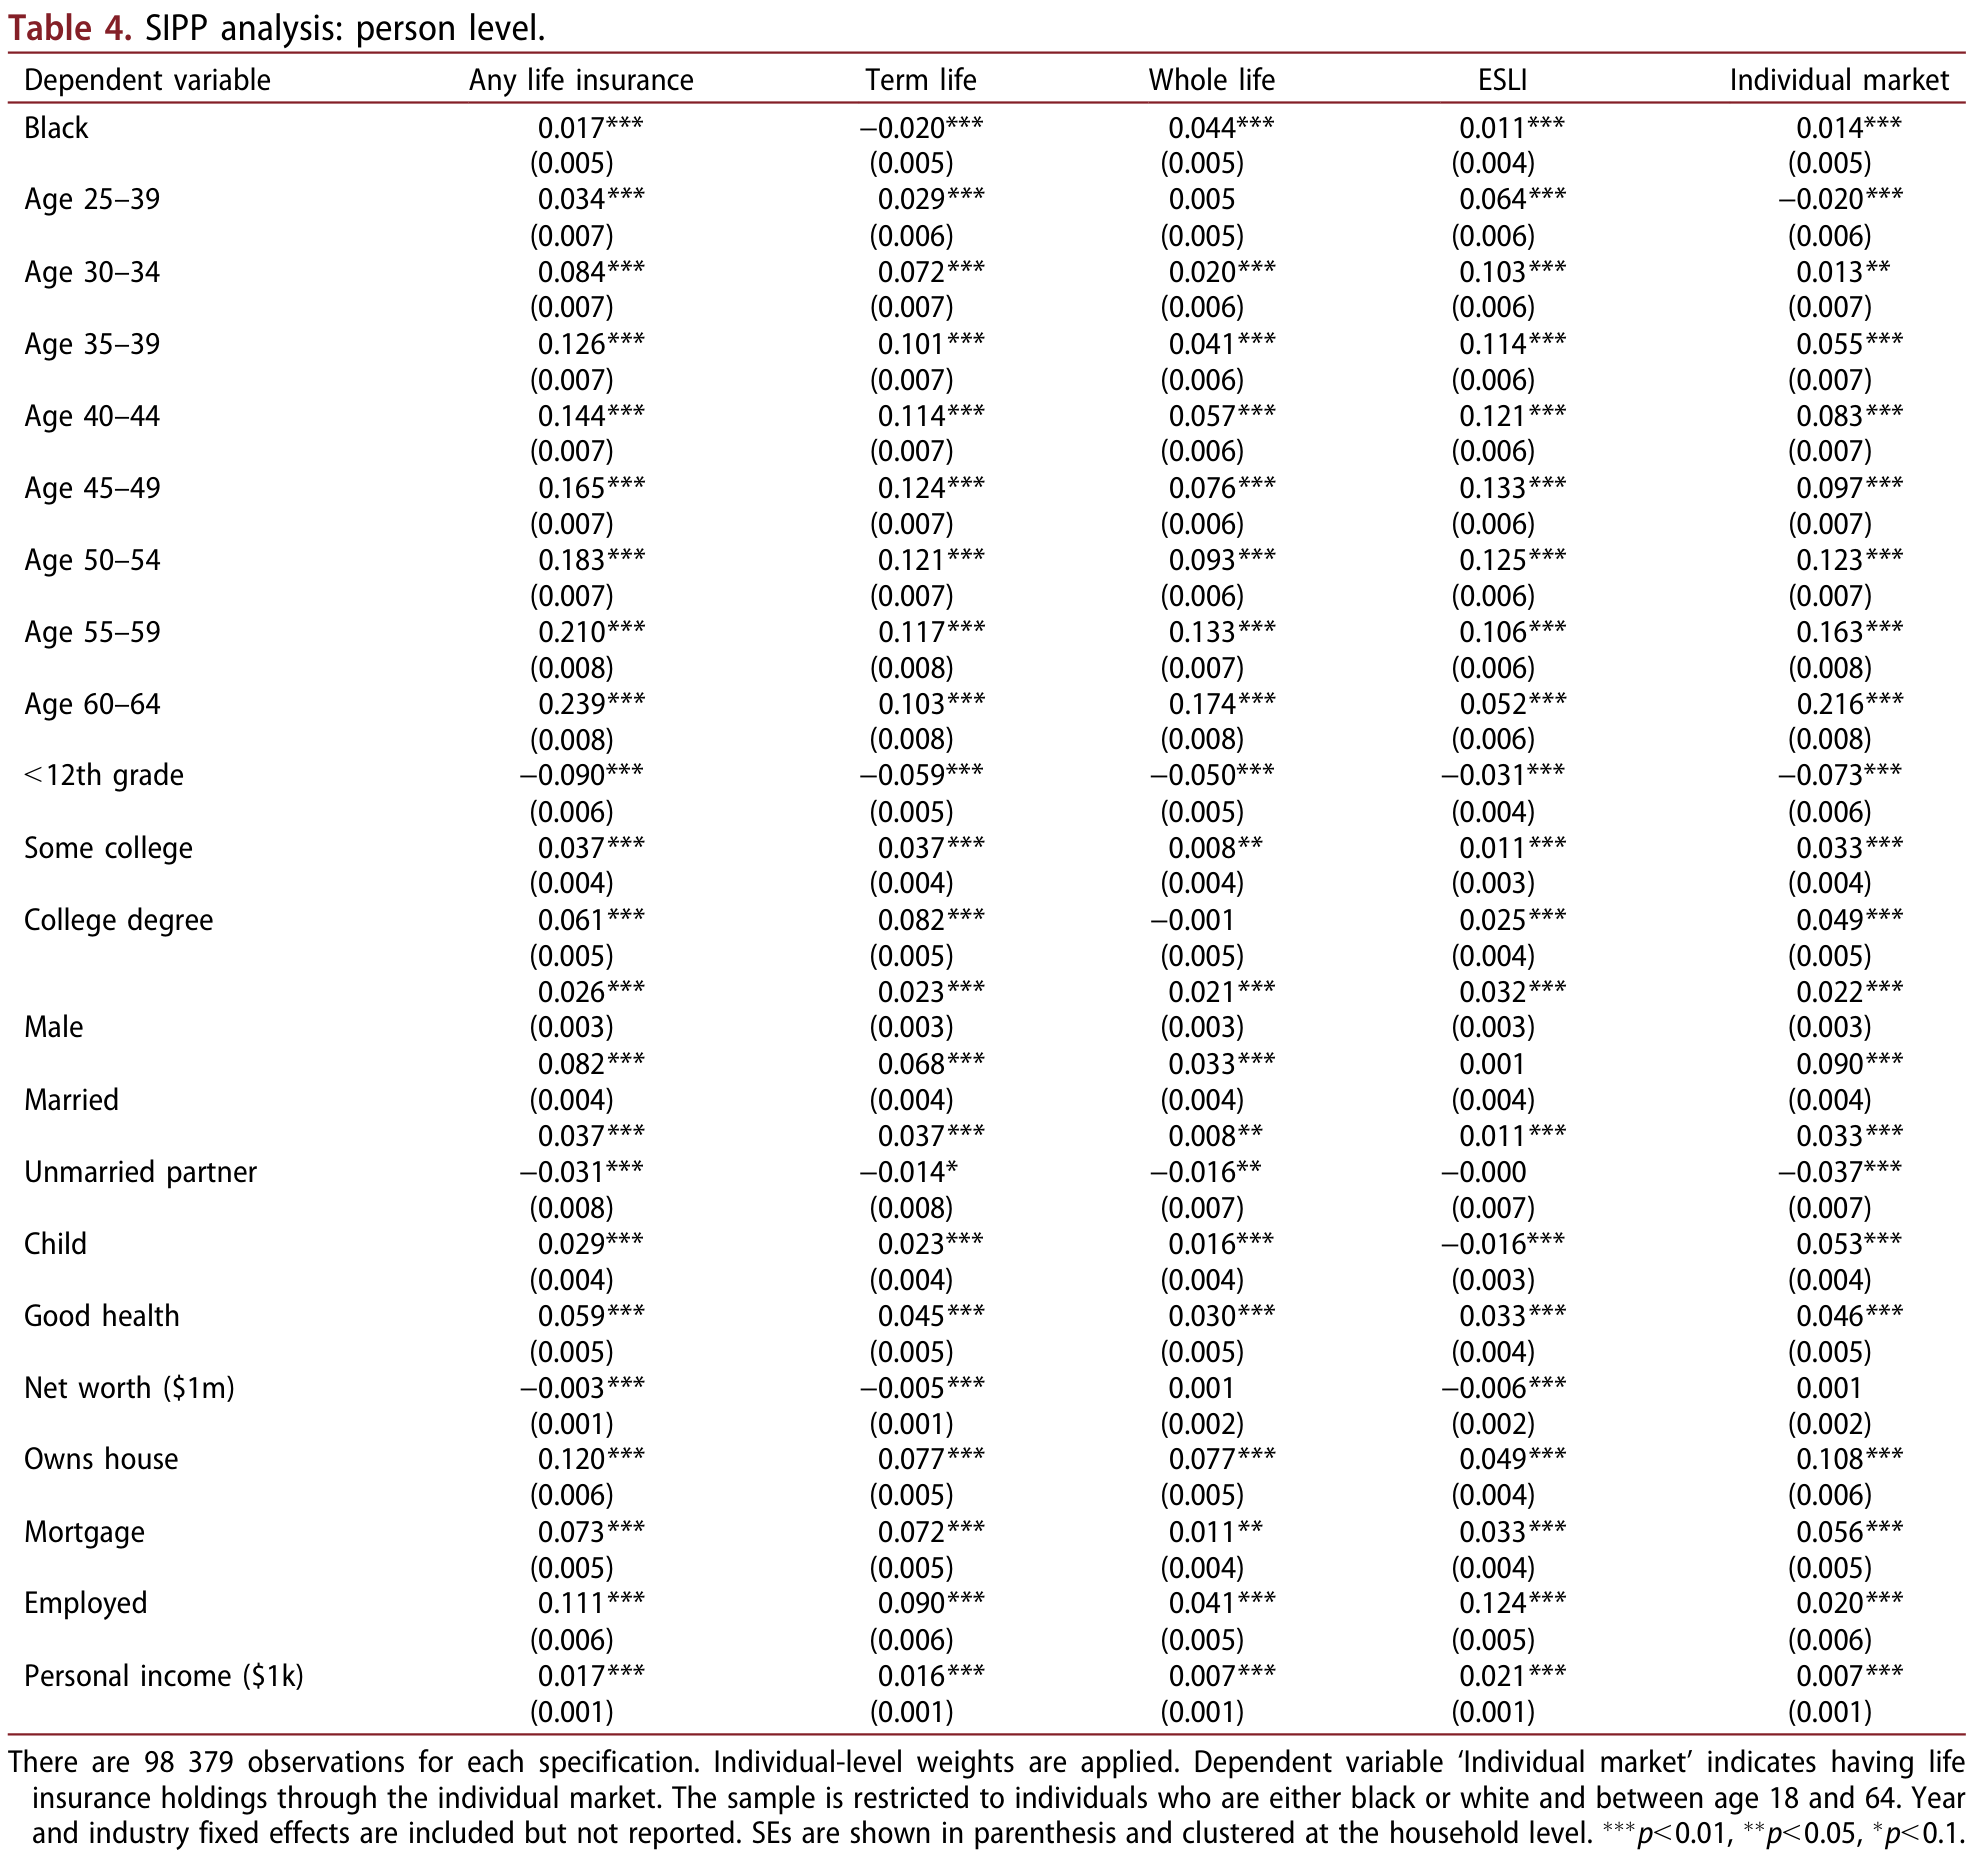
Table 4 presents the findings of the full model. After controlling for covariates, black individuals are significantly more likely – by 2 percentage points – to hold life insurance, which is distinct from previous work that found no racial difference.

The model for whole life insurance further shows that blacks are 4 percentage points more likely to have coverage. Whole life insurance coverage – which does not have a fixed length – is increasing with age. An important difference in the specification with whole life insurance is that having a college degree does not increase coverage. The racial gap in term life insurance changes from a large negative (12.5 percentage points) to small negative effect (2.0 percentage points) after including covariates. This small negative finding could partially be due to the inability in the data to completely characterize health, which is explicitly incorporated into term life insurance underwriting. In contrast to whole life insurance coverage (where there is not an effect), individuals with a college degree are 8 percentage points more likely to purchase term coverage than those that just graduated high school.

### Table 3. SIPP analysis: person level

<figure class="article-figure" id="table-3"><a href="/files/publications/ay-ja-dt3mhtypba24yav3-assets/table-3.png"><img alt="Table 3. Person-level SIPP estimates of the Black coefficient for any, term, whole, employer-sponsored and individual-market life insurance, with standard errors and complete sample notes." height="564" loading="lazy" src="/files/publications/ay-ja-dt3mhtypba24yav3-assets/table-3.png" width="960"/></a><figcaption>Table 3. <a href="/files/publications/ay-ja-dt3mhtypba24yav3-assets/table-3.png">Open full-resolution image</a>.</figcaption></figure>


In both regressions for term and whole life insurance, we find consistent results for a number of covariates. As theory would suggest and consistent with previous findings, the presence of a spouse or child increases the likelihood of having life insurance (Jappelli and Pistaferri 2003; Inkmann and Michaelides 2012). An unmarried partner negatively influences life insurance holdings. Additionally, individuals who are in good health are more likely to have life insurance possibly due to screening/ underwriting from insurance companies or advantageous selection (Finkelstein and McGarry 2006). In addition, homeowners are significantly more likely to have life insurance, and having a mortgage increases demand for coverage (Gutter and Hatcher 2008).<sup><a href="#source-note-17" aria-label="Source note 17">17</a></sup> Both employment and income additionally have a positive effect, while net worth has a small
negative or insignificant effect. Males are more likely to have life insurance across all specifications (Gandolfi and Miners 1996).

In addition, Table 4 presents the results for ESLI and individual life insurance. For both sources, blacks are more likely to have life insurance. The main difference between the two is that being married and having a child does not increase coverage in ESLI whereas they both are significant factors for individual market coverage. This finding is likely due to automatic coverage given by an employer and virtually complete take-up.

How do these different types of life insurance holdings compare as hedges against the financial consequences of mortality risk? The first delineation is between ESLI and individual life insurance holdings. ESLI is conditional on employment and consequently is a less-complete hedge in comparison to individual life insurance, which is only contingent on premium payments.<sup><a href="#source-note-18" aria-label="Source note 18">18</a></sup> Overall, there are high levels of mobility in the workforce with a median tenure of only 4.3 years in 2016 (Bureau of Labor Statistics, U.S.


Department of Labor 2016). Therefore, even though individuals have ESLI coverage, it is likely not a long-term hedge on average against mortality risk. Nonetheless, black individuals are more likely to hold both ESLI and individual coverage relative to whites.

Focusing on the different types of individual life insurance, term life insurance, by definition, is limited to a specified time horizon whereas whole life insurance does not have an end date. Nonetheless, many policies lapse due to nonpayment of premiums or termination of the contract. In a study of life insurance persistence from 2007 to 2009, the annual lapse rates were 3.1% and 6.9% annually for whole and term life insurance policies, respectively (Society of Actuaries and LIMRA, 2012). Therefore, holding all else equal, whole life insurance – of which blacks are 4 percentage points more likely to have than whites – could be considered a more complete hedge against the financial consequences of early mortality even after considering lapse rates.

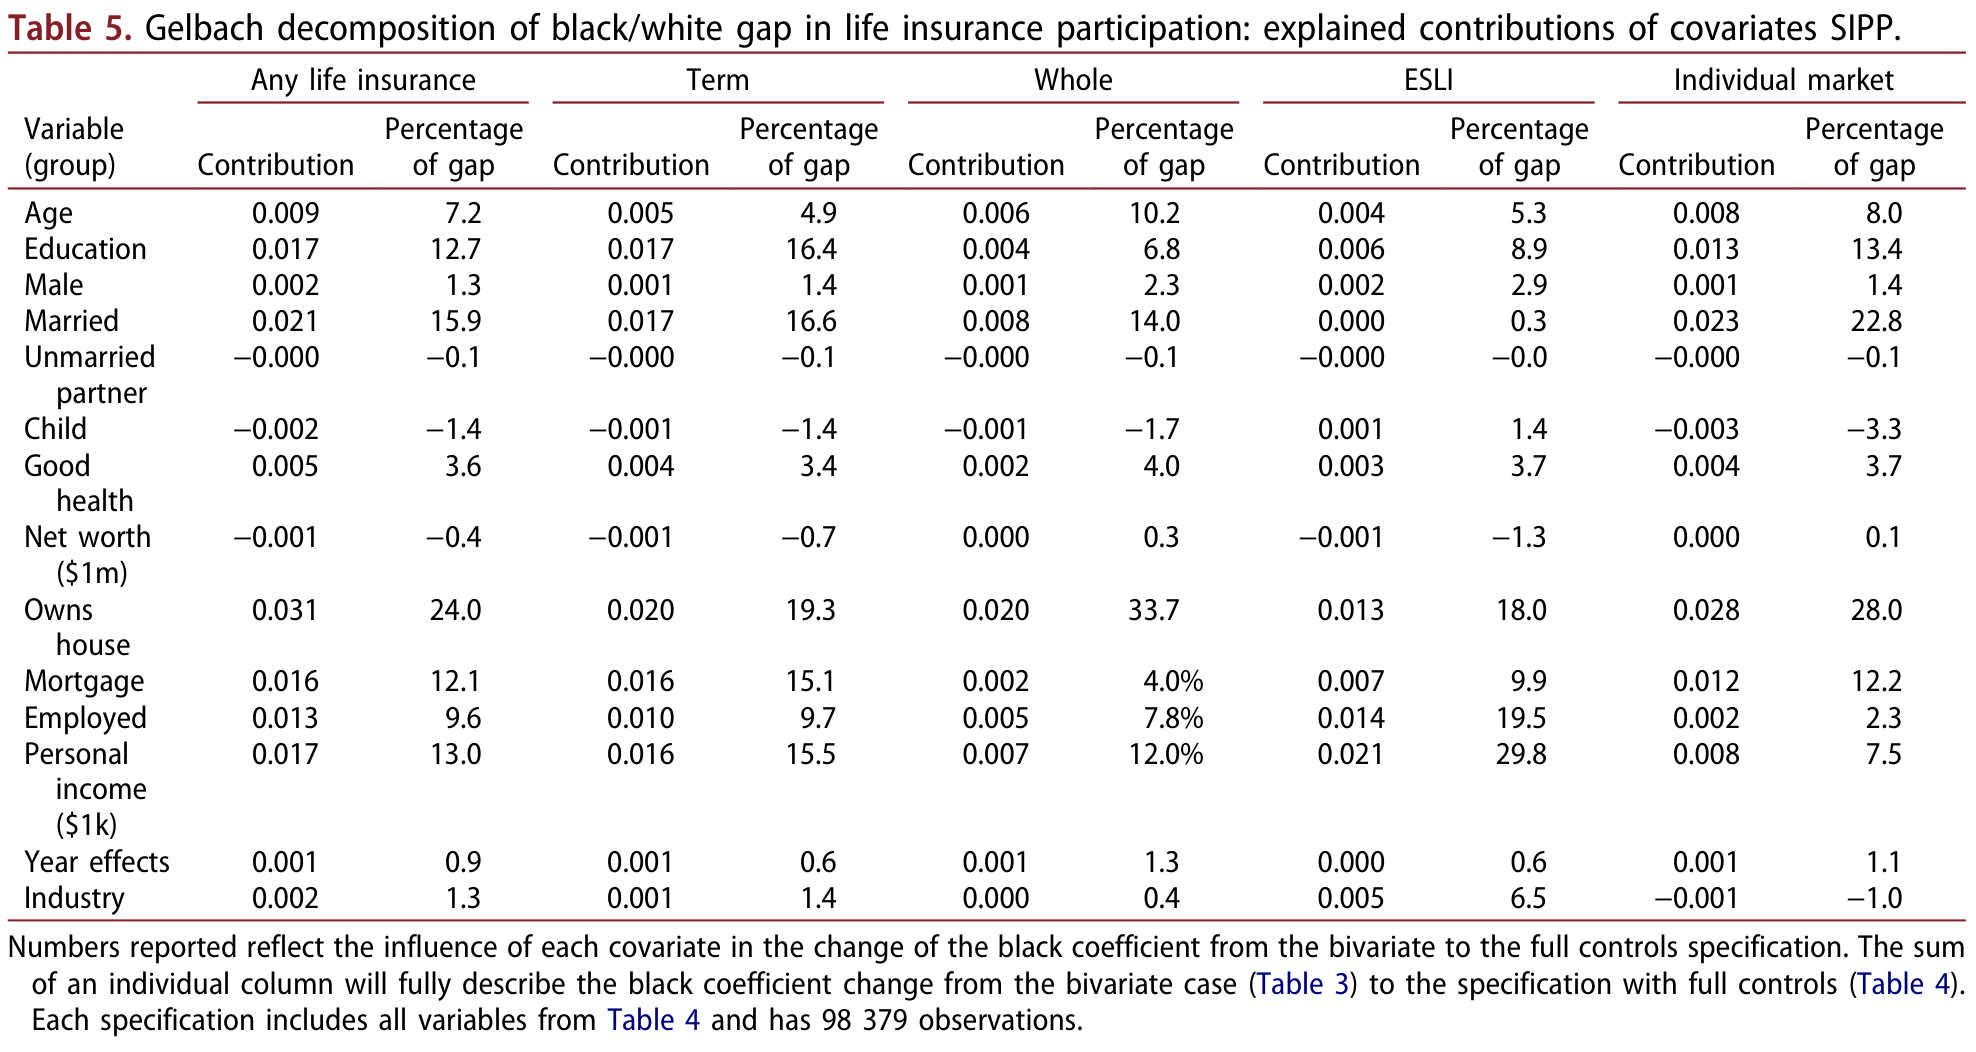
To gauge the influence of each individual covariate on the transformation of the racial gap from negative to positive, we implement a technique prescribed by Gelbach (2016). His work shows that the traditional practice of sequentially adding covariates to a model to observe the influence on the coefficient of interest leads to ambiguous results that are ‘sequence-sensitive’. For example, the change in the racial gap by adding education as a covariate differs depending on the order it is added to the model. If we added education variables first then the observed change in the racial gap would be different than if we added family structure first and then added education. This result is due to the correlation between education and family structure. In order to create a ‘path-independent’ explanation of the influence of each covariate, Gelbach prescribes omitted variable bias equations to gauge the contribution of each covariate. Essentially, we estimate omitted variable bias on the coefficient of interest (in this case <math xmlns="http://www.w3.org/1998/Math/MathML" display="inline"><mrow><msub><mi>&#x003B2;</mi><mn>1</mn></msub></mrow></math>) from the exclusion of each control one at a time from the full model. The influence of each covariate is therefore a function of the correlation between the covariate and black in addition to the covariate’s coefficient in the full specification. For example, net worth is highly correlated with race, but it is not a major determining factor in life insurance coverage and therefore does not exhibit a large influence in the transformation of the black coefficient from negative to positive.

Table 5 shows the Gelbach decomposition for the SIPP analysis following the format presented by Grove, Hussey, and Jetter (2011). In the specification for having any life insurance, home ownership and having a mortgage account for almost 35% of the change in the racial gap (<math xmlns="http://www.w3.org/1998/Math/MathML" display="inline"><mrow><msub><mi>&#x003B2;</mi><mn>1</mn></msub></mrow></math>). Risk of foreclosure, for surviving household members, in conjunction with the negative correlation between homeownership and being black causes the inclusion of homeownership/mortgage to greatly influence <math xmlns="http://www.w3.org/1998/Math/MathML" display="inline"><mrow><msub><mi>&#x003B2;</mi><mn>1</mn></msub></mrow></math>. The influence of being married explains 16%, level of education explains 13%, income explains 13% and employment explains 10% of the change in the black coefficient from negative 11 percentage points to positive 2 percentage points. For the decomposition for term, education explains relatively more (16%) and for whole life insurance owning a home accounts for an even greater portion (34%). For ESLI, employment and proxies for type of employment (personal income, industry and education) account for 65% of the change in the negative 6 percentage point bivariate result to the positive 1 percentage point racial gap for ESLI.

### Table 4. SIPP analysis: person level

<figure class="article-figure" id="table-4"><a href="/files/publications/ay-ja-dt3mhtypba24yav3-assets/table-4.png"><img alt="Table 4. SIPP life-insurance regressions with race, age, education, sex, family, health, wealth, homeownership, employment and income controls; five insurance outcomes and clustered standard errors." height="1860" loading="lazy" src="/files/publications/ay-ja-dt3mhtypba24yav3-assets/table-4.png" width="1976"/></a><figcaption>Table 4. <a href="/files/publications/ay-ja-dt3mhtypba24yav3-assets/table-4.png">Open full-resolution image</a>.</figcaption></figure>


### Table 5. Gelbach decomposition of black/white gap in life insurance participation: explained contributions of covariates SIPP

<figure class="article-figure" id="table-5"><a href="/files/publications/ay-ja-dt3mhtypba24yav3-assets/table-5.png"><img alt="Table 5. Gelbach decomposition of the black-white participation gap for five insurance outcomes, reporting each covariate group's contribution and percentage of the gap." height="1052" loading="lazy" src="/files/publications/ay-ja-dt3mhtypba24yav3-assets/table-5.png" width="1976"/></a><figcaption>Table 5. <a href="/files/publications/ay-ja-dt3mhtypba24yav3-assets/table-5.png">Open full-resolution image</a>.</figcaption></figure>


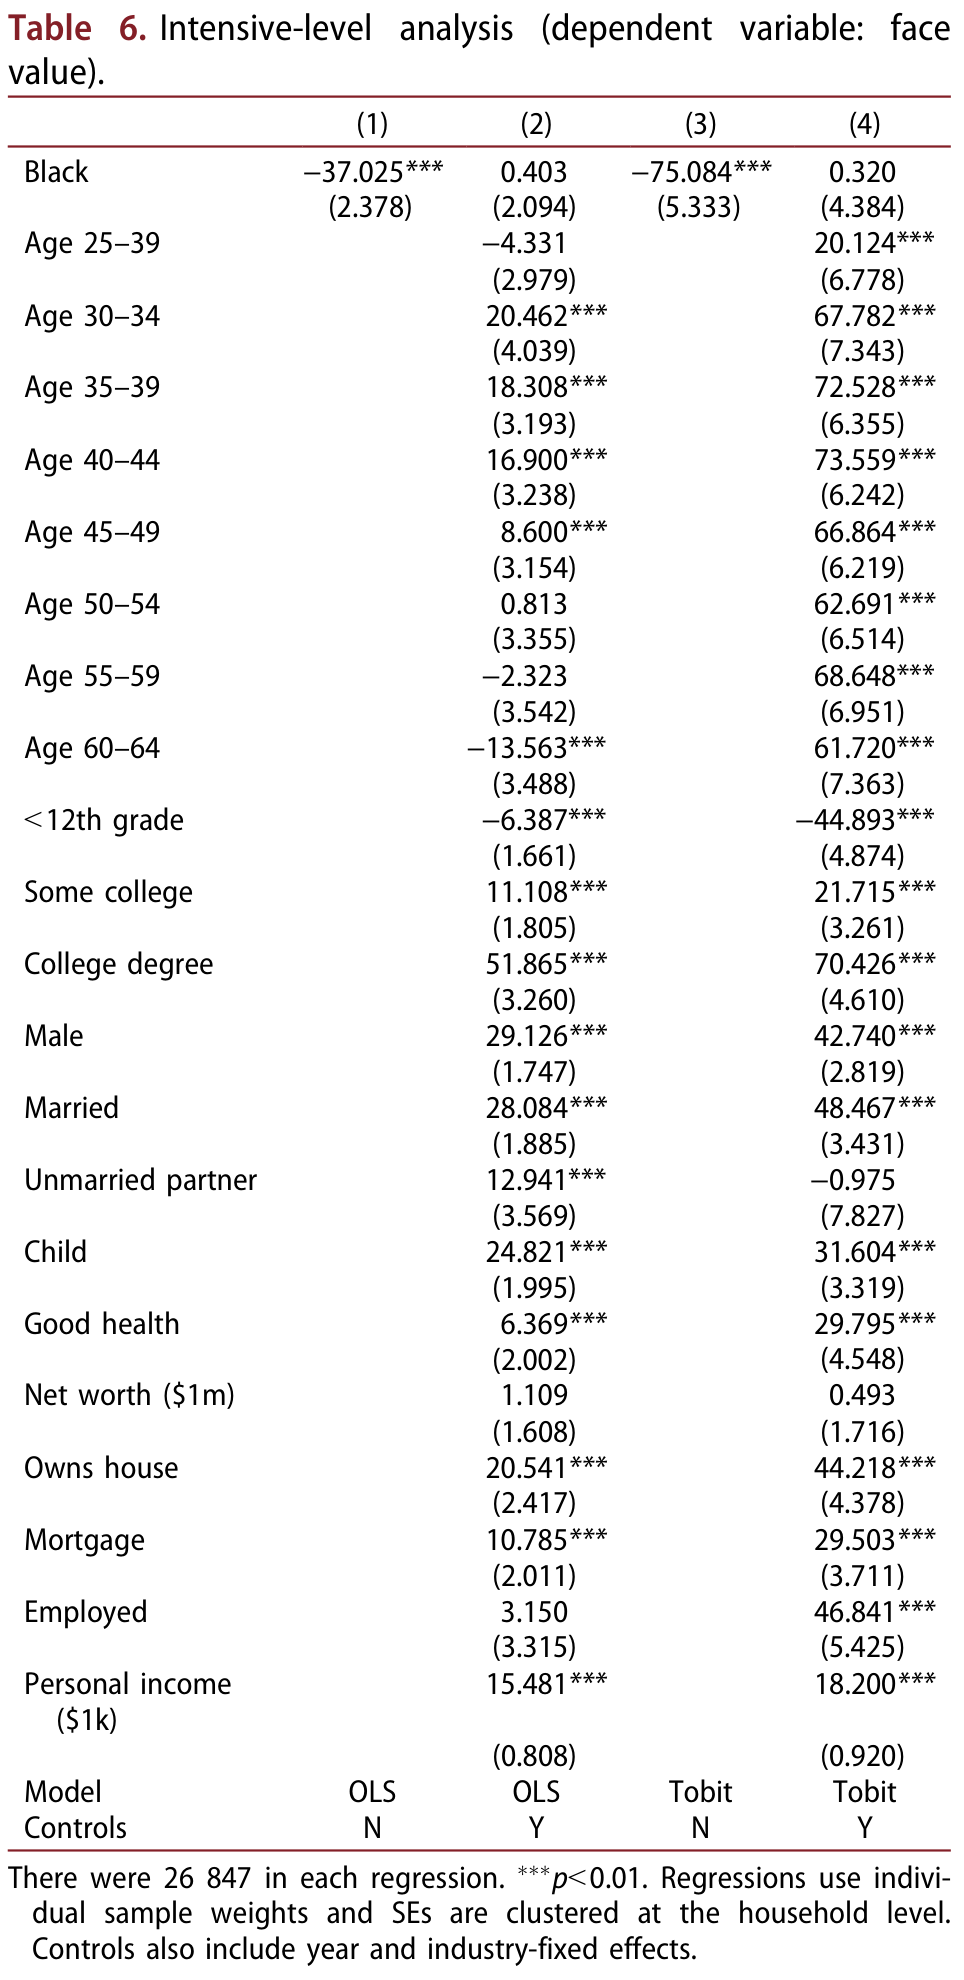
In order to better understand possible racial disparities, we also present results on the intensive margin – the face value – of such life insurance policies. We only observe the face value in 2001 for the SIPP due to a change in survey questions in later years. Table 6 shows that after controlling for covariates there is no statistically significant difference between races. Due to the inclusion of many zero values, we further test the analysis using a Tobit, which gives results consistent with OLS.


A possible limitation with the econometric specification is the assumption that the explanatory variables influence the decision to have life insurance the same for black and white individuals. To relax this assumption, we apply the Oaxaca –Blinder (OB) decomposition which uses estimates from separate regressions for the two groups (Blinder 1973; Oaxaca 1973). Life insurance ownership is estimated for each race given by the following specification:
<figure class="article-figure" id="equation-2"><a href="/files/publications/ay-ja-dt3mhtypba24yav3-assets/equation-2.png"><img alt="Equation 2. Life insurance for person i in racial group r equals group-specific coefficients multiplied by characteristics X, plus an error." height="84" loading="lazy" src="/files/publications/ay-ja-dt3mhtypba24yav3-assets/equation-2.png" width="668"/></a><figcaption>Equation 2. <a href="/files/publications/ay-ja-dt3mhtypba24yav3-assets/equation-2.png">Open full-resolution image</a>.</figcaption></figure>

where <math xmlns="http://www.w3.org/1998/Math/MathML" display="inline"><mrow><msub><mi>L</mi><mrow><mi>i</mi><mi>r</mi></mrow></msub></mrow></math> is an indicator of having life insurance for individual i of race r. <math xmlns="http://www.w3.org/1998/Math/MathML" display="inline"><mrow><msub><mi>X</mi><mrow><mi>i</mi><mi>r</mi></mrow></msub></mrow></math> contains the same covariates described for Equation 1. To decompose the racial life insurance gap, OB decomposition takes the difference between the two models to yield the following expression.
<figure class="article-figure" id="equation-3"><a href="/files/publications/ay-ja-dt3mhtypba24yav3-assets/equation-3.png"><img alt="Equation 3. The difference in mean life insurance between white and black groups is decomposed into differences in characteristics and differences in estimated coefficients." height="156" loading="lazy" src="/files/publications/ay-ja-dt3mhtypba24yav3-assets/equation-3.png" width="876"/></a><figcaption>Equation 3. <a href="/files/publications/ay-ja-dt3mhtypba24yav3-assets/equation-3.png">Open full-resolution image</a>.</figcaption></figure>

where the subscripts W and B; respectively, indicate covariates or estimated coefficients from the white and black specifications. The first term captures the explained differences in the outcome variable due to differences in the underlying covariates. The second term is the unexplained portion due to differences in the two groups analysed.

The decomposition in Equation 3 describes the outcome for black individuals if they had the same characteristics and return to characteristics as white individuals. However, the results change if the decomposition is written from the viewpoint of whites rather than blacks. To address this concern, various weighting schemes have been proposed in the literature (e.g. Reimers 1983; Cotton 1988). Following Grove, Hussey, and Jetter ( 2011), we report the outcomes from three weighting schemes including placing all the weight on whites, placing all the weight on blacks or using coefficients from a pooled estimation as described by Neumark ( 1988) and Chevalier ( 2007).

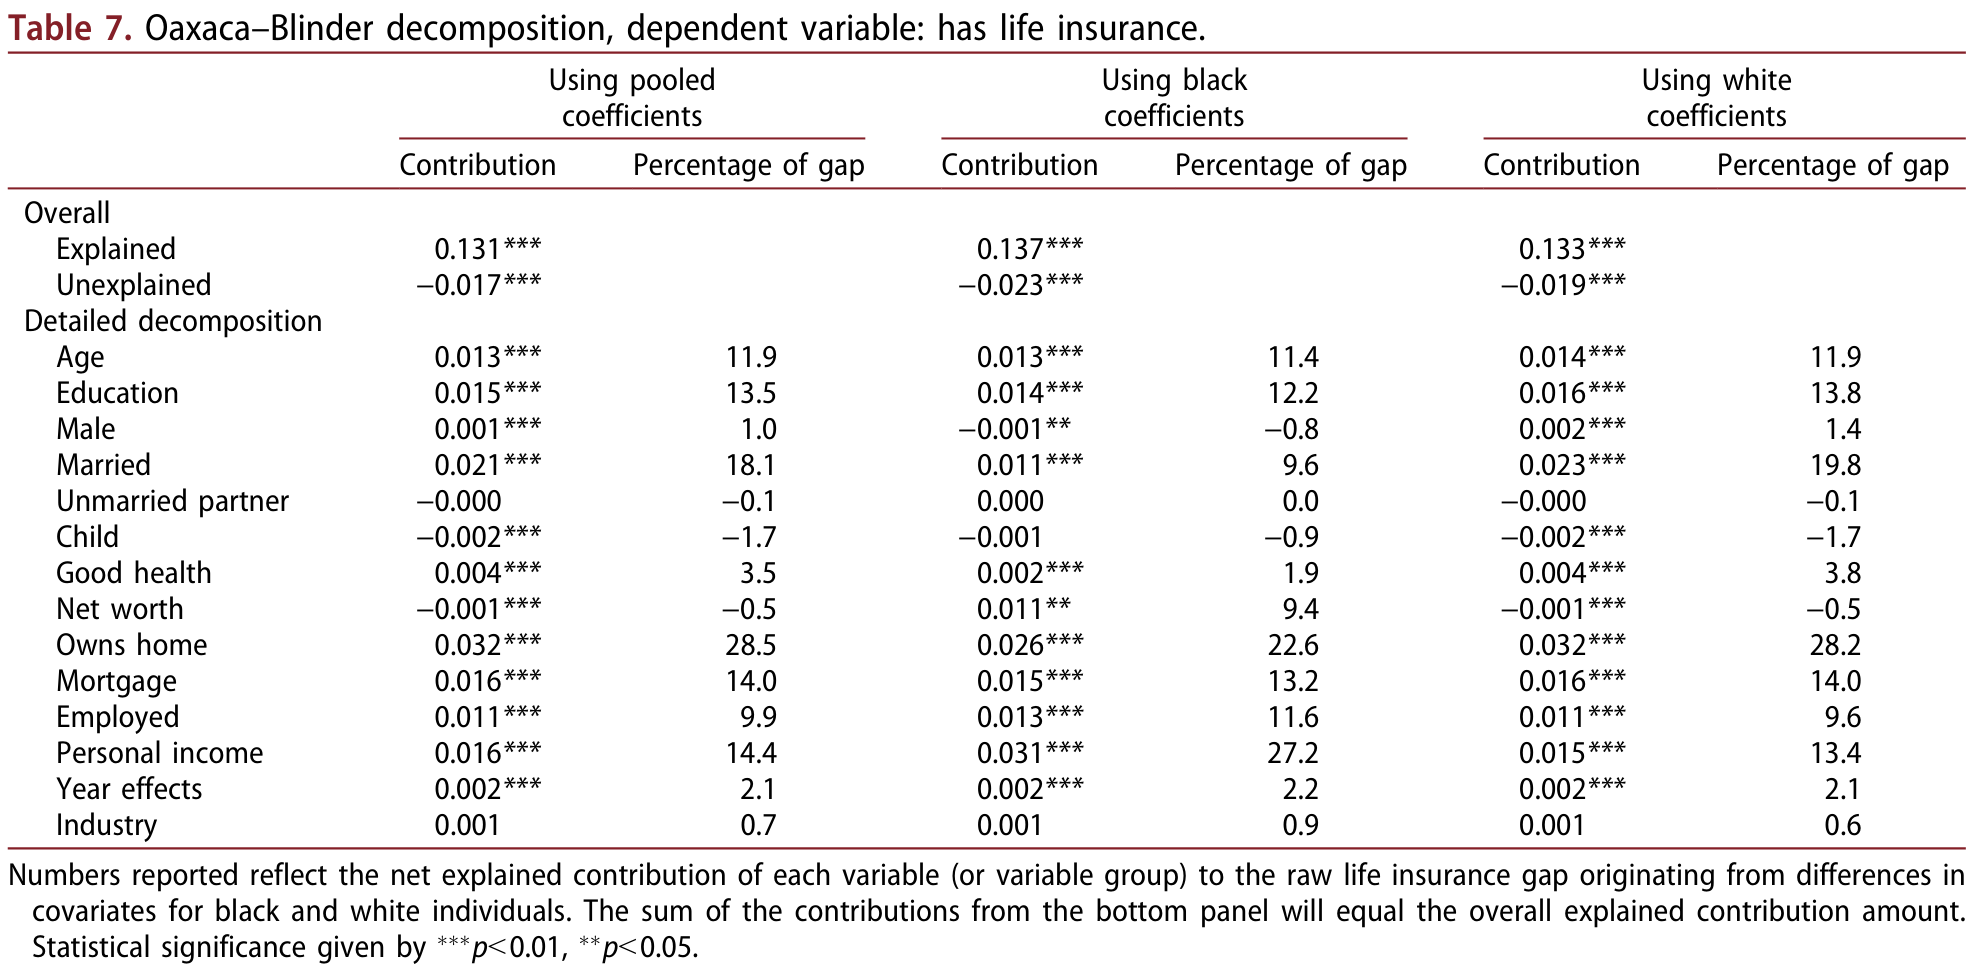
Table 7 contains the OB decomposition for the outcome variable of having any life insurance coverage.<sup><a href="#source-note-19" aria-label="Source note 19">19</a></sup> Focusing on the top panel, the overall unexplained portion from the decomposition using the pooled coefficients is the same as coefficient on Black in the first column of Table 4 as expected. The unexplained differences change slightly using the coefficients estimated from separate regressions for black and white individuals, but the overall finding that black individuals have more life insurance coverage – after taking into account the differences in covariates – remains unchanged. The second panel contains the results from a detailed OB decomposition and consistent with the Gelbach decomposition results indicates that the major contributors to the raw differences are home ownership, mortgage, marriage, education and personal income. Table 8 shows that the OB decomposition yield similar qualitative results as the estimates presented earlier for the various types of life insurance coverage. Overall, although the magnitudes are slightly different and the previous results, the interpretations are consistent with the results from using Gelbach decomposition.

### Table 6. Intensive-level analysis (dependent variable: face value)

<figure class="article-figure" id="table-6"><a href="/files/publications/ay-ja-dt3mhtypba24yav3-assets/table-6.png"><img alt="Table 6. Four models of insurance face value using ordinary least squares and Tobit, with and without controls, reporting race and covariate coefficients and standard errors." height="1980" loading="lazy" src="/files/publications/ay-ja-dt3mhtypba24yav3-assets/table-6.png" width="964"/></a><figcaption>Table 6. <a href="/files/publications/ay-ja-dt3mhtypba24yav3-assets/table-6.png">Open full-resolution image</a>.</figcaption></figure>


### Table 7. Oaxaca–Blinder decomposition, dependent variable: has life insurance

<figure class="article-figure" id="table-7"><a href="/files/publications/ay-ja-dt3mhtypba24yav3-assets/table-7.png"><img alt="Table 7. Oaxaca–Blinder decomposition of life-insurance ownership, comparing pooled, black and white coefficients; overall explained and unexplained gaps and detailed covariate contributions." height="976" loading="lazy" src="/files/publications/ay-ja-dt3mhtypba24yav3-assets/table-7.png" width="1976"/></a><figcaption>Table 7. <a href="/files/publications/ay-ja-dt3mhtypba24yav3-assets/table-7.png">Open full-resolution image</a>.</figcaption></figure>


### Table 8. Oaxaca–Blinder decomposition, life insurance type

<figure class="article-figure" id="table-8"><a href="/files/publications/ay-ja-dt3mhtypba24yav3-assets/table-8.png"><img alt="Table 8. Oaxaca–Blinder explained and unexplained gaps for term, whole, employer-sponsored and individual insurance, using black or white coefficient weights." height="360" loading="lazy" src="/files/publications/ay-ja-dt3mhtypba24yav3-assets/table-8.png" width="1976"/></a><figcaption>Table 8. <a href="/files/publications/ay-ja-dt3mhtypba24yav3-assets/table-8.png">Open full-resolution image</a>.</figcaption></figure>


## V. Reconciling results
Our findings that black individuals are more likely to purchase life insurance diverge from the findings of Gutter and Hatcher (2008) and Douglas et al. (2003) who find either no disparities or that black individuals have less life insurance coverage. In order to
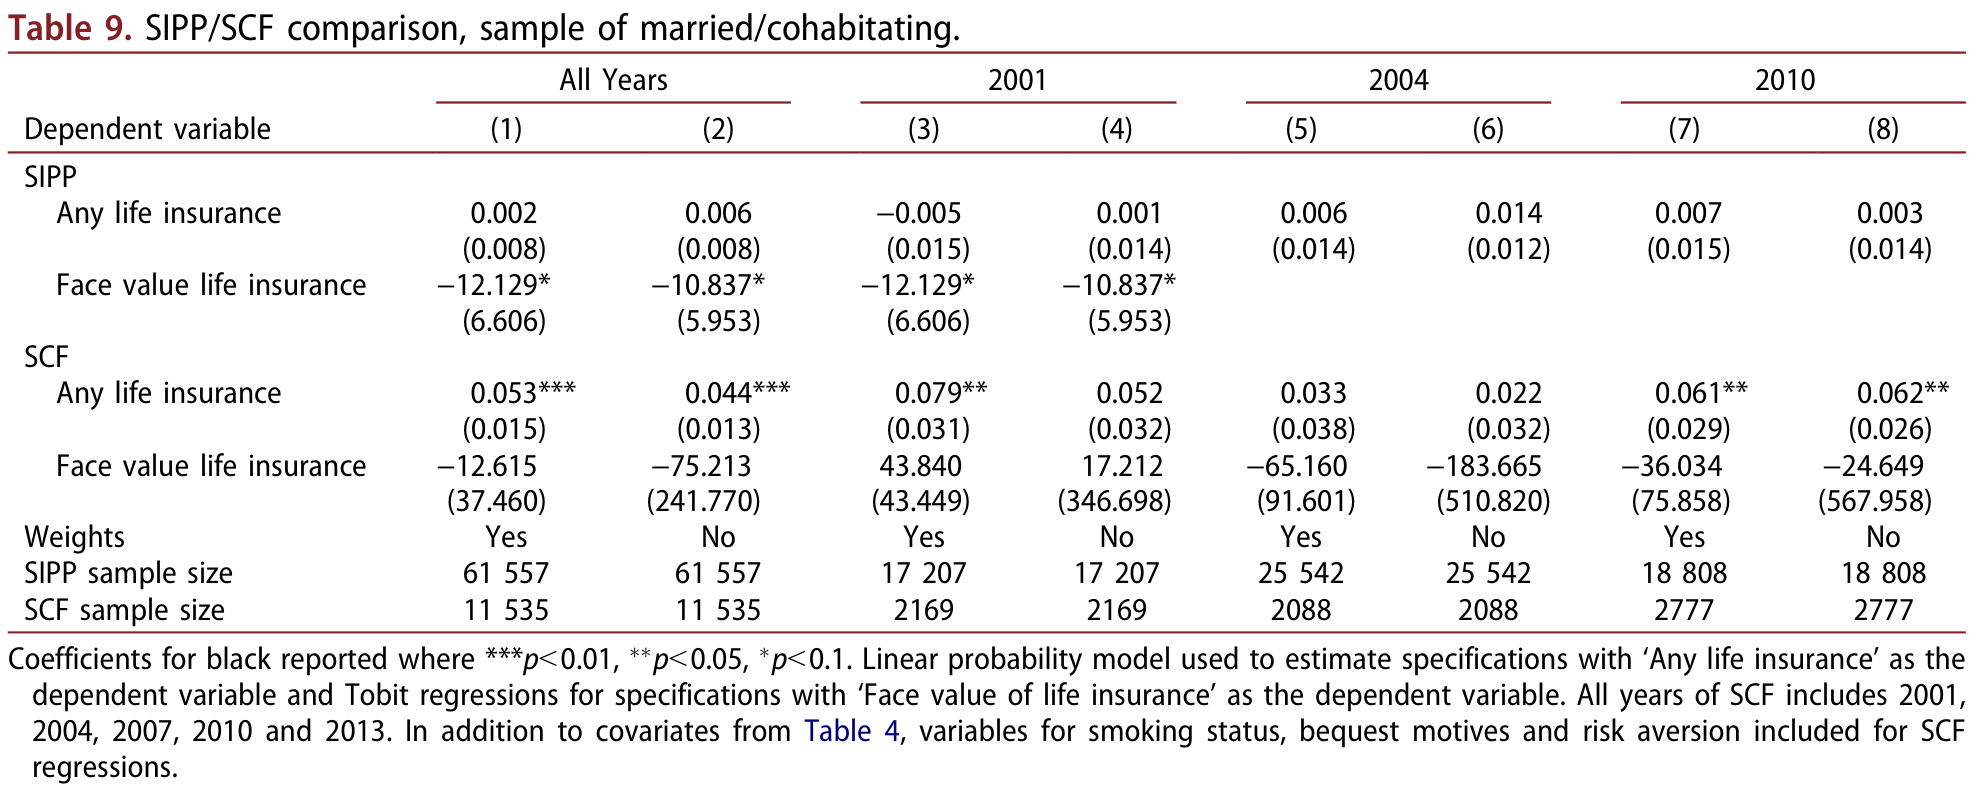
reconcile our results, we restrict our SIPP sample to married/cohabitating individuals in the first panel of Table 9, while including covariates from Table 4. The first row illustrates that when we restrict the sample to only married/cohabitating individuals, we find no statistical difference between the races in coverage, consistent with the extensive margin findings of Gutter and Hatcher (2008). The different columns illustrate that this coverage result is robust to the inclusion or exclusion of sample weights, and to each calendar year. Thus, a major difference in our extensive margin results comes from analysing the full sample of individuals rather than restricting our analysis to married/cohabitating individuals. When we look at the intensive margin (face value), we find that the
restriction to married/cohabitating individuals causes the coefficient on black to change from an insignificant number (see Table 6) to a statistically significant negative coefficient from the Tobit analysis. Once again, this restricted sample gives us the same qualitative finding as Gutter and Hatcher (2008).


### Table 9. SIPP/SCF comparison, sample of married/cohabitating

<figure class="article-figure" id="table-9"><a href="/files/publications/ay-ja-dt3mhtypba24yav3-assets/table-9.png"><img alt="Table 9. SIPP and SCF comparisons for married or cohabiting respondents, reporting Black coefficients for insurance ownership and face value with and without sample weights." height="800" loading="lazy" src="/files/publications/ay-ja-dt3mhtypba24yav3-assets/table-9.png" width="1976"/></a><figcaption>Table 9. <a href="/files/publications/ay-ja-dt3mhtypba24yav3-assets/table-9.png">Open full-resolution image</a>.</figcaption></figure>


The second panel of Table 9 shows parallel results from the SCF once again restricted to married/cohabitating households. The first column of results shows that even with the restricted married/cohabitating sample, we find that blacks are more likely to hold life insurance when we look at all years. However, when we isolate our analysis to 2004 SCF – thus using a sample similar to Gutter and Hatcher (2008) – we replicate their finding of no difference across race in life insurance coverage. However, the remaining columns show that the finding is sensitive to sample weights and the particular year of analysis.

Differences between the SIPP and SCF results could be due to differences in sample sizes, level of analysis (individual versus household) or the high proportion of wealthy individuals sampled in the SCF. Overall, we are more confident in our findings from the SIPP due to the individual level, insensitivity to weights and the larger sample sizes.
## VI. Conclusion
Using the SIPP across multiple years, we analyse racial disparities in life insurance coverage. We find, contrary to previous literature, that black individuals are more likely to hold life insurance policies after controlling for education, family structure and other important confounding factors. Previous studies have excluded households headed by a single individual – which make up more than half of black households – which matters for the findings. We also analyse the types of insurance held by race. Black individuals are more likely to hold whole and ESLI policies and only slightly less likely to hold term life insurance. Many studies have found significant racial disparities in wealth. A possible reason for this racial gap in wealth is differential mortality risk. Mortality differences can contribute to wealth gaps through two key mechanisms. First, higher mortality alters the time horizon to enjoy the return from investments, including financial, human capital and health investments. Second, a nontrivial fraction of households will suffer earnings shocks due to the death of a breadwinner, which could lead to costly financial choices. With life insurance coverage, this risk can be mitigated. Our results on life insurance coverage suggest that mortality differences, at least due to the second mechanism, should be mitigated due to greater life insurance for African Americans.

## Acknowledgement
We thank Maria Apostolova, Glenn Blomquist, Tony Creane and Frank Scott for helpful comments.

### Disclosure statement
No potential conflict of interest was reported by the authors.

## References
- Akerlof, G. A. 1970. “The Market for ‘Lemons’: Quality Uncertainty and the Market Mechanism.” The Quarterly Journal of Economics 84 (3): 488–500. doi:10.2307/1879431.


- Altonji, J. G., and U. Doraszelski. 2005. “The Role of Permanent Income and Demographics in Black/White Differences in Wealth.” Journal of Human Resources XL (1): 1–30. doi:10.3368/jhr.XL.1.1.
- Attanasio, O. P., and H. W. Hoynes. 2000. “Differential Mortality and Wealth Accumulation.” Journal of Human Resources 35 (1): 1–29. doi:10.2307/146354.
- Barsky, R., J. Bound, C. Kerwin Ko’, and J. P. Lupton. 2002. “Accounting for the Black-White Wealth Gap: A Nonparametric Approach.” Journal of the American Statistical Association 97 (459): 663–673. doi:10.1198/016214502388618401.
- Bertrand, M., S. Mullainathan, and E. Shafir. 2004. “A Behavioral-Economics View of Poverty.” American Economic Review 94: 419–423. doi:10.1257/0002828041302019.
- Bikker, J. A., and M. V. Leuvensteijn. 2008. “Competition and Efficiency in the Dutch Life Insurance Industry.” Applied Economics 40 (16): 2063–2084. doi:10.1080/00036840600949298.
- Blinder, A. S. 1973. “Wage Discrimination: Reduced Form and Structural Estimates.” Journal of Human Resources 8: 436–455. doi:10.2307/144855.
- Bureau of Labor Statistics, U.S. Department of Labor. 2016. “Employee Tenure in 2016.” https://www.bls.gov/news.release/pdf/tenure.pdf
- Cawley, J., and T. Philipson. 1999. “An Empirical Examination of Information Barriers to Trade in Insurance.” American Economic Review 89 (4): 827–846. doi:10.1257/aer.89.4.827.
- Chevalier, A. 2007. “Education, Occupation and Career Expectations: Determinants of the Gender Pay Gap for UK Graduates.” Oxford Bulletin of Economics and Statistics 69 (6): 819–842. doi:10.1111/obes.2007.69.issue-6.
- Choudhury, S. 2001. “Racial and Ethnic Differences in Wealth and Asset Choices.” Social Security Bulletin 64 (4): 1-15.
- Cotton, J. 1988. On the Decomposition of Wage Differentials.” Review of Economics and Statistics 70: 236–243. doi:10.2307/1928307.
- Curtin, R. T., T. Juster, and J. N. Morgan. 1989. “Survey Estimates of Wealth: An Assessment of Quality.” In The Measurement of Saving, Investment, and Wealth edited by R. E. Lipsey and H. S. Tice, 473–552. University of Chicago Press.
- Dehejia, R., T. DeLeire, and E. F. P. Luttmer. 2007. “Insuring Consumption and Happiness through Religious Organizations.” Journal of Public Economics 91 (1–2): 259–279. doi:10.1016/j.jpubeco.2006.05.004.
- Douglas, B. B., L. Forni, J. Gokhale, and L. J. Kotlikoff. 2003. “The Mismatch between Life Insurance Holdings and Financial Vulnerabilities: Evidence from the Health and Retirement Study.” American Economic Review 93 (1): 354–365. doi:10.1257/000282803321455340.
- Ehrlich, I., and G. S. Becker. 1972. “Market Insurance, Self-Insurance, and Self-Protection.” Journal of Political Economy 80: 623–648. doi:10.1086/259916.
- Even, W. E., and D. A. Macpherson. 2003. “Racial and Ethnic Differences in Pension Wealth.” Research in Labor Economics 22: 203–225.
- Finkelstein, A., and K. McGarry. 2006. “Multiple Dimensions of Private Information: Evidence from the Long-Term Care Insurance Market.” American Economic Review 96 (4): 938–958. doi:10.1257/000282806779468427.
- Gandolfi, A. S., and L. Miners. 1996. “Gender-Based Differences in Life Insurance Ownership.” Journal of Risk and Insurance 63 (4): 683–693. doi:10.2307/253478.
- Gelbach, J. B. 2016. “When Do Covariates Matter? And Which Ones, and How Much?” Journal of Labor Economics 34 (2): 509–543. doi:10.1086/683668.
- Gittleman, M., and E. N. Wolff. 2004. “Racial Differences in Patterns of Wealth Accumulation.” Journal of Human Resources 39 (1): 193–227. doi:10.2307/3559010.
- Grove, W. A., A. Hussey, and M. Jetter. 2011. “The Gender Pay Gap beyond Human Capital: Heterogeneity in Noncognitive Skills and in Labor Market Tastes.” Journal of Human Resources 46 (4): 827–874. doi:10.1353/jhr.2011.0003.
- Gruber, J., and A. Yelowitz. 1999. “Public Health Insurance and Private Savings.” Journal of Political Economy 107 (6): 1249–1274. doi:10.1086/250096.
- Gutter, M. S., and C. B. Hatcher. 2008. “Racial Differences in the Demand for Life Insurance.” Journal of Risk and Insurance 75 (3): 677–689. doi:10.1111/j.1539-6975.2008.00279.x.
- Handel, B. R. 2013. “Adverse Selection and Inertia in Health Insurance Markets: When Nudging Hurts.” American Economic Review 103 (7): 2643–2682. doi:10.1257/aer.103.7.2643.
- Handel, B. R., and J. T. Kolstad. 2015. “Health Insurance for ‘Humans’: Information Frictions, Plan Choice, and Consumer Welfare.” American Economic Review 105 (8): 2449–2500. doi:10.1257/aer.20131126.
- Harris, T. F. 2017. “Adverse Selection in the Group Life Insurance Market.” Working Paper.
- Harris, T. F., and A. Yelowitz. 2014. “Is There Adverse Selection in the Life Insurance Market? Evidence from a Representative Sample of Purchasers.” Economics Letters 124 (3): 520–522. doi:10.1016/j.econlet.2014.07.029.
- Harris, T. F., and A. Yelowitz. 2017. “Nudging Life Insurance Holdings in the Workplace.” Economic Inquiry 55 (2): 951–981. doi:10.1111/ecin.12390.
- He, D. 2009. “The Life Insurance Market: Asymmetric Information Revisited.” Journal of Public Economics 93 (9–10): 1090–1097. doi:10.1016/j.jpubeco.2009.07.001.
- He, D. 2011. “Is There Dynamic Adverse Selection in the Life Insurance Market?” Economics Letters 112 (1): 113–115. doi:10.1016/j.econlet.2011.03.038.
- Hedengren, D., and T. Stratmann. 2016. “Is There Adverse Selection in Life Insurance Markets?” Economic Inquiry 54 (1): 450–463. doi:10.1111/ecin.2016.54.issue-1.
- Hendren, N. 2013. “Private Information and Insurance Rejections.” Econometrica : Journal of the Econometric Society 81 (5): 1713–1762. doi:10.3982/ECTA10931.


- Hilary., W. 2002. “Mortality Differentials by Race.” ORES Working Paper.
- Hoynes, H. W., M. D. Hurd, and H. Chand. 1998. “Household Wealth of the Elderly under Alternative Imputation Procedures.” In Inquiries in the Economics of Aging, edited by D. Wise, 229–257. Chicago, IL: University of Chicago Press.
- Inkmann, J., and A. Michaelides. 2012. “Can the Life Insurance Market Provide Evidence for a Bequest Motive?” Journal of Risk and Insurance 79 (3): 671–695. doi:10.1111/jori.2012.79.issue-3.
- Iyengar, S. S., G. Huberman, and W. Jiang. 2004. “How Much Choice Is Too Much? Contributions to 401 (K) Retirement Plans.” Pension Design and Structure: New Lessons from Behavioral Finance, edited by O. Mitchell and S. Utkus. Oxford, UK: Oxford University Press, 83–95.
- Jann, B. 2008. “A Stata Implementation of the Blinder-Oaxaca Decomposition.” Stata Journal 8 (4): 453–479.
- Jappelli, T., and L. Pistaferri. 2003. “Tax Incentives and the Demand for Life Insurance: Evidence from Italy.” Journal of Public Economics 87 (7–8): 1779–1799. doi:10.1016/S0047-2727(01)00180-3..
- Kennickell, A. B. 2008. “The Role of Over-Sampling of the Wealthy in the Survey of Consumer Finances.” Irving Fisher Committee Bulletin 28: 403–408.
- Kochhar, R., and R. Fry. 2014. “Wealth Inequality Has Widened along Racial, Ethnic Lines since End of Great Recession.” Pew Research Center 12.
- Kopczuk, W., and J. Slemrod. 2005. “Denial of Death and Economic Behavior.” Advances in Theoretical Economics 5 (1). doi:10.2202/1534-5963.1207.
- Kuan, K. Y., M. R. Cullen, and S. Modrek. 2015. Racial Disparities in Savings Behavior for a Continuously Employed Cohort. National Bureau of Economic Research, Cambridge, MA.
- Liebenberg, A. P., J. M. Carson, and R. E. Dumm. 2012. “A Dynamic Analysis of the Demand for Life Insurance.” Journal of Risk and Insurance 79 (3): 619–644. doi:10.1111/j.1539-6975.2011.01454.x.
- LIMRA. 2013. “Facts of Life 2013.” http://www.limra.com/uploadedFiles/limracom/Posts/PR/LIAM/PDF/Facts-Life-2013.pdf.
- LIMRA. 2015. “2015 Insurance Barometer Study Finds Americans Continue to Overestimate Cost of Life
Insurance.” http://www.limra.com/Posts/PR/News_Releases/2015_Insurance_Barometer_Study_Finds_Americans_Continue_to_Overestimate__Cost_of_Life_Insurance.aspx.
- Lin, Y., and M. F. Grace. 2007. “Household Life Cycle Protection: Life Insurance Holdings, Financial Vulnerability, and Portfolio Implications.” Journal of Risk and Insurance 74 (1): 141–173. doi:10.1111/j.1539-6975.2007.00205.x.
- McGarry, K., and R. F. Schoeni. 2005. “Medicare Gaps and Widow Poverty.” Social Security Bulletin 66 (1): 58–74.
- Menchik, P. L., and N. A. Jianakoplos. 1997. “Black-White Wealth Inequality: Is Inheritance the Reason?” Economic Inquiry 35 (2): 428–442. doi:10.1111/j.1465-7295.1997.tb01920.x.
- Mullainathan, S., and E. Shafir. 2013. Scarcity: The New Science of Having Less and How It Defines Our Lives. New York, NY: Picador.
- Neumark, D. 1988. “Employers’ Discriminatory Behavior and the Estimation of Wage Discrimination.” Journal of Human Resources 23: 279–295. doi:10.2307/145830.
- Oaxaca, R. 1973. “Male-Female Wage Differentials in Urban Labor Markets.” International Eonomic Review 14: 693–709. doi:10.2307/2525981.
- Pfeffer, F. T., S. H. Danziger, and R. F. Schoeni. 2013. “Wealth Disparities before and after the Great Recession.” Annals of the American Academy of Political and Social Science 650 (1): 98–123. doi:10.1177/0002716213497452.
- Prudential. 2013. “The Life Insurance Coverage Gap: Strategies for Financial Professionals to Close the Gap.” https://www.lifehappens.org/wp-content/uploads/2015/02/Research_TheLifeInsuranceCoverageGap.pdf.
- Reimers, C. W. 1983. “Labor Market Discrimination against Hispanic and Black Men.” Review of Economics and Statistics 65: 570–579. doi:10.2307/1935925.
- Smith, J. P. 1995. “Racial and Ethnic Differences in Wealth in the Health and Retirement Study.” Journal of Human Resources 30: S158–S183. doi:10.2307/146282.
- Society of Actuaries, and LIMRA. 2012. “U.S. Individual Life Insurance Persistency.” https://www.soa.org/Files/Research/Exp-Study/research-2007-2009-us-ind-life-pers-report.pdf.

## Notes

<p id="source-note-1"><strong>1.</strong> Net worth for the median white household was approximately $190 000 and $19 000 for the median black household in 2007 as reported in the Survey of Consumer Finances (Kochhar and Fry 2014).</p>

<p id="source-note-2"><strong>2.</strong> Racial differences in mortality are still present after controlling for education (Waldron, 2002).</p>

<p id="source-note-3"><strong>3.</strong> Data come from the Centers for Disease Control/National Center for Health Statistics Vital Statistics System in 2009.</p>

<p id="source-note-4"><strong>4.</strong> Ten-year mortality rates are 5.7% and 9.5%, respectively, for white and black individuals at age 50.</p>

<p id="source-note-5"><strong>5.</strong> Douglas et al. (2003) use data from the Health and Retirement Survey (HRS), which is limited to individuals aged 51–61 in 1992. Harris and Yelowitz (2014) demonstrate that life insurance demand varies by age and the need for life insurance coverage diminishes as an individual approaches retirement. Consequently, findings from the HRS are likely not representative of the relevant population of life insurance purchasers.</p>

<p id="source-note-6"><strong>6.</strong> In 2010, 20% and 38% of whites and blacks, respectively, were single parents.</p>

<p id="source-note-7"><strong>7.</strong> Following Gruber and Yelowitz (1999), we exclude imputed values for life insurance due to criticism of the SIPP wealth imputation methodology by researchers (Curtin, Juster, and Morgan 1989; Hoynes, Hurd, and Chand 1998). Dropped imputed observations constitute 21% of the sample.</p>

<p id="source-note-8"><strong>8.</strong> Unless noted, we use sample weights for both the SIPP and SCF specifications.</p>

<p id="source-note-9"><strong>9.</strong> To aggregate the SIPP to the household level, we use relevant individual information from the head of the household and compile household-level responses from individuals within a household.</p>

<p id="source-note-10"><strong>10.</strong> The individual life insurance variable is subject to some measurement error due to top-coding.</p>

<p id="source-note-11"><strong>11.</strong> All figures on the composition of ESLI come from Tables 17, 18, 20 and 21 of the March 2010 National Compensation Survey.</p>

<p id="source-note-12"><strong>12.</strong> The IRS provides an exclusion for the first $50 000 of group-term life insurance coverage provider under a policy carried directly or indirectly by an employer.</p>

<p id="source-note-13"><strong>13.</strong> Using payroll data, Harris and Yelowitz ( 2017) find that the median employee at a large university had 1× salary in ESLI; the modal worker did not elect any supplemental ESLI.</p>

<p id="source-note-14"><strong>14.</strong> Other life insurance policies that also incorporate investment motives include universal life insurance and variable life insurance.</p>

<p id="source-note-15"><strong>15.</strong> Additional earners in the household can be an imperfect form of self-insurance. The same might be true for individuals with larger families or extended networks. See Ehrlich and Becker (1972) and Dehejia, DeLeire, and Luttmer (2007).</p>

<p id="source-note-16"><strong>16.</strong> Results from a Probit regression yield similar results.</p>

<p id="source-note-17"><strong>17.</strong> When a household applies for a mortgage, they may be offered credit insurance, which protects the loan on the chance that the applicant cannot make payments. Such insurance is usually optional. Credit life insurance pays off all or some of the loan if the applicant dies. See https://www.consumer.ftc.gov/articles/0110-credit-insurance.</p>

<p id="source-note-18"><strong>18.</strong> Portability and convertibility clauses in ESLI policies allow some individuals to keep ESLI policies after they leave their employment; however, they either change the type of coverage and/or significantly increase premiums paid.</p>

<p id="source-note-19"><strong>19.</strong> The results come from an implementation of the ‘oaxaca’ command in Stata (Jann 2008).</p>