# The Impact of Real Estate Agent Specialization and Activity Level on Market Outcomes

**Source edition:** Journal of Housing Research 31(2), 2022, 163–180. DOI: 10.1080/10527001.2021.2016340.

**Authors:** Jason Beck; Frank Scott; Aaron Yelowitz.

**Affiliations:** Jason Beck: Department of Economics, Georgia Southern University, Savannah, GA, USA. Frank Scott and Aaron Yelowitz: Department of Economics, University of Kentucky, Lexington, KY, USA.

**Correspondence:** Jason Beck, jbeck@georgiasouthern.edu, Department of Economics, Georgia Southern University, Hawes Hall 208, 11935 Abercorn St., Savannah, GA 31419, USA.

© 2022 American Real Estate Society.

## Abstract

Real estate agents play a critical role in reducing transaction costs in home sales. The incentives they face and the effect they have on selling price and time on market have been shown to differ depending on the legal setting governing the contractual relationship between principal (home owner) and agent. Using 8 years of Multiple Listing Service (MLS) data from a large Midwestern city, we study a market where the large majority of transactions involve a listing agent working directly with the seller and a cooperating agent working directly with the buyer. We find that more active agents sell homes more quickly, but at a lower price. Important differences emerge when we separate agents ’ roles into listing agents and selling agents.

We find that recent market activity by listing agents leads to significantly lower sales prices and a quicker sale. An additional listing in the previous 60 days is associated with a 0.3% reduction in sales price and a 0.8-day decrease in days on market. More active selling agents are associated with fewer days on market, but with no apparent impact on price. Relative to less active agents, listing agents in the most active quintile are associated with an 8% lower transaction price and 14 fewer days on market.

**Keywords:** Real estate agents; moral hazard; pricing; time on market  
**Subject codes:** R30; H32; D80; L85

## Introduction
Real estate agents are middlemen/-women who use their knowledge and ability to facilitate exchanges between buyers and sellers of homes. The frequency with which sellers and buyers choose to involve agents makes clear that market participants value their services.<sup><a href="#source-note-1" aria-label="Source note 1">1</a></sup> A number of papers have examined the effects of agents and brokers on real estate market outcomes: selling price and time on market. One area where seemingly different results have been found is how individual agents affect sales outcomes. Several researchers, such as Rutherford et al. (2005) and Levitt and Syverson (2008), have examined the principal–agent problem in real estate brokerage and investigated whether agents are able to sell their own property more rapidly or for a higher price than their clients’ properties. They find that agent-owned houses command a price premium, but find mixed results on how rapidly the home sells.

Other researchers who examine market outcomes focus on listing agents, and differentiate among agents according to their inventory of property listings. Bian et al. (2015) find that agents with a high number of listings sell their clients’ homes more slowly and for a lower price, but sell their own properties at a higher price, than the reference groups in the sample. Related research by Turnbull and Waller (2018) finds that agents with the greatest percentage of listings in the market sell them significantly more quickly and for a price premium compared with other properties.

The markets studied by these different sets of authors differ significantly in size. In smaller real estate markets individual agents may handle a significant share of total market transactions, in contrast to larger markets that are characterized by agents with atomistic market shares. The markets studied by these different authors also differ in the role played by the listing agent. In larger markets, it is much more likely that the listing agent works directly with the seller and shares the listing with potential cooperating agents who work with buyers. While dual agency does occur in large markets such as these, it is less likely than in small markets given the atomistic market presence of each agent. This stands in contrast
with smaller markets where the listing agent actively seeks out buyers and serves in a dual agency role with a significant positive probability.

The purpose of this study is to expand the line of research on the impact of agent activity level on transaction price and time on market. It has a focus similar to that of Bian et al. (2015) and Turnbull and Waller (2018), but we measure activity level differently and examine a larger market environment. This larger market is more similar to the markets analyzed by Rutherford et al. (2005) and by Levitt and Syverson (2008), where it is more likely that a listing agent works directly with the home seller and a selling agent works directly with the home buyer. We investigate whether active and experienced agents have an informational advantage or other unobserved talents that make them more persuasive in convincing their
clients to sell “too cheaply and too quickly.” Specifically, we examine the level of recent agent activity in the market, as well as specialization in representing either seller (the listing agent) or buyer (the selling agent).

We use data for the 2001–2008 period from the multiple listing service of a large Midwestern city of approximately 1 million residents. There were roughly 90,000 properties sold through the local Multiple Listing Service (MLS) in that period. Standard house and property characteristics were available, and we constructed neighborhood control variables from nine-digit ZIP codes. Because of the 8-year period over which we were able to observe real estate transactions, we also constructed measures of agent experience and market activity. These allow us to test whether and to what extent agent characteristics affect sales price and time on market.

We find that greater listing agent activity (within the previous year) is associated with a lower sales price and shorter time on market. Greater selling activity by the cooperating agent has no significant impact on sales price but is associated with shorter time on market. When listing agent activity is examined more closely, we find that very recent listing agent market activity (within the past 60 days) has a sizeable negative effect on sales price, and also on days on market. Less recent listing agent activity generally has a smaller but still significant effect. We further investigate whether superstar agents (those with a large number of transactions) produce different outcomes than less active agents. Homes listed by the most active quintile
of listing agents sell for 8% less and are on the market for 14 fewer days than otherwise. These results suggest that, compared with other agents, the most active listing agents sell their clients’ houses significantly more quickly, albeit at a lower price.

## Literature Review
A number of studies have explored the relationship between agent characteristics, such as experience, gender, race, specialization, and so on, and agent income (e.g., Benjamin et al., 2009; Glower & Hendershott, 1998; Johnson et al., 2007; Sirmans & Swicegood, 2000). Other studies have focused on the effect of agent characteristics on sales outcomes—price and/or time on market (e.g., Bernheim & Meer, 2013; Jud & Winkler, 1994; Turnbull & Dombrow, 2007; Waller & Jubran, 2012; Yang & Yavas, 1995). Still other studies have analyzed the effect of brokerage firm characteristics on sales outcomes, sometimes with contrasting results (Angjellari-Dajici et al., 2015; Beck et al., 2013; Hughes, 1995; Locke, 2020; Turnbull & Dombrow, 2007).<sup><a href="#source-note-2" aria-label="Source note 2">2</a></sup>

The principal–agent relationship between sellers of homes and listing agents is well recognized in the literature, for example, in Levitt and Syverson (2008), Rutherford et al. (2005, 2007), Bian et al. (2015), and Turnbull and Waller (2018). In an agent-assisted transaction, the listing agent carries out various activities associated with selling the home and then, if a deal is reached with a buyer, receives a commission on the final sale price. Because the commission is typically calculated as a percentage of the sale price, it might appear that the incentive of a listing agent aligns with that of the seller, since a higher sales price means a bigger commission payment received. The extra payment actually received by the agent for a marginal increase in
the sales price is likely to be quite small, however, calling into question the incentive structure.<sup><a href="#source-note-3" aria-label="Source note 3">3</a></sup>

Given the informational advantage real estate agents likely hold over their seller clients about local market conditions and the value of the house, and given the incentive structure, Levitt and Syverson (2008) speculate that agents may use their position to persuade clients to accept low offers in order to secure a quicker sale. They make use of the fact that real estate agents often sell their own homes, and thus are the sole claimant on any marginal price increase. They compare these outcomes with those observed from non-agent-owned properties via hedonic models for sale price and days on market. They find that when agents sell their own homes, even controlling for a wide range of characteristics, they keep them on the
market longer (9.55 days) and obtain a higher price (3.7%). They conclude that “agents have an incentive to convince clients to sell their houses too cheaply and too quickly.” Rutherford et al. (2005, 2007) obtain similar results when applying a comparable methodology to agent-owned houses and then specifically to condominiums.<sup><a href="#source-note-4" aria-label="Source note 4">4</a></sup> They find that agent-owned houses sell no faster but do command a significant 4.5% price premium.

Bian et al. (2015) and Turnbull and Waller (2018) explore a particular aspect of the principal–agent problem in real estate. They ask the recurring question posed by Jud and Winkler (1994) and others—“whether there are significant gains to listing with some agents in preference to others.” They focus on the most active and visible agents in the market, to see whether the divergence between homeowners’ interests and agents’ interests is greater for these types of agents.<sup><a href="#source-note-5" aria-label="Source note 5">5</a></sup> They model the behavior of an agent who lists a property for a homeowner, and then exerts effort to find a buyer for that property. Listing agents have to decide how much effort to devote to finding new listings and how much to devote to finding buyers for their existing listings. In this framework, the listing agent can end up also working with the buyer as a transaction broker with nontrivial probability. This outcome is known as dual agency.<sup><a href="#source-note-6" aria-label="Source note 6">6</a></sup>

As Brastow and Waller (2013) point out, dual agency distorts the incentives of the real estate agent, affecting both the distribution of buyers who are shown a given property and the distribution of homes that are shown to an agent’s internal buyers. Gardiner et al. (2007) study dual agency in Hawaii real estate transactions, and find a significant price discount present in dual agency transactions during the period prior to a legislative change in disclosure requirements, confirming their conjecture about misaligned incentives. Johnson et al. (2015) further explore dual agent transactions and focus on the identity of the seller. Government-owned and bank-owned properties sell at a significant discount when compared with agent-owned properties.

Elder et al. (2000) discuss changes in the role that brokers have played in residential real estate transactions, and how public policy has changed to clarify the services and responsibilities of agents and brokers to their clients. During the period of Bian et al. (2015) and of Turnbull and Waller (2018) analysis, dual agency was common in Virginia, especially in smaller real estate markets. In 2012 Virginia changed its law on real estate agency and significantly strengthened the disclosure requirements on real estate agents regarding dual agency.<sup><a href="#source-note-7" aria-label="Source note 7">7</a></sup> Generally, the fiduciary responsibility of real estate agents and brokers has differed over time and across states. In the past some states have permitted dual agency, but increasingly, states have moved either to forbid it or to
impose strong disclosure requirements. In Turnbull and Waller’s model an agent who lists a property for a seller and then goes looking for buyers has mixed incentives. There is a shopping externality for agents with large listing inventories, which would generate a higher price and shorter time on market. The sales effort per client for more active agents having more listings may be diminished, however, and lead to a lower price and longer time on market. This framework differs considerably from a market where generally a listing agent works directly with the home owner and a separate selling agent works directly with the home buyer.
### Listing Agent Effort in Large Markets
In larger markets where individual agents are atomistic and dual agency is therefore less likely, the roles of the agents working with the home owner and the prospective home buyer are straightforward. A property owner lists the house with an agent who advertises it and assists in getting it ready for showing. Additionally, in most states, the contract that the property owner signs with the listing agent includes explicit compensation for a cooperating selling agent who brings the buyer to the transaction.<sup><a href="#source-note-8" aria-label="Source note 8">8</a></sup> Other agents who have clients looking to buy a house arrange showings through the homeowner’s agent. The listing agent may have other clients whom they are helping to buy a house, or they may specialize in listing homes
and only represent sellers. The larger the real estate market, however, the lower the probability that the optimal match occurs within the listing agent’s portfolio of clients. The buyer’s agent advises their client and exerts effort helping them find a suitable house. The seller’s agent helps their client and advises them when buyers make offers. The delineation of fiduciary responsibility is clear to both listing agent and selling agent and to homeowner and prospective buyer.<sup><a href="#source-note-9" aria-label="Source note 9">9</a></sup> This is the same model implicit in Levitt and Syverson’s empirical analysis. They dismiss shirking in favor of informational advantages as the explanation for their empirical findings.

The difference that the type of market setting makes can be seen in Turnbull and Waller’s model of agent scale and performance. They start with a representative individual house listed by a representative agent. The agent devotes s search and sales effort on the property owner’s behalf. The expected selling price of the house, E[P], depends on both the agent’s effort and the size of the agent’s listing inventory, n. There is an agent-specific shopping externality wherein greater agent visibility from more listings increases agent effort productivity in finding a buyer. The probability that the listing agent sells the property herself, f(s), is subject to diminishing returns. The sole-brokered commission is <math xmlns="http://www.w3.org/1998/Math/MathML" display="inline"><mrow><msub><mi>c</mi><mi>s</mi></msub></mrow></math> and the co-brokered commission is <math xmlns="http://www.w3.org/1998/Math/MathML" display="inline"><mrow><msub><mi>c</mi><mi>o</mi></msub></mrow></math>.

Finally, the agent’s cost of acquiring and maintaining listings is wn, where w is the marginal cost to the agent of acquiring another listing.
In this model the agent’s expected profit is

<figure><a href="/files/publications/ay-ja-amkfe2lqzd3cdvel-assets/equation-1.png"><img alt="Agent profit equation combining specialist and other transactions, less specialization cost v(sn) and labor cost wn." height="57" loading="lazy" src="/files/publications/ay-ja-amkfe2lqzd3cdvel-assets/equation-1.png" width="819"/></a><figcaption>Equation 1. <a href="/files/publications/ay-ja-amkfe2lqzd3cdvel-assets/equation-1.png">Open full-resolution image</a>.</figcaption></figure>

Turnbull and Waller derive first-order conditions and discuss how the optimal sales effort is affected by the inventory shopping externality. They also explain how the agent will determine the number of listings to pursue:

<figure><a href="/files/publications/ay-ja-amkfe2lqzd3cdvel-assets/equation-2.png"><img alt="First-order condition equating expected transaction returns plus the marginal network term to marginal specialization cost and wage." height="60" loading="lazy" src="/files/publications/ay-ja-amkfe2lqzd3cdvel-assets/equation-2.png" width="891"/></a><figcaption>Equation 2. <a href="/files/publications/ay-ja-amkfe2lqzd3cdvel-assets/equation-2.png">Open full-resolution image</a>.</figcaption></figure>

In a small market where the probability is that the agent finds a buyer herself, she thus considers both the cost of acquiring the listing and the cost of additional sales effort needed to service the listing, that is, find a buyer.

In a large market where each agent is atomistic, however, the probability that the listing agent sells the house herself, f(s), approaches zero. This changes the agent’s expected profit to

<figure><a href="/files/publications/ay-ja-amkfe2lqzd3cdvel-assets/equation-3.png"><img alt="Profit for an agent with no specialization: commission c sub o times price p sub o times activity n, minus wage cost wn." height="60" loading="lazy" src="/files/publications/ay-ja-amkfe2lqzd3cdvel-assets/equation-3.png" width="330"/></a><figcaption>Equation 3. <a href="/files/publications/ay-ja-amkfe2lqzd3cdvel-assets/equation-3.png">Open full-resolution image</a>.</figcaption></figure>

and her first-order condition delineating effort to acquiring additional listings to

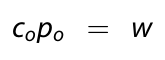
<figure><a href="/files/publications/ay-ja-amkfe2lqzd3cdvel-assets/equation-4.png"><img alt="No-specialization equilibrium condition: commission c sub o times price p sub o equals wage w." height="60" loading="lazy" src="/files/publications/ay-ja-amkfe2lqzd3cdvel-assets/equation-4.png" width="165"/></a><figcaption>Equation 4. <a href="/files/publications/ay-ja-amkfe2lqzd3cdvel-assets/equation-4.png">Open full-resolution image</a>.</figcaption></figure>

In other words, in a large market where the probability of selling your own listing is very small, the agent will seek to acquire more listings as long as the shared commission rate times the selling price equals the opportunity cost of the agent’s time. This model could be modified to make selling price a function of agent effort in advising and bargaining on behalf of the seller, but as Levitt and Syverson point out, since <math xmlns="http://www.w3.org/1998/Math/MathML" display="inline"><mrow><msub><mi>c</mi><mi>o</mi></msub></mrow></math> is a small number, the monetary incentive to do so is small. So we are back to their question: In a market where the probability of selling your own listing is small, do listing agents have an incentive to advise their clients to
sell too quickly and at too low a price?

## Data
Data were obtained from the MLS of a Midwestern city with a metropolitan population of roughly 1 million residents. Information was available on sold homes through the city’s Multiple Listing Service from January 1, 2001, through November 30, 2008.<sup><a href="#source-note-10" aria-label="Source note 10">10</a></sup> There were roughly 90,000 sold properties in the MLS over these nearly 8 years, a period during which housing prices were generally rising and before the crash and sharp downturn in housing market activity and prices.<sup><a href="#source-note-11" aria-label="Source note 11">11</a></sup> The data cover virtually all of the agent-assisted transactions in the area. Since we focus on the effects of agent characteristics on agent-assisted outcomes, the absence of “for sale by owner” homes is not problematic. The data allow for a standard set of hedonic controls, including physical characteristics, location, agent and firm-related
variables, and sales outcomes.
The data are restricted in several ways. First, we limit our analysis to sales of existing homes. Newly constructed homes are typically marketed differently from existing homes, with developers often working directly with specific real estate brokers. Simply adding a dummy variable might not accurately capture this effect, so only homes that are completed and at least 2 years old at the time of sale are included. New and under-construction homes represented approximately 11,000 observations. Condominiums could arguably be considered a different product market with different types of buyers and sellers. This study focuses on single-family homes, and thus the approximately 9,800 sold condominiums are excluded.

The sample was further restricted to homes selling for at least $20,000 but no more than $3,000,000, thus excluding approximately 2,700 sold homes. Observations with missing values or values that were illogical enough to suggest input error were also excluded. Since the MLS is a primary tool for listing agents to find buyers, incentives exist for them to enter the information accurately. Nevertheless, information is not independently verified, and approximately 5% of the observations were removed due to blank or illogical entries.<sup><a href="#source-note-12" aria-label="Source note 12">12</a></sup>

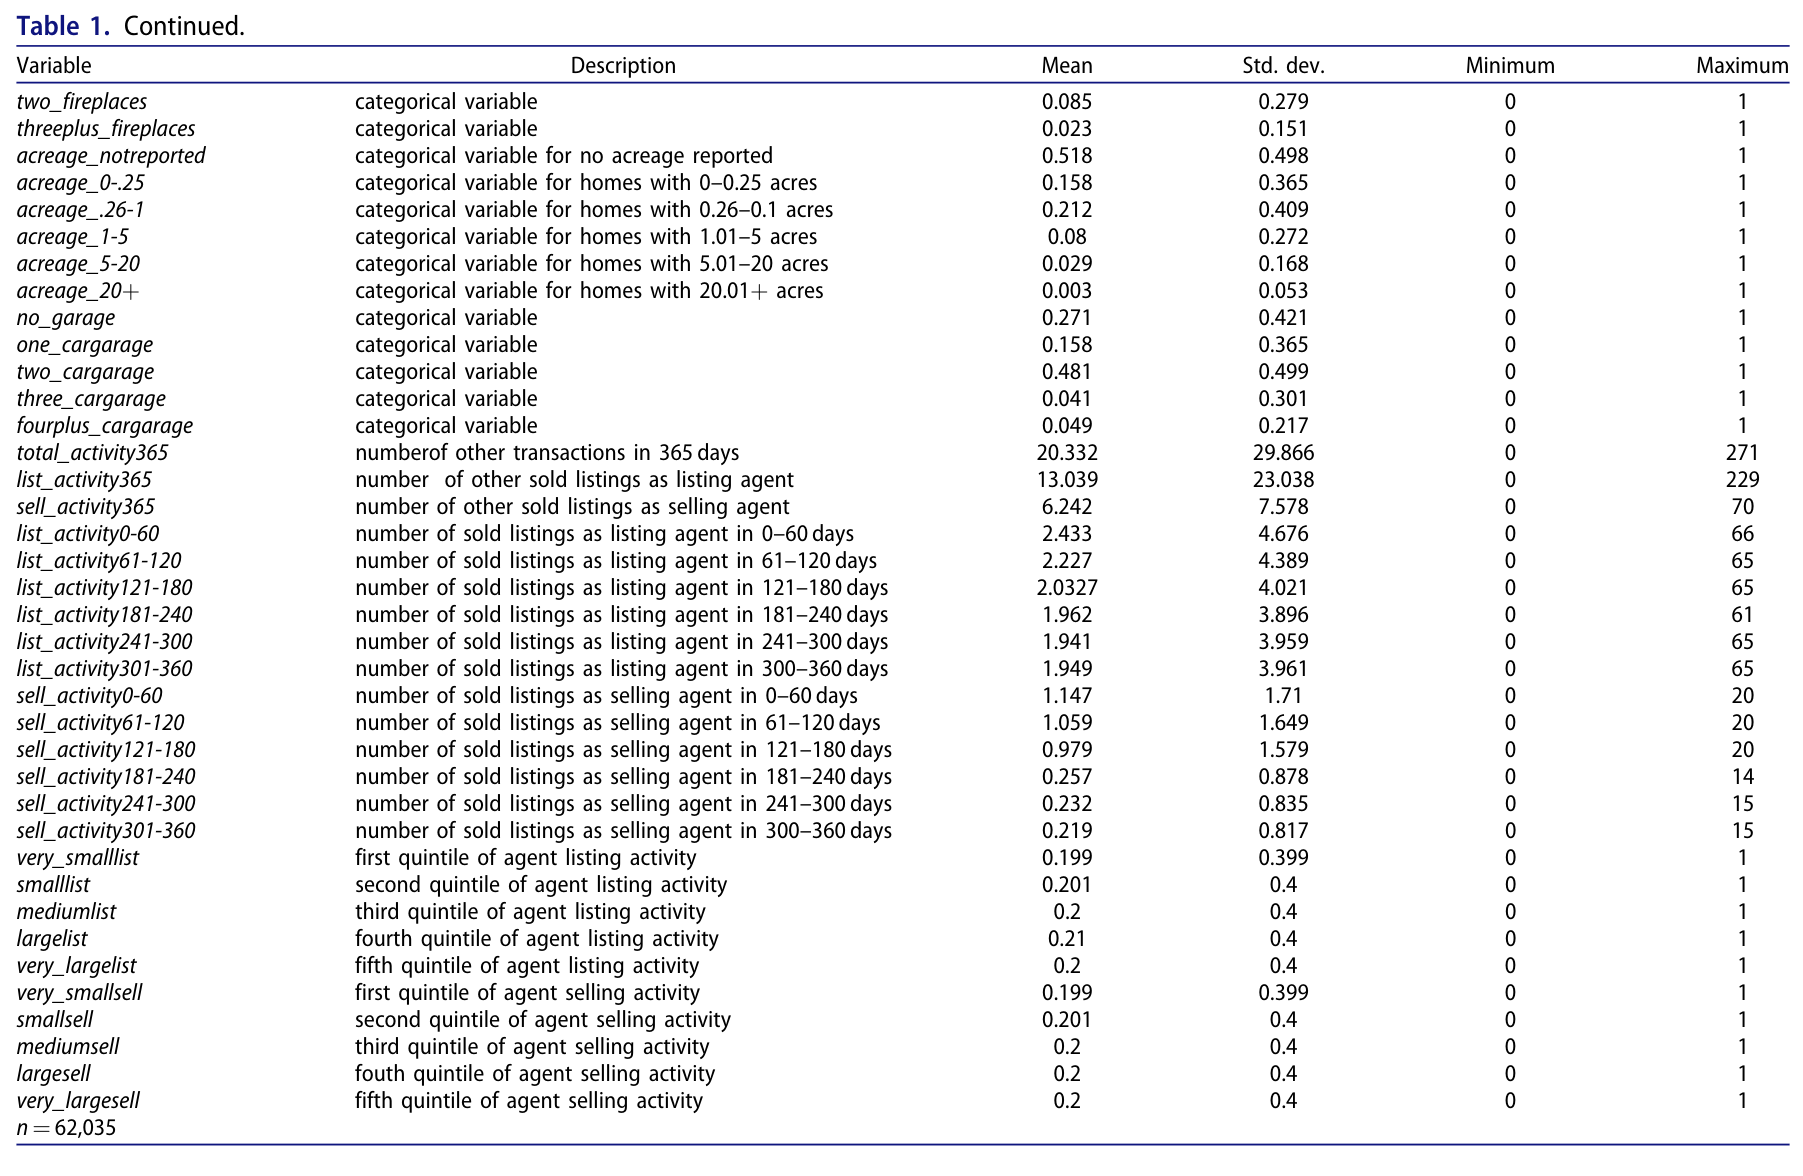
Categorical variables indicating the number of bedrooms (one_bedroom, two_bedrooms, etc.), the number of full or half bathrooms (one_fullbath, etc., zero_halfbaths, one_halfbath, etc.), and the number of fireplaces (one_fireplace etc.) associated with the observation are included. House size is controlled for via the variables sqft–sqft5, which represent square footage quintiles (see Table 1 for the specific ranges). Lot size is controlled for by dividing the range into five categories with specific ranges (see Table 1 for these ranges) and one additional category for blank entries. The variables y2001–y2008 are fixed effects for sale year to control for the effects of contemporaneous market and economic conditions.

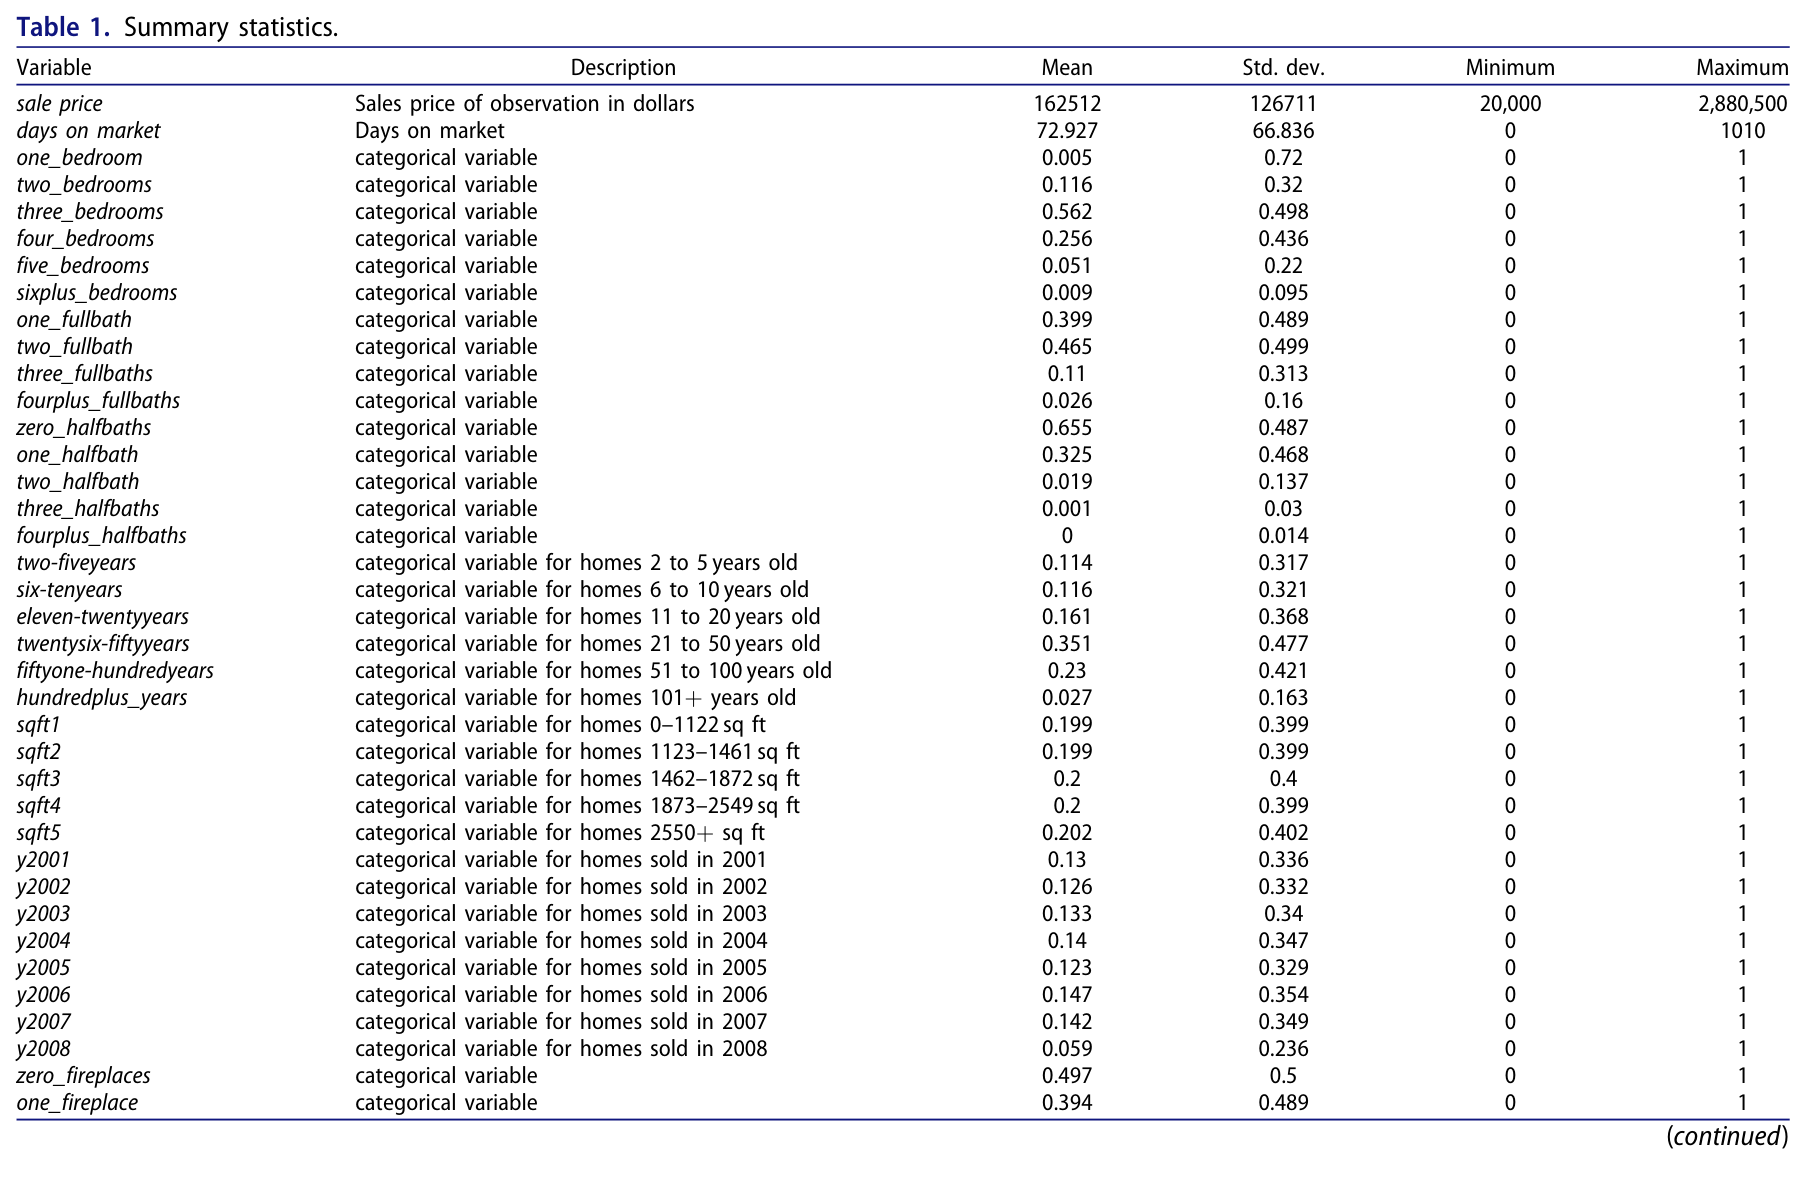
The age of the house is controlled for via a series of binary variables: two-five_years, six-ten_years, eleven-twentyfive_years, twentysix-fifty_years, fiftyone-hundred_years, and hundredplus_years. New homes, defined as those with a reported age of 0 or 1, are excluded from the analysis. Six-digit ZIP codes were created to be later used as locational controls from nine-digit ZIP codes. These were derived from the provided street address of each observation. There were 575 six-digit ZIP codes represented in the data, but of those, 226 six-digit ZIP codes each had fewer than five observations within it. The 427 observations in those 226 six-digit ZIP codes were dropped. Of the remaining 349 six-digit ZIP codes, each represented on average 0.28% of the observations. The largest represented 1.66%. The primary data set used for analysis begins with 62,035 sold houses.<sup><a href="#source-note-13" aria-label="Source note 13">13</a></sup> Summary statistics can be found in Table 1. The typical house had three bedrooms, two full baths, and was 36 years old. It sold for $162,512 and was on the market for 73 days.

### Table 1. Summary statistics

<figure><a href="/files/publications/ay-ja-amkfe2lqzd3cdvel-assets/table-1.png"><img alt="Table 1, first panel. Summary statistics for property prices, days on market, housing features and sale years, with means, standard deviations, minima and maxima." height="1179" loading="lazy" src="/files/publications/ay-ja-amkfe2lqzd3cdvel-assets/table-1.png" width="1803"/></a><figcaption>Table 1. <a href="/files/publications/ay-ja-amkfe2lqzd3cdvel-assets/table-1.png">Open full-resolution image</a>.</figcaption></figure><figure><a href="/files/publications/ay-ja-amkfe2lqzd3cdvel-assets/table-1-continuation.png"><img alt="Table 1, continuation. Property amenities and agent listing/selling activity, including time intervals and activity quintiles; sample size 62,035." height="1176" loading="lazy" src="/files/publications/ay-ja-amkfe2lqzd3cdvel-assets/table-1-continuation.png" width="1803"/></a><figcaption>Table 1 continuation. <a href="/files/publications/ay-ja-amkfe2lqzd3cdvel-assets/table-1-continuation.png">Open full-resolution image</a>.</figcaption></figure>

## Empirical Estimation and Results
### Basic Hedonic Model
Throughout the following analysis, we estimate two separate hedonic models reflecting the two dimensions of market transactions. The first model uses the natural logarithm of the sales price (ln price) as the dependent variable, while the second uses days on market (DOM) as the dependent variable. These two sales outcomes are jointly determined, and thus a two-stage least squares (2SLS) approach would be preferred.<sup><a href="#source-note-14" aria-label="Source note 14">14</a></sup> However, as Zahirovic-Herbert and Turnbull (2008) point out, finding a suitable instrument is difficult, and thus no widely agreed upon method for dealing with the endogeneity has emerged. For that reason we estimate reduced-form equations similar to those of Levitt and Syverson (2008), Shi and Tapia (2016), Angjellari-Dajici et al. (2015), and others. We control for observable home characteristics in
the basic hedonic specification with a series of dummy variables to allow for nonlinearity.<sup><a href="#source-note-15" aria-label="Source note 15">15</a></sup> This approach also follows Levitt and Syverson (2008).

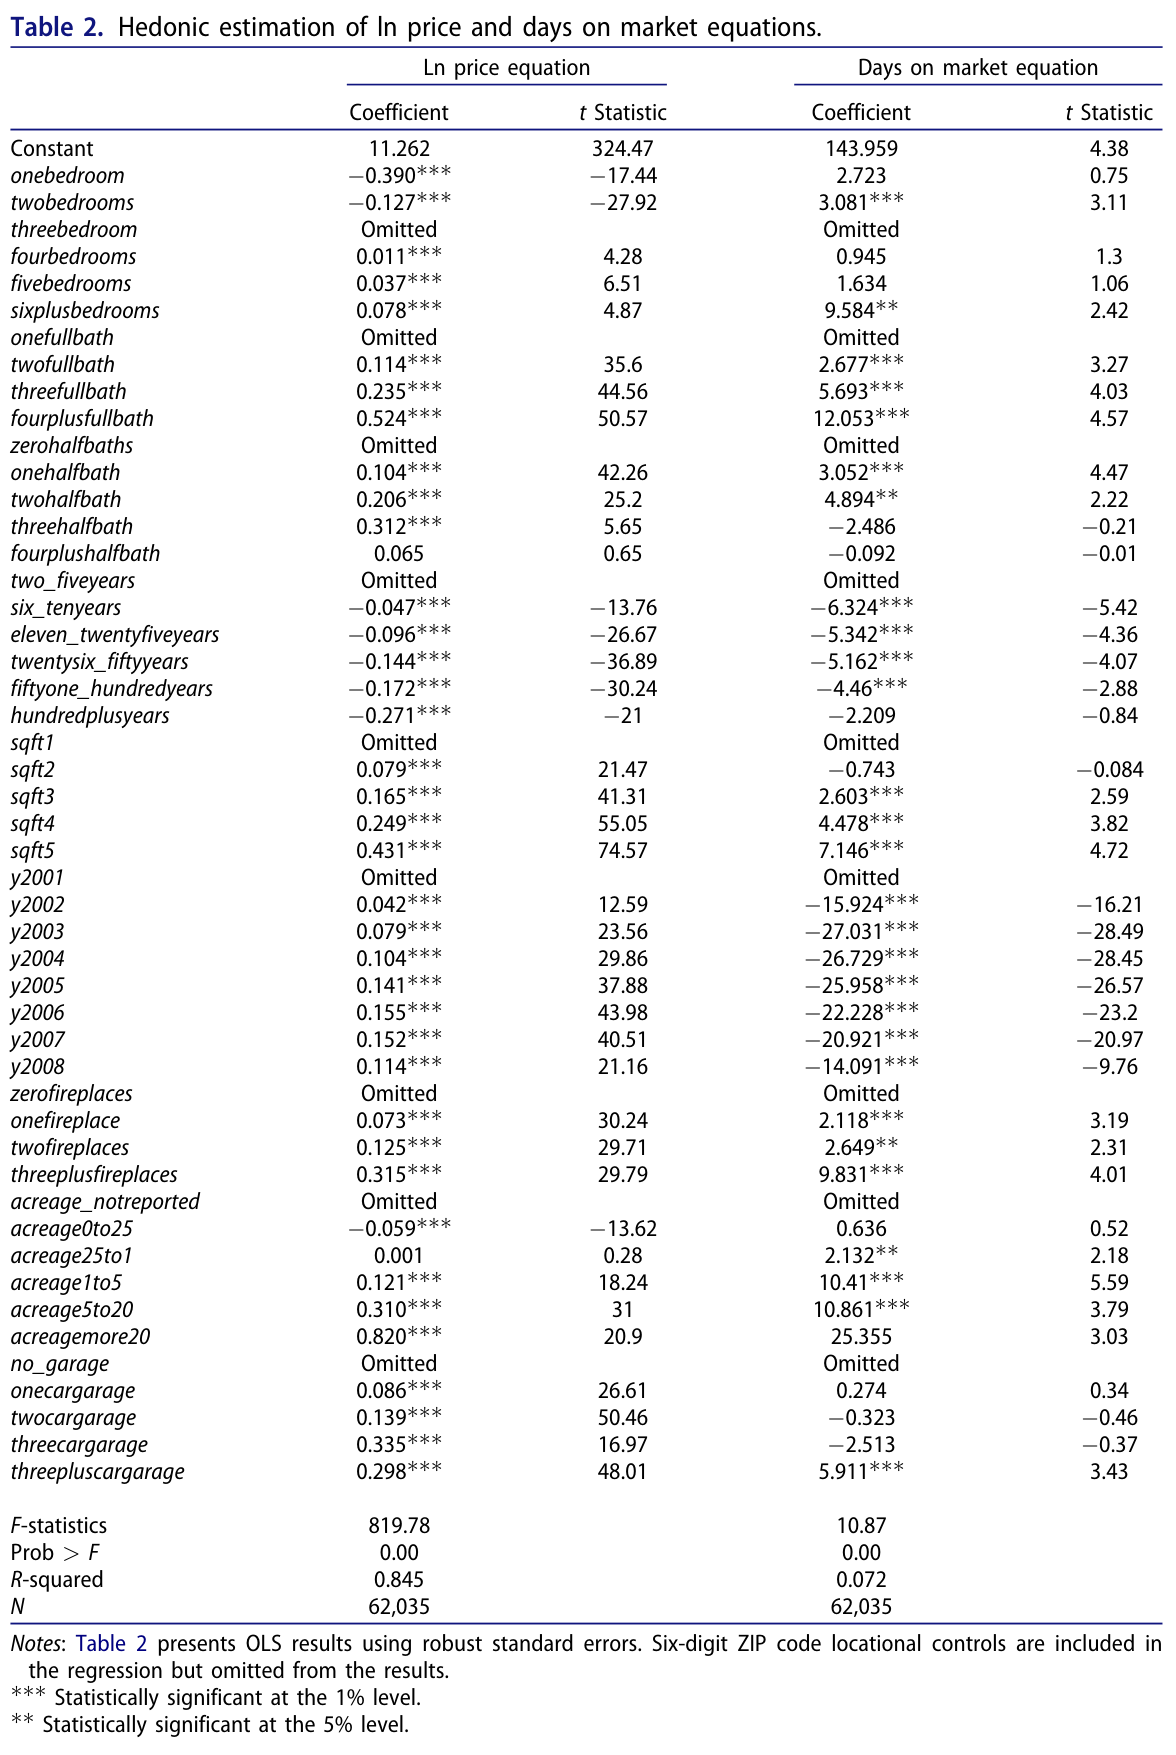
The models are estimated via ordinary least squares (OLS) with robust standard errors. Coefficients on control variables have the expected signs and magnitudes and are consistent with previous research. Examining the ln price equation results presented in Table 2, one can see that larger houses and homes with more bedrooms sell for progressively more. Referring to the DOM equation, it appears that larger homes take progressively longer to sell, all else constant.

Unsurprisingly, amenities such as larger garages and additional full or half bathrooms are associated with higher sales prices. Most coefficients have the expected signs and reasonable magnitudes. The marginal effects of a few variables, such as four_plusfullbaths and three_plusfireplaces, are associated with noticeably large increases in price (relative to the respective reference groups). These variables may be capturing correlated unobserved high-end home characteristics such as granite countertops, expensive landscaping, and so on.<sup><a href="#source-note-16" aria-label="Source note 16">16</a></sup> Older houses tend to sell for progressively less than the reference group (2 to 5 years old). All of the age categories except hundredplus_years are associated with shorter time on market, which is perhaps surprising, as one might expect newer houses to more accurately reflect current tastes,
be more desirable, and thus sell more quickly, all else equal. Larger lot sizes are associated with higher sales price and longer time on market. Generally speaking, it appears that high-end home characteristics, such as more acreage, more full bathrooms, and more square footage, generally imply a longer time on market. Sale-year fixed effects are included and are highly significant. The increase in prices in the housing market during this period is apparent, topping out at more than 15% in 2006 and 2007 relative to homes sold in 2001 (the reference category).

### Table 2. Hedonic estimation of ln price and days on market equations

<figure><a href="/files/publications/ay-ja-amkfe2lqzd3cdvel-assets/table-2.png"><img alt="Table 2. Hedonic estimates for log sale price and days on market, with property characteristics, year indicators, coefficients and t statistics." height="1755" loading="lazy" src="/files/publications/ay-ja-amkfe2lqzd3cdvel-assets/table-2.png" width="1176"/></a><figcaption>Table 2. <a href="/files/publications/ay-ja-amkfe2lqzd3cdvel-assets/table-2.png">Open full-resolution image</a>.</figcaption></figure>

### Agent Activity Variables
### Initial Specifications
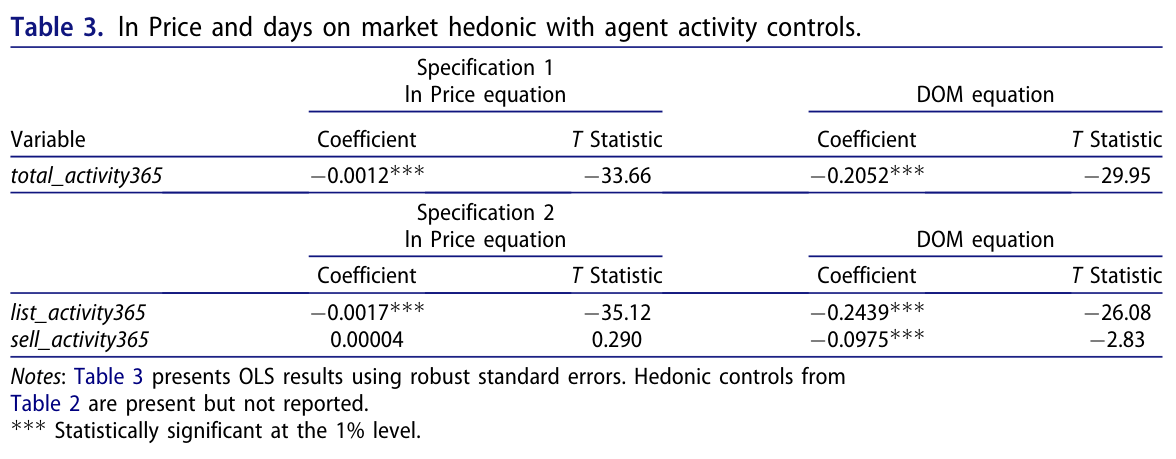
Our focus is to explore the effects of agent activity level on sales outcomes. As a first pass, a simple operationalization of agent activity was constructed and included in the two hedonic models. This variable, total_activity365, measures the number of previous real estate transactions within the previous 365 days in which the observation ’s associated listing agent was involved. Previous transactions by the associated listing agent as either a listing agent or a selling agent are counted.<sup><a href="#source-note-17" aria-label="Source note 17">17</a></sup> Results can be found in Table 3, Specification 1.

In the log sales price equation, the coefficient associated with total_activity365 is negative and statistically significant at the 1% level, implying that more active listing agents are associated with lower transaction prices, all else constant. Each additional transaction the listing agent has been involved in (as either the listing or selling agent) within the last year is associated with a 0.12% decrease in sales price. Evaluated at the mean sales price, this represents a $195 difference per previous transaction experience. Houses sold using an agent with experience that is one standard deviation above the mean are associated with a reduction in price of $5823, based on the estimated coefficients from this model.<sup><a href="#source-note-18" aria-label="Source note 18">18</a></sup>

In the DOM equation, an additional real estate transaction in the previous year in which the listing agent was involved is associated with a 0.21-day decrease in time on market. This result is also statistically significant. An agent whose experience puts them one standard deviation above the mean is associated with a 6.1-day quicker sale.

The sign and statistical significance of the results just described encourage deeper exploration into the connection between agent activity level and sales outcomes. In the next specifications, we decompose the total_activity365 variable to highlight the specific potential effects of listing activity for the listing agent and selling activity for the selling agent. List_activity365 reflects the number of other listings the listing agent has successfully closed in the last year (as opposed to listing plus selling experiences).

Sell_activity365 measures the selling agent ’s selling experience. It is the count of other sold homes that he or she has served on as a selling agent within the last year.

Results in Table 3 , Specification 2, suggest that previous listing experience by the listing agent has greater impact on both the sales price and days on market than selling experience by the selling agent. The marginal impact of an additional previously sold listing by the associated listing agent is a reduction in the sales price by 0.17%, or about $275 at sample mean home price. This result is statistically significant at the 1% level.

### Table 3. ln Price and days on market hedonic with agent activity controls

<figure><a href="/files/publications/ay-ja-amkfe2lqzd3cdvel-assets/table-3.png"><img alt="Table 3. Price and days-on-market estimates with total agent activity or separate listing and selling activity, including coefficients and t statistics." height="459" loading="lazy" src="/files/publications/ay-ja-amkfe2lqzd3cdvel-assets/table-3.png" width="1176"/></a><figcaption>Table 3. <a href="/files/publications/ay-ja-amkfe2lqzd3cdvel-assets/table-3.png">Open full-resolution image</a>.</figcaption></figure>

Sell_activity365 is not statistically significant at conventional levels, suggesting that selling agent experience has little noticeable impact on sales price of the home. This is not surprising, in that the selling agent typically works in much less direct contact with the seller than the listing agent and thus will likely be less influential in the decision to accept or refuse an offer.<sup><a href="#source-note-19" aria-label="Source note 19">19</a></sup>

In the days on market equation, again, list_activity365 has a statistically significant impact. Each previous listing transaction in which the listing agent was involved within the previous 365 days is associated with a decrease in the DOM by 0.24 days. This result and the log price results support the hypothesis that more active listing agents close deals for the home seller more quickly at lower prices. Also of interest in the DOM equation is that prior experience by the selling agent is likewise negative and statistically significant. The marginal impact of sell_activity365 is - 0.98 days. A plausible explanation for this result is that active selling agents are more familiar with the latest listings to come on the market, and are thus
more likely to show their clients houses that have only been on the market for a short time. Perhaps more plausibly, active and successful selling agents may be more assertive and better at getting the deal closed.
### Temporal Effects of Previous Agent Activity
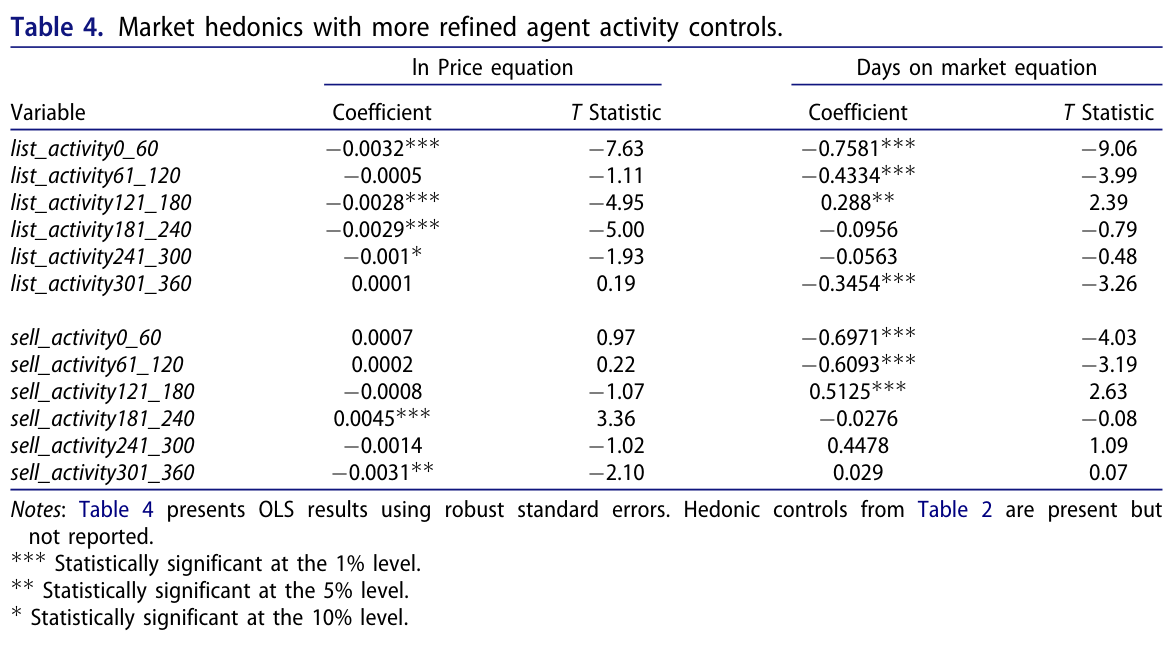
The previous results prompt us to investigate whether the timing of previous agent activity differentially affects market outcomes. Since recent transactions might be more convincingly used by agents advising clients about whether to accept an offer, we explore the timing of previous activity by decomposing the list_activity365 and sell_activity365 variables into previous transactions within specific time windows relative to the sale date of the observation.<sup><a href="#source-note-20" aria-label="Source note 20">20</a></sup>

List_activity0_60 is the number of other homes the listing agent has sold within 60 days of the observation ’s sale date. List_activity61_120, list_activity121_180, list_activity181_240, list_activity241_300, and list_activity300_360 represent a count of other sold listings for the listing agent in the windows of 61 to 120, 121 to 180, 181 to 240, 241 to 300, and 301 to 360 days, respectively. A similar series is created for the associated selling agent, sell_activity0_60, sell_activity61_120, sell_activity121_180, sell_activity181_240, sell_activity241_300, and sell_activity300_360. These variables replace the list_activity365 and sell_activity365 variables in the previous models. Results are presented in Table 4.<sup><a href="#source-note-21" aria-label="Source note 21">21</a></sup>

In the log price equation, the effect of an additional listing is largest for the most recent previous transactions by the associated listing agent. The effect appears relatively small, around three-tenths of a percent of the sales price, but recall that this is the marginal impact of a single transaction. Evaluated at mean sales price, this percentage represents $525 per previous transaction. For the average home, a listing agent with listing transactions in the past 60 days one standard deviation above the mean would be associated with a $2564 reduction in the predicted sales price. Transactions in the 121–240 days window appear to have a slightly smaller effect, though similar in magnitude. Transactions in the 61 –120 days range had no statistically significant effect. At the
241-day mark, a tapering, but still statistically noticeable, effect is observed, which disappears by the 300-day mark. These results mostly support the position that increased recent agent activity correlates with lower transaction prices. Results associated with the selling agent ’s activity fail to reveal a consistent pattern and support the position that selling agents have less impact on sales price than listing agents.

In the DOM equation, again, the most recent listing agent transactions have the largest impact and are in the hypothesized direction (downward). Each home listed and sold by the observation ’s listing agent in the last 60 days was associated with a 0.76-day decrease in days on market. For perspective, a home sold by a listing agent with an activity variable one standard deviation above the mean would sell 3.7 days more quickly relative to the mean. Previous listings in the 61 to 120 days window are associated with a 0.43-day decrease in days on market. Listings more than 120 days previous have either a smaller or a statistically insignificant effect. Each additional previous selling experience (by the selling agent) within 120 days is associated with
about a 0.6- to 0.7-day decrease in DOM.
### Nonlinearities in Agent Activity Levels
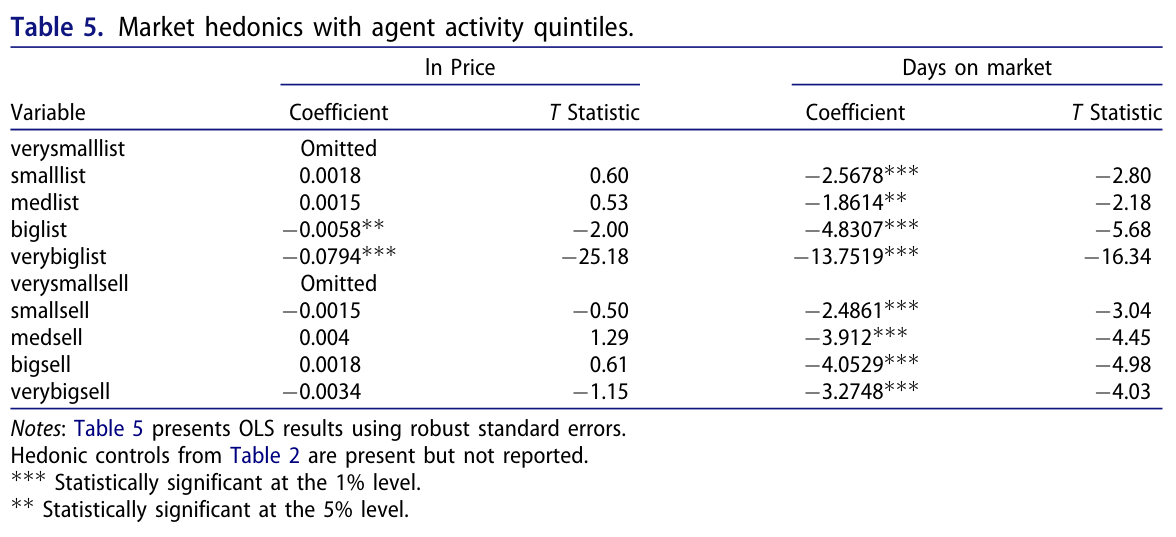
One final aspect of agent activity that we explore is the effect of superstar agents on market outcomes. Are the most successful listing agents more likely to be associated with faster sales at lower prices for their clients? Does success breed success, in that more active listing agents are more credible in convincing their clients to accept an offer too soon and at too low a price? Thus far, the level of previous transactions by the agents has entered into the equations linearly. To allow for nonlinear effects of agent activity, we divide the listexp365 and sellexp365 variables into quintiles, creating a series of five categorical variables for both the listing and selling agents. Verysmalllist is a dummy variable equal
to one if the home sold via a listing agent in the first quintile of the list_activity365 variable, with smalllist, medlist, largelist, and verylargelist each representing the remaining four quintiles. Verysmallsell, smallsell, medsell, largesell, and verylargesell represent the quintiles of the sell_activity365 variable.
### Table 4. Market hedonics with more refined agent activity controls

<figure><a href="/files/publications/ay-ja-amkfe2lqzd3cdvel-assets/table-4.png"><img alt="Table 4. Price and days-on-market estimates for listing and selling activity measured over successive 60-day intervals." height="648" loading="lazy" src="/files/publications/ay-ja-amkfe2lqzd3cdvel-assets/table-4.png" width="1176"/></a><figcaption>Table 4. <a href="/files/publications/ay-ja-amkfe2lqzd3cdvel-assets/table-4.png">Open full-resolution image</a>.</figcaption></figure>

Results in Table 5 show that homes associated with the second and third listing experience quintile, relative to the first quintile (i.e., the “small” and “medium” listing agents versus the “very small ”), exhibit no statistically significant difference in price.

However, observations associated with the fourth quintile (the “large” agents) see a statistically significant negative effect of a little more than one-half percentage point. Observations associated with the fifth quintile (the “very large ” agents) experience a much larger negative effect of 8%. Relative to transactions involving other agents, homes listed through the most active quintile of agents sold for noticeably less. Selling agent experience variables are statistically insignificant in this specification.

In the days on market equation, the most active listing agents (fifth quintile) are associated with a nearly 14-day decrease in days on market relative to the smallest (first quintile). This coefficient is much larger for the most active group than for the second through fourth quintiles ( - 2.5, - 1.9, - 4.8, respectively), suggesting that the least active listing agents take the longest to sell homes, the middle three quintiles are associated with a slightly faster sale, but the most active agents are associated with considerably decreased time on market. The model ’s predicted effect for selling agent activity was fairly consistent. The least active selling agents are associated with transactions involving homes that have been on the market for 2.5 to 4 days longer than the
transactions involving the more active other four quintiles of selling agents.
The lower prices and faster sales associated with the most active agents could be a reflection of the higher informational leverage these agents have. However, it is also possible that the observed results illustrate that the best agents are successful in part because they can communicate to their clients that focusing solely on receiving the highest possible price may not be optimal. For instance, waiting for a higher price, even if achieved, may result in a worse outcome overall for the seller when factoring in things like the additional holding costs, the added stress from prolonging the selling process, the delaying of other plans, and so on.
### Table 5. Market hedonics with agent activity quintiles

<figure><a href="/files/publications/ay-ja-amkfe2lqzd3cdvel-assets/table-5.png"><img alt="Table 5. Price and days-on-market estimates by listing and selling activity quintiles, using the lowest-activity categories as omitted groups." height="537" loading="lazy" src="/files/publications/ay-ja-amkfe2lqzd3cdvel-assets/table-5.png" width="1176"/></a><figcaption>Table 5. <a href="/files/publications/ay-ja-amkfe2lqzd3cdvel-assets/table-5.png">Open full-resolution image</a>.</figcaption></figure>

## Summary and Conclusions
As evidenced by their ubiquity, real estate agents play a critical role in housing transactions. They provide expertise in facilitating transactions and reducing risk to market participants, who usually have limited experience in the process. Not as obvious is whether middlemen/-women affect the terms of the transaction, that is, how quickly a house sells and at what price. We have analyzed more than 60,000 housing transactions over an 8-year period using data from the MLS of a large Midwestern city to determine whether agents induce their clients to sell their homes “too cheaply and too quickly.” We find that more active agents sell homes more quickly, but to the detriment of sales price.<sup><a href="#source-note-22" aria-label="Source note 22">22</a></sup>

When agents’ roles in a housing transaction are separated into listing agents and selling agents, we find that recent market activity by listing agents leads to significantly lower sales prices. Evaluated at the mean sales price, an additional listing in the previous 60 days is associated with a 0.32% or $525 reduction in sales price. Selling agents have no obvious impact on sales price. Recent market activity by listing agents also reduces the time on market. An additional listing in the previous 60 days is associated with a 0.76-day decrease in days on market. More active selling agents are associated with fewer days on market as well—an additional selling transaction within the previous 60 days is associated with a 0.7-day decrease in days on
market.
Finally, we examine whether the price and time-on-market impacts are more prevalent among the most active agents by sorting listing agents and selling agents into activitylevel quintiles. The most active quintile of listing agents is associated with a transaction price 8% lower than that of less active listing agents. There are no statistically significant differences in transaction price by activity level among selling agents. The most active quintile of listing agents is associated with a 14-day faster sale than for the least active listing agents. Among selling agents, the least active quintile is associated with between 2.5 and 4 days longer on the market than for the other four quintiles.

These results suggest that some real estate professionals, in their role as listing agent, are able to speed up the transaction (reduce days on market), albeit at a lower sales price. These agents tend to be more active, that is, they are involved as the listing agent in more transactions. One possible explanation may be that such listing agents are more persuasive and convince their clients to accept a lower price in order to move the house more quickly. Alternatively, they may simply be better at engaging clients whose houses will sell quickly, and at a lower price than the observable qualities would otherwise predict. It is not surprising that selling agents do not have any noticeable impact on sales
prices, since they generally do not have any direct interaction with the homeowner. It is also not surprising that more active selling agents are associated with fewer days on market, since they are more likely to know which properties have recently been listed for sale.
### Disclosure statement
No potential conflict of interest was reported by the authors.

## References
- Angjellari-Dajici, F., Cebula, R., & Boylan, R. (2015). Firm size, dual brokerage, and national franchise affiliation of real estate brokerage firms: Unexpected results for the period 2008–2013. Journal of Housing Research, 24(1), 175–190.
- Beck, J., Toma, M., & Page, A. (2013). Real estate brokerage firm characteristics and home sales price outcomes. International Journal of Business and Social Science, 4(13), 1–10.
- Benjamin, J. D., Chinloy, P., & Winkler, D. T. (2009). Laborsupply, flexible hours and real estate agents. Real Estate Economics, 37(4), 747–767.
- Benjamin, J. D., Jud, G. D., & Sirmans, S. (2002). What do we know about real estate brokerage? Journal of Real Estate Research, 20(1), 5–30.
- Bernheim, B. D., & Meer, J. (2013). Do real estate brokers add value when listing services are unbundled? Economic Inquiry, 51(2), 1166–1182.
- Bian, X., Turnball, G. K., & Waller, B. D. (2017). Client externality effects of agents selling their own properties. The Journal of Real Estate Finance and Economics, 54, 139–164.
- Bian, X., Waller, B. D., Turnbull, G. K., & Wentland, S. A. (2015). How many listings are too many? Agent inventory externalities and the residential housing market. Journal of Housing Economics, 28, 130–143.
- Brastow, R. T., & Waller, B. D. (2013). Dual agency representation: Incentive conflicts or efficiencies? Journal of Real Estate Research, 35(2), 199–222.
- Clauretie, T. M., & Daneshvary, N. (2008). Principle-agent conflict and broker effort near listing contract expiration: The case of residential properties. The Journal of Real Estate Finance and Economics, 37(2), 147–161.
- Doiron, J., Shilling, J., & Sirmans, C. F. (1985). Owner versus broker sales: Evidence on the amount of the brokerage commission capitalized. Real Estate Appraiser and Analyst, 51(4), 44–48.
- Elder, H. W., Zumpano, L. V., & Baryla, E. A. (2000). Buyer brokers: Do they make a difference? Their influence on selling price and search duration. Real Estate Economics, 28(2), 337–362.

- Frew, G. D., & Jud, J. (1987). Who pays the real estate broker’s commission? Research in Law and Economics, 10, 177–187.
- Gardiner, J. N., Heisler, J., Kallberg, J., & Liu, C. (2007). The impact of dual agency. The Journal of Real Estate Finance and Economics, 35(1), 39–55.
- Glower, M., & Hendershott, P. H. (1998). The determinants of realtor income. Journal of Real Estate Research, 3(2), 53–68.
- Hegeman, B., & Kantor, A. (2012). Agency change. VARealtor.com, 19(3), 20–26.
- Huang, B., & Rutherford, R. (2007). Who you going to call? Performance of realtors and non-realtors in a MLS setting. The Journal of Real Estate Finance and Economics, 35(1), 77–93.
- Hughes, W. T. (1995). Brokerage firms’ characteristics and the sale of residential property. Journal of Real Estate Research, 10, 45–56.
- Johnson, K. H., Lin, Z., & Xie, J. (2015). Dual agent distortions in real estate transactions. Real Estate Economics, 43(2), 507–536.
- Johnson, K. H., Zumpano, L., & Anderson, R. (2007). Listing specialization and residential real estate licensee income. Journal of Real Estate Research, 29(1), 75–89.
- Jud, G. D., & Winkler, D. T. (1994). What do real estate brokers do? An examination of excess returns in the housing market. Journal of Housing Economics, 3(4), 283–295.
- Kamath, R., & Yantek, K. (1982). The influence of brokerage commissions on prices of single-family homes. Appraisal Journal, 50, 63–70.
- Knight, J. R. (2002). Listing price, time on market, and ultimate selling price: Causes and effects of listing price changes. Real Estate Economics, 30(2), 213–237.
- Levitt, S. D., & Syverson, C. (2008). Market distortions when agents are better informed: The value of information in real estate. Review of Economics and Statistics, 90(4), 599–611.
- Locke, S. (2020). Paying for a name? Comparing the performance of franchised real estate brokerage firms. The Journal of Real Estate Finance and Economics, 61(1), 115–128.
- Nadel, M. S. (2021). Obstacles to price competition in the residential real estate brokerage market. Berkeley Business Law Journal, 18(1), 91–134.
- Rutherford, R. C., Springer, T. M., & Yavas, A. (2005). Conflicts between principals and agents: Evidence from residential brokerage. Journal of Financial Economics, 76, 627–665.
- Rutherford, R., Springer, T. M., & Yavas, A. (2007). Evidence of information asymmetries in the market for residential condominiums. The Journal of Real Estate Finance and Economics, 35(1), 23–38.
- Shi, L., & Tapia, C. (2016). The disciplining effect of concern for referrals: Evidence from real estate agents. Real Estate Economics, 44(2), 411–461.
- Sirmans, G., & Swicegood, P. (2000). Determining real estate licensee Income. Journal of Real Estate Research, 20(1), 189–204.
- Turnbull, G., & Dombrow, J. (2007). Individual agents, firms, and the real estate brokerage process. The Journal of Real Estate Finance and Economics, 35(1), 57–76.
- Turnbull, G. K., & Waller, B. D. (2018). (What) do top performing real estate agents deliver for their clients? Journal of Housing Economics, 41, 142–152.
- Waller, B. D., & Jubran, A. M. (2012). The impact of experience on the real estate transaction. Journal of Housing Research, 21(1), 67–82.
- Xie, J. (2018). Who is “misleading” whom in real estate transactions? Real Estate Economics, 46(3), 527–558.
- Yang, S. X., & Yavas, A. (1995). Bigger is not better: Brokerage and time on the market. Journal of Real Estate Research, 10(1), 23–33.
- Yavas, A., & Colwell, P. F. (1995). A comparison of real estate marketing systems: Theory and evidence. The Journal of Real Estate Research, 10(5), 583–600.
- Zahirovic-Herbert, V., & Turnbull, G. K. (2008). School quality, house prices and liquidity. The Journal of Real Estate Finance and Economics, 37(2), 113–130.
- Zumpano, L., Elder, H., & Baryla, E. (1996). Buying a house and the decision to use a real estate broker. The Journal of Real Estate Finance and Economics, 13(2), 169–181.

---

## Notes

<p id="source-note-1"><strong>1.</strong> The National Association of Realtors (NAR) reports that for sale by owner transactions accounted for only 8% of home sales in 2020 (https://www.nar.realtor/research-and-statistics/quick-real-estate-statistics).</p>

<p id="source-note-2"><strong>2.</strong> Benjamin, Jud, and Sirmans (2002) provide a general overview of research on real estate brokerage. Bernheim and Meer (2013) review other research on the impact of real estate brokerage on market outcomes. Doiron et al. (1985) and Frew and Jud (1987) find higher prices associated with the use of a broker, while Kamath and Yantek (1982), Yavas and Colwell (1995), and Zumpano et al. (1996) find insignificant or negative price effects.</p>

<p id="source-note-3"><strong>3.</strong> An agent selling her own $250,000 home would bear the full $20,000 loss if the price were reduced to $230,000 to close the deal. If she is listing the house for a client and there is a cooperating selling agent, then she and her broker see their commission reduced by $600.</p>

<p id="source-note-4"><strong>4.</strong> Clauretie and Daneshvary (2008) further explore this possibility by looking at the potentially changing nature of the agent/client relationship as the expiration date of the listing contract approaches. If an agent is able to use his or her informational advantage to persuade a seller to accept an offer, the incentive to do so increases as the listing contract approaches its predefined termination point. They find a correlation between lower sales prices and properties that are approaching the end of the listing contract. Bian et al. (2017) analyze the effort of agents selling clients’ properties at the same time as their own concurrently listed properties, and find that client properties stay on the market for a longer time and sell at a
    lower price.</p>

<p id="source-note-5"><strong>5.</strong> Both papers provide excellent reviews of the literature on principal–agent issues in real estate brokerage. Among others, Huang and Rutherford (2007) examine the effect of agent experience on selling price and time on market. Xie (2018) explores the impact of seller motivation, and finds that homes owned by institutional clients are sold more cheaply and more quickly than agent-owned homes, and the differences are mainly driven by less-experienced agents.</p>

<p id="source-note-6"><strong>6.</strong> Bian et al., (2015) find that agents with a very high number of listings sell their clients’ homes for 3% less and 129% more slowly than the reference groups in their sample. Turnbull and Waller (2018) find that properties listed with agents commanding 5% or more of the market sell for a 2.5% premium and 35% faster than other properties. Both studies used 1999–2009 data from Lynchburg, VA, a city with a 2010 population of 75,000 and a real estate market that averaged 760 transactions per year. In contrast, Rutherford et al. (2005) used 1999–2003 data from several counties in a large Texas city that averaged 76,717 transactions per year, and Levitt and Syverson (2008) studied 34 Cook County (Chicago, IL) suburbs during the 1992–2002 period.</p>

<p id="source-note-7"><strong>7.</strong> See Hegeman and Kantor (June/July 2012, www.varealtor.com). For a description of the explicit disclosure requirements imposed on Kentucky agents and brokers in dual agency situations, see https://smileypete.com/business/2012-03-02-the-many-faces-of-a-real-estate-agent.</p>

<p id="source-note-8"><strong>8.</strong> This is contrasted with the situation where the home buyer separately hires his or her own agent to explicitly and unambiguously represent his or her interests. See Zumpano et al., (1996) and Johnson et al. (2015).</p>

<p id="source-note-9"><strong>9.</strong> Nadel (2021) provides an interesting discussion of pocket listings and how listing agents sometimes violate their fiduciary duty by delaying the public posting of newly acquired listing.</p>

<p id="source-note-10"><strong>10.</strong> Data were available starting in year 2000, but those data were only used to create key variables which depend on previous transactions.</p>

<p id="source-note-11"><strong>11.</strong> Since some homes sold multiple times in the sample period, each home is not necessarily unique.</p>

<p id="source-note-12"><strong>12.</strong> Examples include moderately priced homes with 44 reported bathrooms and homes with a reported 10 square feet of living space.</p>

<p id="source-note-13"><strong>13.</strong> This represents a reasonably large volume of sold homes compared to some similar studies. For instance, Bian et al. (2015) and Turnbull and Waller (2018) use 12,388 and 8,352 sold homes, respectively, for their analyses.</p>

<p id="source-note-14"><strong>14.</strong> Other studies, such as Knight (2002), Turnbull and Waller (2018), Bian et al., (2015), Johnson et al. (2015), and others, take a 2SLS or 3SLS approach.</p>

<p id="source-note-15"><strong>15.</strong> As a robustness check, the models were also estimated with bedrooms, bathrooms, square footage, and those variables squared, entering as levels rather than dummy variables. Estimates related to the variables of interest were not qualitatively different from those presented in Table 2.</p>

<p id="source-note-16"><strong>16.</strong> While the data were fairly rich, they were not complete enough to account for home characteristics such as these.</p>

<p id="source-note-17"><strong>17.</strong> In cases of dual agency, the listing agent is also the selling agent. This occurred in 18.1% of sold homes. Brastow and Waller (2013) report dual agency occurring in 31.7% of transactions in a smaller market with 12,549 sold homes over 9½ years. This level of dual agency might serve as an estimate for the level of dual agency in the analysis of Bian et al. (2015) and Turnbull and Waller (2018), as all three studies use data from central Virginia over roughly the same time period and sample size.</p>

<p id="source-note-18"><strong>18.</strong> The mean of this variable was 20.3 with a standard deviation of 29.9.</p>

<p id="source-note-19"><strong>19.</strong> This result is consistent with Zumpano et al. (1996) and Levitt and Syverson (2008).</p>

<p id="source-note-20"><strong>20.</strong> Total agent activity, measured by listing plus selling transactions involving the listing agent, was also explored. Results were qualitatively similar but smaller in magnitude than those presented in Table 4.</p>

<p id="source-note-21"><strong>21.</strong> Results from 60-day time windows are discussed here and presented in Table 4, but 30- and 90-day windows were also explored. The results were qualitatively similar and are available upon request.</p>

<p id="source-note-22"><strong>22.</strong> Real estate agents who sell their own house typically have different objectives and face different constraints than homeowners who hire an agent to help them sell their house. The optimal price and time-on-market strategy for a liquidity-constrained family moving to take a job in a different location is likely very different from that of an experienced real estate agent who buys and sells houses in a given location for a living. That an agent waits longer and gets a higher price when acting on their own behalf does not imply that they are not representing the best interests of their clients when their clients’ houses sell faster and at lower prices.</p>