# How does occupational licensing affect entry into the medical field? An examination of emergency medical technicians

**Authors:** Aaron Yelowitz; Samuel J. Ingram.

**Affiliations:** Aaron Yelowitz: Department of Economics, University of Kentucky, Lexington, Kentucky, USA. Samuel J. Ingram: Division of Bank Regulation, Federal Housing Finance Agency, Washington, District of Columbia, USA.

**Correspondence:** Aaron Yelowitz, Department of Economics, University of Kentucky, Lexington, KY, USA. Email: aaron@uky.edu.

**Source edition:** Symposium article, Southern Economic Journal, 2021, 1–24. DOI: 10.1002/soej.12525. © 2021 The Southern Economic Association.

## Abstract

The COVID-19 pandemic has led to temporary suspensions of many occupational licensing laws in an effort to manage surges in health care demand. The crisis highlights more general concerns about occupational licensing laws, yet convincing empirical evidence on the degree to which such laws have inhibited entry into health care professions is scarce. In this study, we indirectly examine how occupational licensing affects the choice to become an emergency medical technician (EMT) by exploiting the demand-side shock from the Affordable Care Act (ACA). We find suggestive evidence that while the demand-side shock from the ACA increased the likelihood of being an EMT, this effect was substantially moderated by more stringent occupational licensing laws. The implied effects for young individuals in
the most careful specification suggests virtually complete offset; the ACA demand-side shock would increase entry by 18 percentage points, while occupational licensing restrictions reduce entry by a similar magnitude.

**Keywords:** emergency medical technicians, emergency services, occupational choice, occupational licensing  
**JEL classification:** J44; K31; I13

## 1. INTRODUCTION
The role of occupational licensing in health care has become a key concern in response to the COVID-19 pandemic in the United States. In March 2020, the Trump Administration announced that medical workers would temporarily be able to work in states in which they are not licensed (Council of Economic Advisors, 2020). Such licensing regulations are a longstanding concern to the efficient supply of health care (Blackman, 2016; Svorny, 2017). The inability of doctors and other health care professionals to work across state lines is one of many barriers to the efficient supply of medical services. The existing licensing framework may dampen the response of medical services in times of crisis or periods with fluctuating medical demand. Timmons et al. (2020) outlines the current occupational
licensing frictions affecting the COVID-19 response and discusses potential policy remedies including reducing scope of practice barriers, introducing temporary waivers for licensing requirements, issuing out-of-state temporary licensing permits, allowing retired personnel to practice without a license, and waiving continuing education requirements and fees.

In the immediate crisis, states have responded with temporary changes in licensing requirements (Greenberg, 2020; Hentze, 2020). While the short-term concern is the ability of medical providers to meet surges in health care demand, the longer-run impact could be to reallocate workers across professions. Barrero et al. (2020) suggest licensing will play an important role in the distributional efficiency of the labor response. The discussion about occupational licensing of health care professionals during a time of crisis invites a deeper analysis of the regulatory impact in non-crisis periods as well.

A key empirical challenge for all studies of occupational licensing in identifying impacts on entry, exit, or other labor market effects is the cross-sectional nature of state policies, where there are limited changes in requirements over time. As a consequence, traditional identification strategies used to evaluate other labor market interventions (such as minimum wages, paid sick leave, or paid family leave) are of limited use with occupational licensing. This study uses local demand shocks associated with the Affordable Care Act (ACA) to surmount this identification issue. Specifically, we examine the decision to become an emergency medical technician (EMT), where alternative occupational choices exist outside of health care (e.g., in protective services). The demand-side shock should induce entry; however, more
costly state-level occupational licensing requirements should moderate this effect. Using a large individual sample from the American Community Survey (ACS), we find support for these hypotheses. In the full sample of workers of all ages, we find suggestive evidence (where the estimates are marginally significant) of both entry induced from the demand-side shock and moderated by occupational licensing requirements. For younger workers—where the occupational choice decision is presumably more responsive to labor market conditions and entry costs—we find stronger effects. The ACA demand shock-induced substantial entry into the EMT field among adults under the age of 40, but in states with more stringent licensing restrictions, this potential entry was completely offset. Evaluated at the average number of days to
complete EMT training and the pretreatment uninsured rate, the implied effects for young individuals in the most careful specification suggests virtually complete offset; the ACA demand-side shock would increase entry by 18 percentage points, while occupational licensing restrictions reduce entry by a similar magnitude. Results from an event-study analysis and several robustness checks further corroborate these findings, and also show the demand-side shock (and moderating effect) was strongest immediately after ACA implementation and fades thereafter.

The remainder of the paper is arranged as follows. Section 2 reviews the existing literature on occupational licensing and discusses how the gains in insurance coverage from the ACA lead to a demand-side shock for health care. Section 3 presents the primary dataset used in the analysis – the ACS, as well as supplementary data on occupational licensing costs and localized insurance gains. Section 4 lays out the identification strategy for the difference-in-difference-in-differences (DDD) specification and event-study model. Section 5 presents the findings on occupational choice, as well as showing several robustness checks. Section 6 concludes.
## 2. LITERATURE REVIEW
### 2.1. Occupational licensing requirements
Occupational licensing is one of the largest labor market institutions with ~25% of the labor force required to obtain a license to work (Ingram, 2019). Licensing laws are determined by the states and can vary considerably from one state to the next. The proposed benefits of the laws are consumer safety, but policy and academic work has been increasingly interested in the potential costs. These potential costs include a decrease in service providers, higher prices for consumers, and barriers to mobility and services across state lines.

Occupational licensing laws are an important barrier to entry for health care professionals and one of the targeted areas for health care reform (Cannon, 2017). Medical workers in most professions, including EMTs, are required to obtain a state license to work. These regulations present workers with both barriers to entry as well as barriers to working across state lines.

The current literature on occupational licensing policies in the United States emphasizes the potential impacts of state licensing regulations on labor market outcomes. Evidence suggests potential reductions in the quantity of workers in licensed occupations and an associated increase in earnings (Kleiner, 2006). In addition, McMichael (2017) finds higher political spending by physicians resulted in higher levels of licensing within the state. Licensing laws are also at the center of the discussion around the quantity of health service providers in the United States.

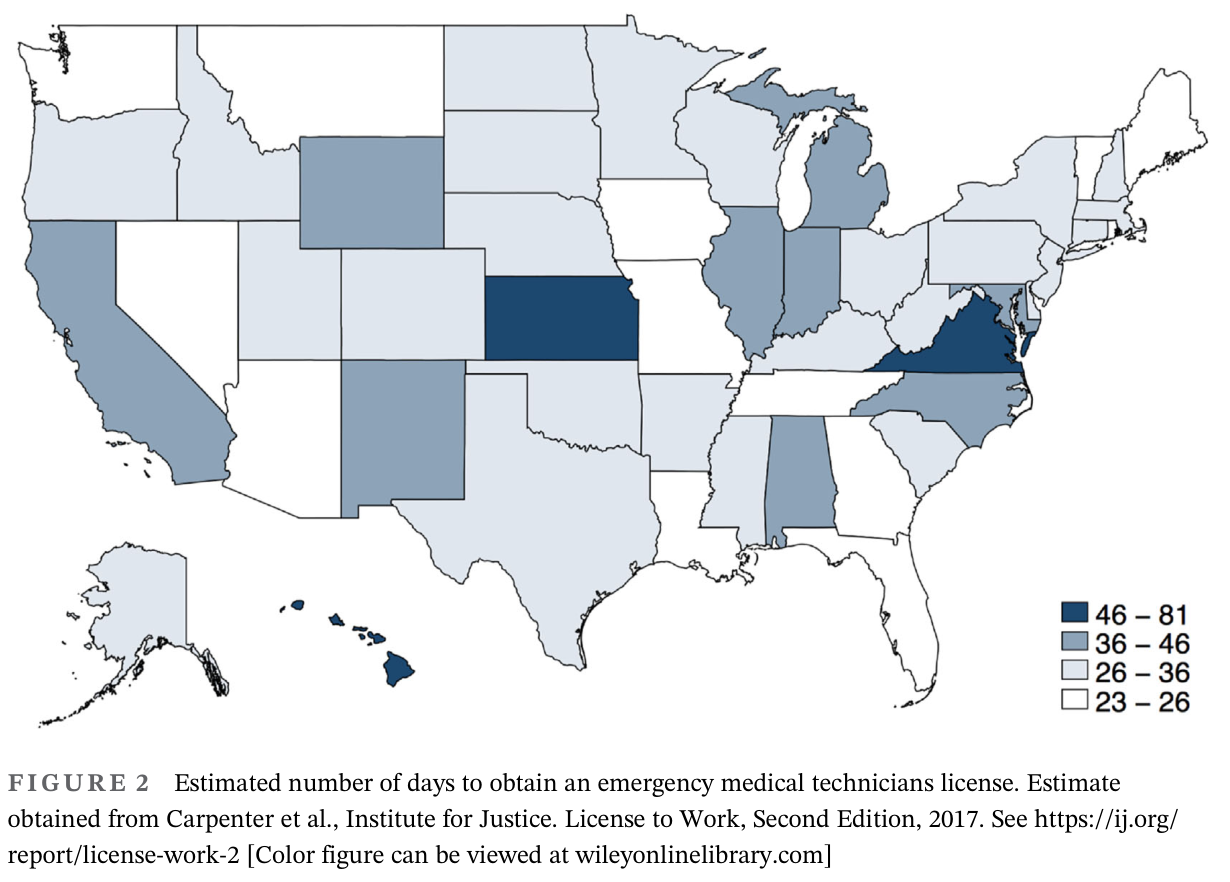
EMT licensing requirements are determined by a state board. States vary in their requirements but, generally, an aspiring EMT must have a high school degree, take an EMT training course lasting several weeks or months, pass one or two licensing exams, pay a state fee, and pass a background check. The estimated days required to obtain an EMT license from Carpenter et al. (2017) are shown in Figure 2 for each state. Across all states, the required time to get a license varies from 23 to 81 days, with a median of 35 days.

An ongoing challenge of occupational licensing studies, including this paper, is that regulations are cross-sectional in nature and vary little over time. Several approaches have been taken in an attempt to overcome this challenge. Friedman and Kuznets (1945), and many studies since, compare licensed professions to similar unlicensed professions. Other studies have analyzed the adoption of medical licensing laws over long time horizons including midwives (Anderson et al., 2020) and dentists (Kleiner & Kudrle, 2000). Others have used changes in testing requirements and licensing status or cross-sectional variation in licensing costs and licensing status for specific occupations including teachers (Angrist & Guryan, 2008), radiologic technologists (Timmons & Thornton, 2008), nurses (Kleiner et al., 2016), barbers (Timmons & Thornton, 2019), and cosmetologists (Zapletal, 2019). Evidence suggests licensing entry costs reduce employment across occupations, increase the time it takes for new workers to enter the occupation, and limit the mobility of workers across states in response to demand shocks (Blair & Chung, 2018; Ingram & Yelowitz, Forthcoming; Koumenta & Pagliero, 2016; Soileau et al., 2017). To overcome the cross-sectional identification challenge, we adopt a similar approach as our previous work (Ingram & Yelowitz, Forthcoming), where we analyzed the entry response of real estate agents relative to other similar professions.

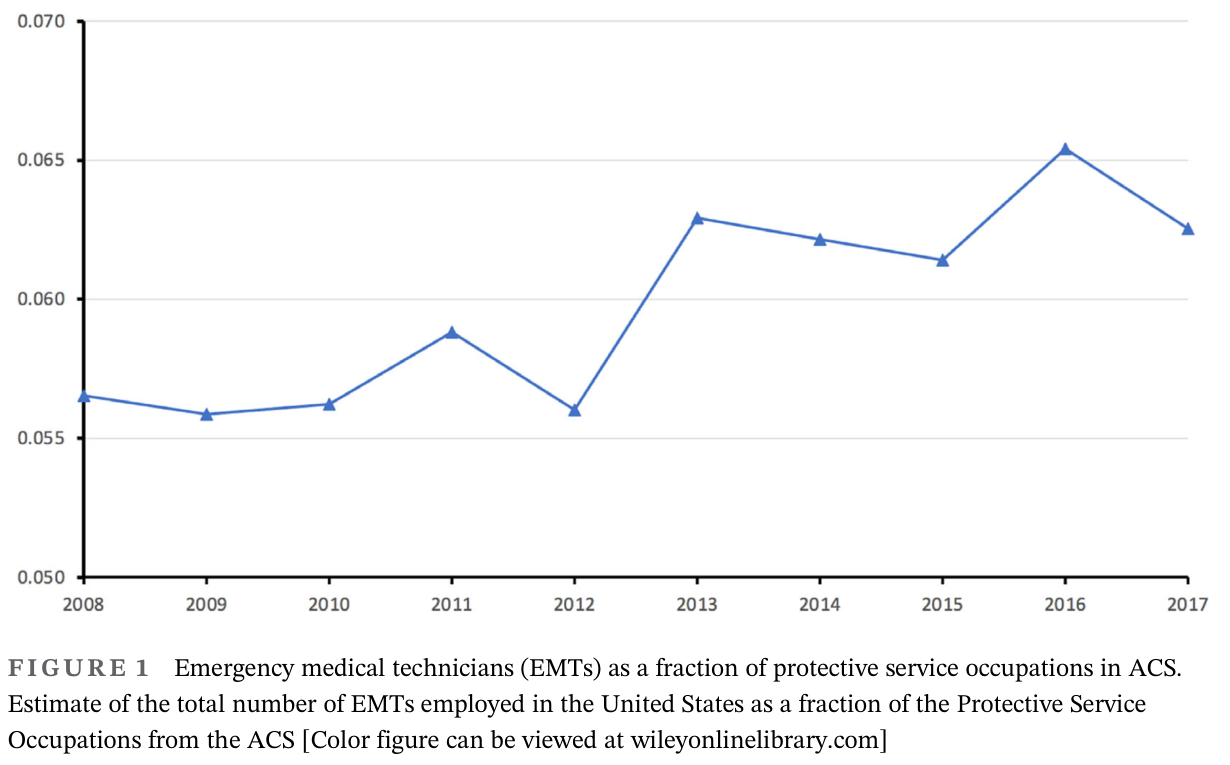
### Figure 1. Emergency medical technicians (EMTs) as a fraction of protective service occupations in ACS. Estimate of the total number of EMTs employed in the United States as a fraction of the Protective Service Occupations from the ACS.

<figure><a href="/files/publications/ay-ja-5i36oi7xhlxlv4el-assets/figure-1.png"><img alt="Figure 1: EMTs as a fraction of protective-service occupations in the ACS, 2008–2017. The share is about 5.6% in 2008–2012, rises in 2013 and peaks near 6.5% in 2016." height="765" loading="lazy" src="/files/publications/ay-ja-5i36oi7xhlxlv4el-assets/figure-1.png" width="1230"/></a><figcaption>Figure 1. <a href="/files/publications/ay-ja-5i36oi7xhlxlv4el-assets/figure-1.png">Open full-resolution image</a>.</figcaption></figure>
**Caption:** Emergency medical technicians (EMTs) as a fraction of protective service occupations in ACS. Estimate of the total number of EMTs employed in the United States as a fraction of the Protective Service Occupations from the ACS.

From 2005 to 2018, there was an increase in the number of EMTs from 155,000 to more than 250,000, with a significant rise starting in 2013.<sup><a href="#source-note-1" aria-label="Source note 1">1</a></sup> Figure 1 shows the fraction of the labor force that are EMTs relative to protective service occupations from 2008 to 2017. The time series evidence shows a flat share from 2008 through 2010, and is suggestive of a distinct jump starting in 2013 (with more muddled responses in the intervening years). In theory, both capital (ambulances) and labor (EMTs) should respond quickly to changes in demand for emergency services. In practice, occupational licensing barriers have been shown to have significant effects on employment and entry.
### 2.2. The affordable care act
The wide-ranging health care reform passed in 2010 had the stated goal of increasing health insurance coverage. The major provisions of the ACA, which took effect in 2014, succeeded in increasing health insurance coverage, with the strongest effects in states that expanded Medicaid (Courtemanche et al., 2017). This expanded insurance coverage and the associated subsidies were estimated to result in significant increases in the demand for medical services (Kirch et al., 2012) and health care workers (Spetz et al., 2012). Although one goal of the ACA is to shift medical use away from less efficient forms, such as emergency services, and toward preventative care, some evidence suggests this has not occurred (Gold et al., 2014 and Ostermayer et al., 2017).

### Figure 2. Estimated number of days to obtain an emergency medical technicians license. Estimate obtained from Carpenter et al., Institute for Justice. License to Work, Second Edition, 2017. See https://ij.org/report/license-work-2

<figure><a href="/files/publications/ay-ja-5i36oi7xhlxlv4el-assets/figure-2.png"><img alt="Figure 2: state map of estimated days to obtain an EMT license. The four legend bands are 23–26, 26–36, 36–46 and 46–81 days; Kansas, Virginia and Hawaii are in the highest band." height="882" loading="lazy" src="/files/publications/ay-ja-5i36oi7xhlxlv4el-assets/figure-2.png" width="1230"/></a><figcaption>Figure 2. <a href="/files/publications/ay-ja-5i36oi7xhlxlv4el-assets/figure-2.png">Open full-resolution image</a>.</figcaption></figure>
**Caption:** Estimated number of days to obtain an emergency medical technicians license. Estimate obtained from Carpenter et al., Institute for Justice. License to Work, Second Edition, 2017. See https://ij.org/report/license-work-2.

The ACA has affected the overall labor market through several channels. Across labor markets, employers may face an increase in labor costs associated with additional insurance requirements (Harris & Mok, 2015; Mulligan & Gallen, 2013). In addition, an employee's willingness to switch firms or leave the workforce may be affected by the ACA provisions (Leung & Mas, 2018). Importantly for our purposes, increased demand for medical services may lead to supply-side entry for medical workers. Dillender (2020) finds that increased Medicaid eligibility led to posting of more job vacancies and hiring of additional health care workers, with lowskilled workers appearing to be most responsive.
### 2.2.1. Insurance gains and increased utilization
Using a variety of datasets including the American Community Survey (ACS) and Behavioral Risk Factor Surveillance System (BRFSS), recent studies have shown gains in insurance coverage from both the public and private portion of the ACA, and those gains were caused by the legislation rather than other factors. Moreover, there were large increases in coverage in 2014 and 2015, and generally leveled off thereafter.

The earliest published work provided descriptive evidence from the 2013 and 2014 ACS and found heterogeneous gains by state Medicaid expansion status, age, income level, and source of coverage (Courtemanche et al., 2016). For example, insurance coverage increased by ~9 percentage points for non-elderly adults under 100% of the FPL in expansion states and about 5 percentage points in non-expansion states. The earliest causal evidence also used the ACS and a DDD approach to allow for the identification of the impacts in both expansion and nonexpansion states separate from other factors (Courtemanche et al., 2017). In 2014, at the average pre-treatment uninsured rate, the full ACA increased the proportion of non-elderly adults with insurance by 5.9 percentage points compared with 2.8 percentage points in states that did not expand Medicaid. Other work using the ACS through 2015 found premium subsidies (part of the private portion of the ACA) produced 40% of the coverage gains explained by policy measures, while Medicaid explained 60% of the gains including significant woodwork effects (Frean et al., 2017).

In examining effects through 2016, the ACA significantly reduced coverage disparities across income, race, marital status, and age (Courtemanche et al., 2019). By 2016, the full ACA increased the proportion of non-elderly adults with insurance by 8.7 percentage points compared to 4.0 percentage points in states that did not expand Medicaid. Finally, event-study models using the BRFSS shows steady gains, rising to ~12 percentage points in expansion states until 2016, and a leveling-off afterwards. Similarly, insurance coverage rose ~8 percentage points in non-expansion states until 2016, and then remained at about the same level afterwards. (Courtemanche et al., 2020).

Recent work summarizes robust evidence of gains in utilization (outpatient care, prescription drugs, and mixed evidence on emergency care), with most studies focused only on the Medicaid expansions (Gruber & Sommers, 2019). Additional work examining both the public and private portions of the ACA show sizable improvements in access to care from both portions 2 and 3 years after implementation (Courtemanche et al., 2018a, 2018b). Additionally, the ACA increased preventive care utilization (Courtemanche et al., 2019).
### 2.2.2. Supply-side responses
Overall, the ACA reduced the number of uninsured by ~20 million by 2016, with large increases in both public and private coverage (Garrett & Gangopadhyaya, 2016). A natural concern is the ability of the supply-side of the health care market to adjust to increased demand induced by lower out-of-pocket prices. Indeed, recent studies using the BRFSS find at best modest improvement in health from the ACA (Courtemanche et al., 2018a, 2018b; Courtemanche et al., 2019), potentially suggesting supply-side issues.

To date, several studies have convincingly examined supply-side issues through examination of ambulance response times and the nature of the call. In a case–control study of more than 4.7 million ambulance transports in New York City from January 1, 2013, to July 31, 2016, the expansion of insurance from the ACA was associated with a statistically significant increase in ambulance dispatches for minor injuries compared with ambulance dispatches for more severe injuries (Courtemanche et al., 2019). This finding suggests the increase in demand may have led to congestion and slower response times.

More directly, the same research team examined capacity challenges faced by health care providers through ambulance response times (Courtemanche et al., 2019). Exploiting temporal and geographic variation in the implementation of the ACA as well as pre-treatment differences in uninsured rates, they estimate that the expansions in coverage slowed ambulance response times by an average of 24%. They conclude that more individuals now availed themselves of emergency medical services, and the coverage gains from the ACA added strain to emergency response systems.

## 3. DATA SOURCES
### 3.1. Occupational sample from ACS
Our primary data source is the ACS, a nationwide survey administered by the Census Bureau asking detailed questions about population and housing characteristics. The ACS samples ~1% of the U.S. population. Like the decennial Census, participation is mandatory, and the survey can be completed online or by mailing in a paper questionnaire. The ACS identifies all 50 states and the District of Columbia, and additionally identifies localities known as Public Use Microdata Areas (PUMAs)—~2,300 areas of at least 100,000 people nested entirely within a state.

We follow the approach in earlier studies by focusing attention on a narrow occupation with restrictive licensing requirements and finding comparable substitute occupations that would not have been affected by the demand shock, which gives us identifying variation (Ingram & Yelowitz, Forthcoming). The ACS is appealing for our study because of the large number of observations—over 3,000,000 individuals per year. When focusing on a narrow occupation like EMTs—where estimates find 262,100 jobs nationally in 2018—our analysis will need a large initial sample in order to possibly estimate precise effects from the demand-side shock from the ACA and the interaction with occupational licensing requirements (BLS, 2020).

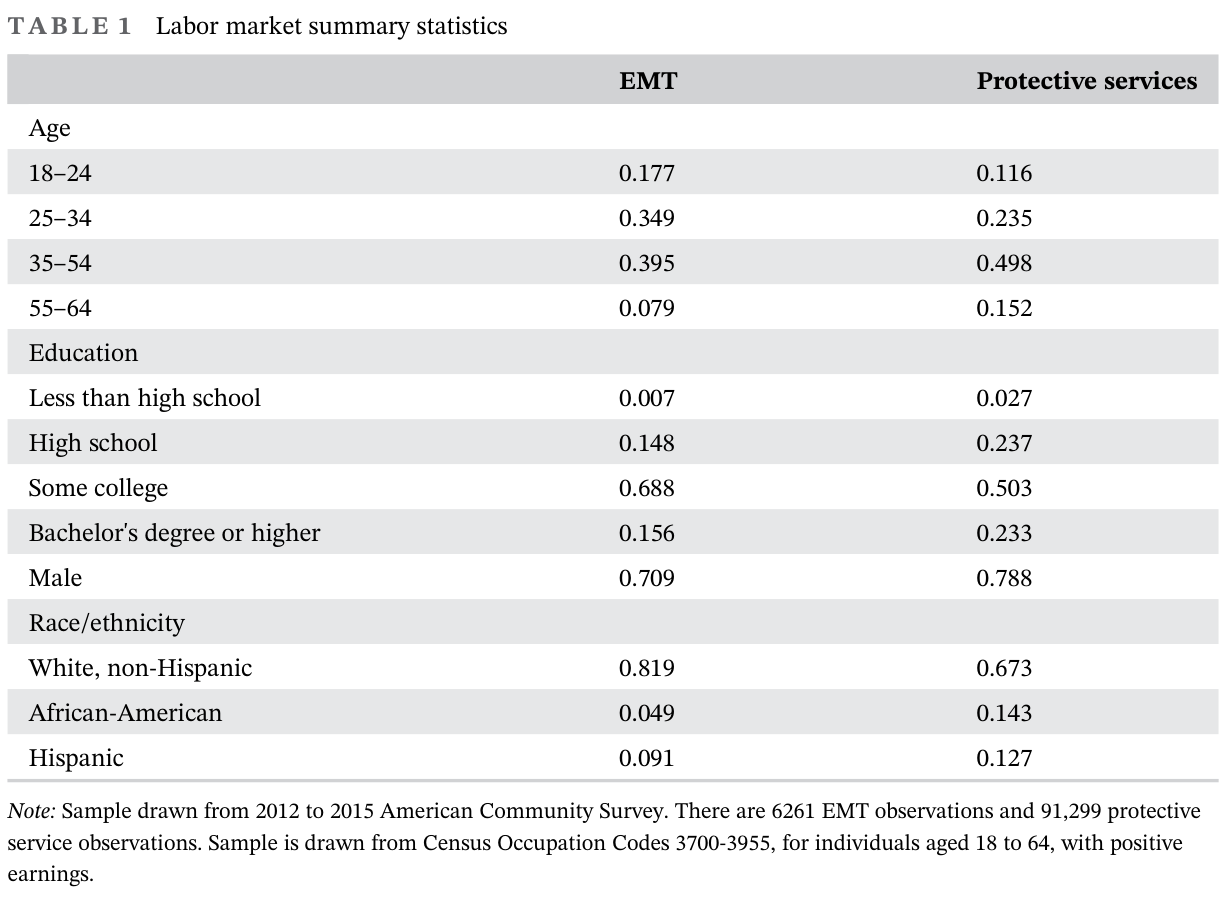
Our main sample consists of 19- to 64-year-olds who are employed either as EMTs or in other similar, nonmedical professions (where the ACA demand-side shocks should not be relevant). The labor market summary statistics from 2012 to 2015 are shown in Table 1. We focus on EMTs because of (a) readily available data on training days to obtain a license from the Institute for Justice, (b) the BLS describes the nature of the work as “physically strenuous and stressful”—similar to the protective services occupations included in the sample, and (c) the relatively lenient formal education requirements—high school diploma or equivalent and CPR certification—which potentially allows for large adjustments to a demand-side shock. Finally, Courtemanche et al. (2019) provide empirical evidence of strain
to emergency response systems with respect to ambulance response times, and EMTs are a critical labor component to such a system.

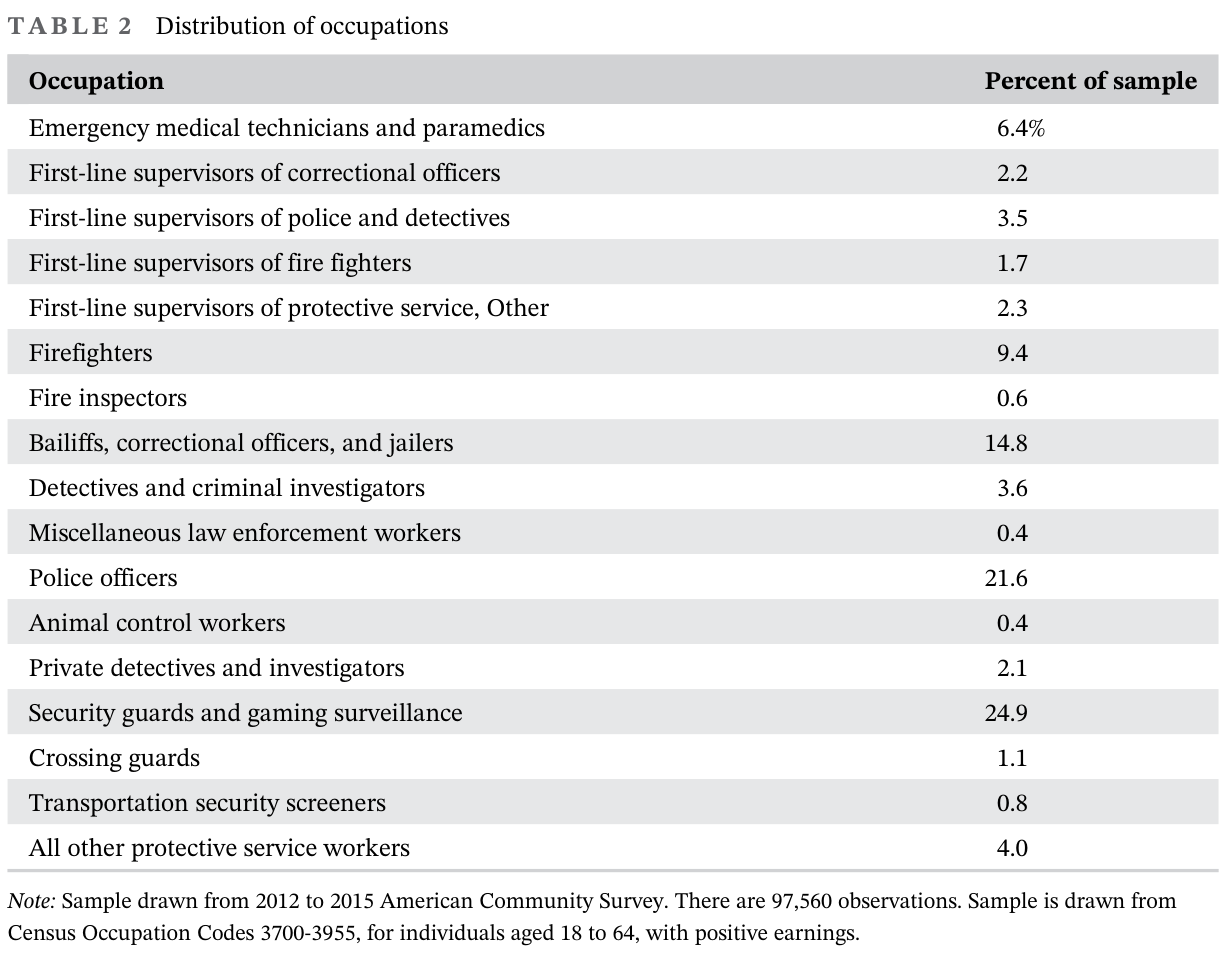
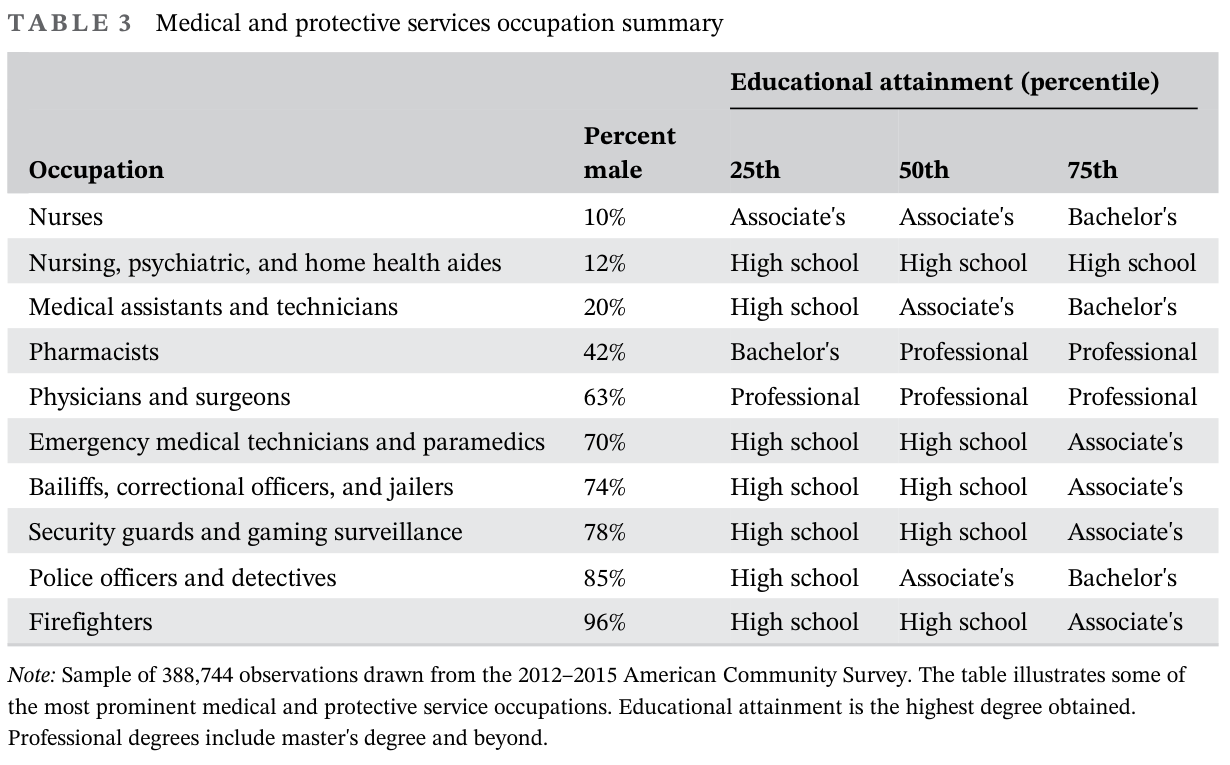
The BLS website provides similar occupations to that of “EMTs and Paramedics”; the nonmedical occupations include emergency management directors, firefighters, and police and detectives. The full list of detailed protective service occupations included in the sample are shown in Table 2. Similar to EMTs, the protective service occupations have a higher proportion of men and have less educational attainment than medical professions. Roughly 62% of the EMTs have only a high school degree and 82% have a high school or an associate degree. Other medical occupations—such as a registered nurse—often require many more years of formal education in addition to licensing requirements. Table 3 shows education attainment for the most frequent medical occupations and protective service occupations and the fraction of the
occupation that is male. EMTs closely resemble the other protective service occupations.
Given the lack of formal education requirements, EMTs and protective service occupations are quicker to join, resulting in a more flexible labor market. This implies that a young worker looking for a full time career and acceptable pay could quickly enter the profession. In addition, the protective service occupations should not be affected by the ACA like the medical professions and EMTs. The results section includes a placebo analysis for protective services occupations which confirms this reasoning.

### Table 1. Labor market summary statistics

<figure><a href="/files/publications/ay-ja-5i36oi7xhlxlv4el-assets/table-1.png"><img alt="Table 1: labor-market demographics of EMTs versus protective-service workers, covering age, education, sex and race/ethnicity, using the 2012–2015 ACS." height="900" loading="lazy" src="/files/publications/ay-ja-5i36oi7xhlxlv4el-assets/table-1.png" width="1230"/></a><figcaption>Table 1. <a href="/files/publications/ay-ja-5i36oi7xhlxlv4el-assets/table-1.png">Open full-resolution image</a>.</figcaption></figure>

### 3.2. Local demand-side shocks from the ACS
We restrict our ACS sample to those participating in calendar years 2011 to 2017. Motivated by the literature on insurance coverage gains, we expect that much of the demand-side shock from the ACA would occur in 2014 and 2015. Given the modest variation in up-front time investments to become an EMT in different states—between 23 and 81 days as shown in Figure 2—relative to lifetime hours in the profession, we expect that such barriers might be more important for short-run adjustment in occupational choice than long-run adjustment. Thus, we examine various windows around the 2014 ACA implementation: 2012–2015, 2011–2016, and 2011–2017. Concerns about confounding effects from the Great Recession— along with following the norms of other recent studies on the ACA—motivate starting our analysis in 2011 rather than previous
periods.
A critical variable for our identification strategy is the uninsured rate in the respondent's local labor market prior to ACA implementation. Due to new boundaries arising from the 2010 Census, the PUMA classification system changed during our sample period in a way that makes it impossible for us to simply use PUMAs as the local areas. The new 2010 Census boundaries generate 2,351 unique PUMAs, whereas the pre-2010 boundaries generated 2,071 unique PUMAs. These new boundaries are applicable to the 2012 ACS and beyond. For each PUMA, both before and after the 2010 boundary change, we associated it with the CBSA that had the largest share of population within the PUMA. More than 99% of PUMAs map into at least one CBSA. Approximately 80% of PUMAs, containing 79% of the population, map into precisely one CBSA. Nearly 11% of PUMAs map into two CBSAs, with the remaining 8.5% mapping into three to six CBSAs. We use both the old and new PUMA classification systems to identify corebased statistical areas (CBSAs), which we then use to define our local areas. If a CBSA spans multiple states, we exclude it in our analysis because in a conceptual model of occupational choice, we would be concerned about the endogeneity of work location within a metro area. To prevent respondents who do not live in a CBSA from being dropped, we create additional local areas for the non-CBSA portion of each state. In total, this process yields 519 local areas.

### Table 2. Distribution of occupations

<figure><a href="/files/publications/ay-ja-5i36oi7xhlxlv4el-assets/table-2.png"><img alt="Table 2: distribution of seventeen protective-service occupations in the sample; EMTs and paramedics account for 6.4%, police officers 21.6%, and security guards/gaming surveillance 24.9%." height="960" loading="lazy" src="/files/publications/ay-ja-5i36oi7xhlxlv4el-assets/table-2.png" width="1230"/></a><figcaption>Table 2. <a href="/files/publications/ay-ja-5i36oi7xhlxlv4el-assets/table-2.png">Open full-resolution image</a>.</figcaption></figure>

### Table 3. Medical and protective services occupation summary

<figure><a href="/files/publications/ay-ja-5i36oi7xhlxlv4el-assets/table-3.png"><img alt="Table 3: percent male and 25th, 50th and 75th percentiles of educational attainment for ten medical and protective-service occupations." height="765" loading="lazy" src="/files/publications/ay-ja-5i36oi7xhlxlv4el-assets/table-3.png" width="1230"/></a><figcaption>Table 3. <a href="/files/publications/ay-ja-5i36oi7xhlxlv4el-assets/table-3.png">Open full-resolution image</a>.</figcaption></figure>

The size of the demand-side shock from 2014 onward depends on two key factors: whether the state expanded Medicaid (in 2014 or 2015), and the uninsured rate in a CBSA prior to the ACA provisions. According to the Kaiser Family Foundation (KFF), a non-profit organization that collects a vast array of health policy information, and the Centers for Medicare and Medicaid Services (CMS), 27 states (including the District of Columbia) expanded Medicaid in 2014. One complication with defining which states should be considered “treated” by this expansion is that the ACA allowed states flexibility to expand Medicaid before 2014, and many did so to varying degrees. Specifically, nine of the 27 states that expanded Medicaid in 2014 did not have any previous or early Medicaid expansion under the
ACA, while 18 had some type of early expansion. Of the remaining 24 states that did not expand Medicaid in 2014, four states had some previous partial expansion (Kaestner et al., 2017). In addition, two of the states that expanded Medicaid in 2014 did not implement their expansion in January: Michigan's took effect in April 2014 and New Hampshire's in August 2014.

Our approach builds on a number of recent papers that examine various impacts of health reform (Courtemanche et al., 2017; Finkelstein, 2007; Miller, 2012). In each of those studies, there were abrupt expansions in insurance coverage—either from the ACA in 2014, Medicare implementation in 1966, or Massachusetts' reform in 2007—that had differential impact based on the local conditions, specifically the fraction of individuals who were uninsured prior to the reform. In our context, we call this <math xmlns="http://www.w3.org/1998/Math/MathML" display="inline"><mrow><mi>&#x00025;</mi><mi>B</mi><mi>I</mi><mi>T</mi><msub><mi>E</mi><mrow><mi>a</mi><mi>s</mi></mrow></msub></mrow></math>, which varies by local area a contained within state s. It represents the size of the demand-side shock—the percentage of local population who might be expected to gain coverage due to the ACA as a result of both initial local conditions and the state's choice to
adopt a Medicaid expansion. All else equal, in our setting with the ACA, states that expanded Medicaid had a much larger impact on insurance coverage (and utilization), because Medicaid covered individuals with incomes between 0% and 138% of the federal poverty line (FPL). In non-expansion (expansion) states, individuals with incomes above 100% (138%) of the FPL could qualify for private coverage from the federally facilitated marketplace, with sliding scale subsidies from the premium tax credit. Moreover, the effects on children under 19 and elderly individuals age 65 and older should be very small, because there were other routes for health insurance prior to the ACA. Thus, we expect smaller gains for nonelderly adults with incomes between 0% and 100% of the FPL in CBSAs that are located in
nonexpansion states. We parameterize the CBSA-level demand-side shock as follows:

**Equation (1):**

<math xmlns="http://www.w3.org/1998/Math/MathML" display="block"><mrow><mi>&#x00025;</mi><mi>B</mi><mi>I</mi><mi>T</mi><msub><mi>E</mi><mrow><mi>a</mi><mi>s</mi></mrow></msub><mo>&#x0003D;</mo><mrow><mo stretchy="true" fence="true" form="prefix">&#x0007B;</mo><mtable><mtr><mtd columnalign="left"><mstyle displaystyle="true" scriptlevel="0"><mfrac><mrow><mi>U</mi><mi>n</mi><mi>i</mi><mi>n</mi><mi>s</mi><mi>u</mi><mi>r</mi><mi>e</mi><msub><mi>d</mi><mrow><mi>a</mi><mi>s</mi><mo>&#x0002C;</mo><mn>100</mn><mi>&#x00025;</mi><mi>F</mi><mi>P</mi><mi>L</mi><mo>&#x0002B;</mo></mrow></msub></mrow><mrow><mi>A</mi><mi>d</mi><mi>u</mi><mi>l</mi><mi>t</mi><msub><mi>s</mi><mrow><mi>a</mi><mi>s</mi></mrow></msub></mrow></mfrac></mstyle><mo>&#x0002C;</mo></mtd><mtd columnalign="left"><mtext>if&#x000A0;state&#x000A0;</mtext><mi>s</mi><mtext>&#x000A0;did&#x000A0;not&#x000A0;expand&#x000A0;Medicaid&#x000A0;in&#x000A0;2014&#x000A0;or&#x000A0;2015</mtext><mo>&#x0002C;</mo></mtd></mtr><mtr><mtd columnalign="left"><mstyle displaystyle="true" scriptlevel="0"><mfrac><mrow><mi>U</mi><mi>n</mi><mi>i</mi><mi>n</mi><mi>s</mi><mi>u</mi><mi>r</mi><mi>e</mi><msub><mi>d</mi><mrow><mi>a</mi><mi>s</mi><mo>&#x0002C;</mo><mn>0</mn><mi>&#x00025;</mi><mi>F</mi><mi>P</mi><mi>L</mi><mo>&#x0002B;</mo></mrow></msub></mrow><mrow><mi>A</mi><mi>d</mi><mi>u</mi><mi>l</mi><mi>t</mi><msub><mi>s</mi><mrow><mi>a</mi><mi>s</mi></mrow></msub></mrow></mfrac></mstyle><mo>&#x0002C;</mo></mtd><mtd columnalign="left"><mtext>otherwise.</mtext></mtd></mtr></mtable></mrow></mrow></math>
For adults who lived in CBSA a in state s that expanded Medicaid, this term is simply the fraction of adults who are uninsured. In states that did not expand, the numerator is restricted to uninsured adults with incomes exceeding 100% of the FPL.

To compute CBSA estimates for the pre-treatment period, we use the 2008 to 2013 ACS, again focusing on non-elderly adults. Using algorithms from the State Health Access Data Assistance Center (SHADAC), we construct health insurance units (HIU) and estimates of the HIU income which is then converted into a multiple of the FPL.<sup><a href="#source-note-2" aria-label="Source note 2">2</a></sup> We then average across all years from 2008 to 2013. The ACA provided potentially large demand-side shocks in some localities and not others. Among all non-elderly adults, uninsured rates prior to the ACA ranged from under 9% in some localities in Massachusetts, Hawaii, Minnesota, and Vermont to over 35% in some localities in Florida, New Mexico, Georgia, and Texas. Some of the states with the highest rates of uninsured individuals prior to the
ACA (such as Texas) did not expand Medicaid, meaning that the largest “bite” from the ACA provisions occur in some localities in expansion states like New Mexico, California, Oregon, and Washington. Assuming full insurance take up among uninsured individuals, 55 CBSAs would have less than 10% of non-elderly adults gain coverage, while 58 CBSAs would have greater than 25% of adults gain coverage. The within-state variation across CBSA contributes to our identification strategy; 16 of the states have at least a 10 percentage point difference in the fraction of affected adults between CBSAs within the state.
### 3.3. EMT licensing costs
One measure of the onerousness of an occupational license is the time and effort required to obtain the license. The Institute for Justice (Carpenter et al., 2017) has collected data for ~100 low-earning occupations where licensing is burdensome. Licenses are compared based on the estimated calendar days lost to obtain a license through training and examinations, as well as the number of states that require licenses. All 50 states and DC require a license to become an EMT and the median days lost to obtain this license is 35 days. EMTs have a similar rank as dental assistants, taxi drivers, teaching assistants, and travel guides, in terms of onerousness.

The days required to get a license are illustrated in Figure 2. The least burdensome state is Missouri (23 days) and the most burdensome is Kansas (81 days). We use estimated days lost for each state as an index for the regulatory cost. For an aspiring EMT, the costs would also include lost wages, testing resources, tuition paid to an EMT school, fees, and the risk of not successfully becoming an EMT.

Each state has a particular set of EMT licensing requirements that can be opaque in nature. An aspiring EMT likely knows they are required to take the local EMT course, pay the associated tuition, and pass examinations to become an EMT. They would also know the class schedule and how long the coursework would take, prior to enrollment. The aspiring EMT guidebooks by Coughlin (2018) and Ruiz (2013) describe the physical nature of the job and include examination topics but do not go into state specific detail on requirements and exclusions from the profession. The Institute for Justice Data shows that 13 states explicitly require a High School Diploma or GED. Looking at the details from each states' licensing website provides additional requirements.

For example, neither Virginia nor Ohio explicitly lists a high school degree requirement although EMT classes may have this as a prerequisite.<sup><a href="#source-note-3" aria-label="Source note 3">3</a></sup> In Virginia the applicant has to be at least 16 years old, be able to complete the physical tasks required, and be “clean and neat in appearance.” Ohio additionally provides details excluding felons and some misdemeanor offenders, with a minimum age of 18.

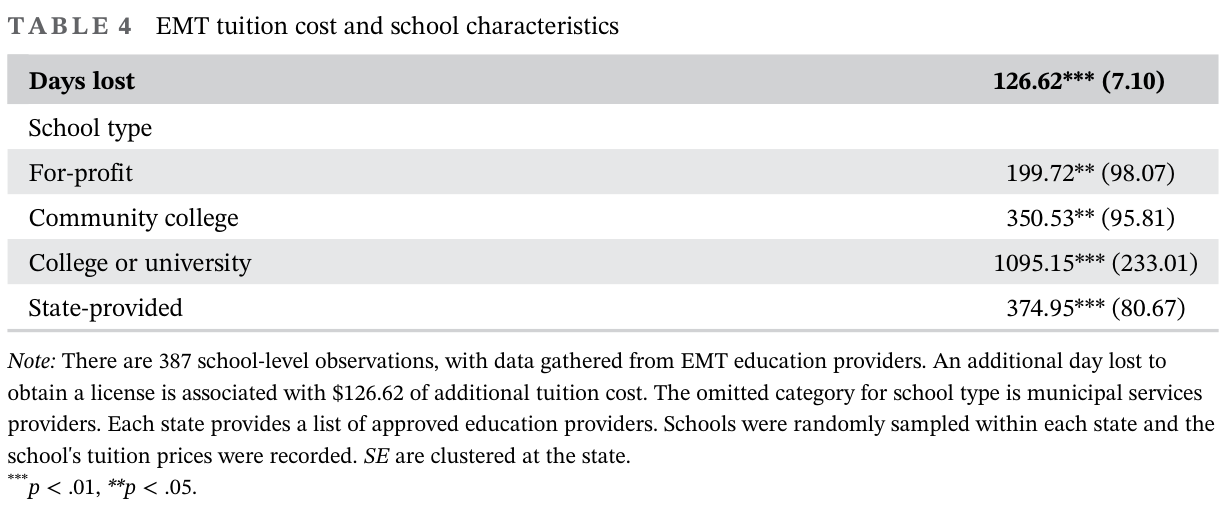
### Table 4. EMT tuition cost and school characteristics

<figure><a href="/files/publications/ay-ja-5i36oi7xhlxlv4el-assets/table-4.png"><img alt="Table 4: EMT tuition costs and school characteristics. Each additional licensing day is associated with $126.62 higher tuition, standard error $7.10; school-type coefficients and complete sample notes follow." height="513" loading="lazy" src="/files/publications/ay-ja-5i36oi7xhlxlv4el-assets/table-4.png" width="1230"/></a><figcaption>Table 4. <a href="/files/publications/ay-ja-5i36oi7xhlxlv4el-assets/table-4.png">Open full-resolution image</a>.</figcaption></figure>

Table 4 shows that the Carpenter et al. (2017) “days lost” measure also corresponds well with out-of-pocket costs. We gathered data on the tuition cost for EMTs for each state; ~380 schools were sampled across the country to calculate the expected cost an aspiring EMT would pay for tuition. Each state oversees and approves education providers and these schools include for-profit centers, community colleges, colleges and universities, municipal services (such as county emergency medical services), and state-provided classes. The median cost of an EMT education program is $1,295. The table shows a regression of the tuition cost on the days lost to obtain a license. In addition to other costs associated with days lost, an additional day lost is associated with an increase of $127
in tuition cost. A one SD increase in the days lost measure (11 days) corresponds to an additional $1,424 in tuition cost. This does not include other fees paid or other costs associated with licensing, but provides evidence that days lost is closely associated with the cost to get a license in the state.
## 4. EMPIRICAL MODEL
As recognized in Ingram and Yelowitz (forthcoming), much of the variation in occupational licensing arises from cross-sectional variation by state, with relatively few major changes over time. As a consequence, they search for a plausibly exogenous shock (in their case, within-CBSA house price appreciation) that should in turn lead to greater relative entry into the licensed profession (in their case, real estate agents). Such a shock interacts with the existing backdrop of cross-sectional variation in licensing requirements (in their case, total estimated costs of becoming a licensed real estate agent). The key prediction is that the interaction between occupational licensing and the demand-side shock should moderate entry into the licensed profession. In the same spirit as Courtemanche, et al., (2017), our
key estimating equation is a DDD model:
**Equation (2):**

<math xmlns="http://www.w3.org/1998/Math/MathML" display="block"><mrow><mi>E</mi><mi>M</mi><msub><mi>T</mi><mrow><mi>i</mi><mi>a</mi><mi>s</mi><mi>t</mi></mrow></msub><mo>&#x0003D;</mo><msub><mi>&#x003B2;</mi><mn>0</mn></msub><mo>&#x0002B;</mo><msub><mi>&#x003B2;</mi><mn>1</mn></msub><mi>B</mi><mi>I</mi><mi>T</mi><msub><mi>E</mi><mrow><mi>a</mi><mi>s</mi></mrow></msub><mo>&#x000B7;</mo><mi>P</mi><mi>o</mi><mi>s</mi><mi>t</mi><mi>A</mi><mi>C</mi><msub><mi>A</mi><mrow><mn>2014</mn></mrow></msub><mo>&#x0002B;</mo><msub><mi>&#x003B2;</mi><mn>2</mn></msub><mi>D</mi><mi>a</mi><mi>y</mi><mi>s</mi><mi>L</mi><mi>o</mi><mi>s</mi><msub><mi>t</mi><mi>s</mi></msub><mo>&#x000B7;</mo><mi>P</mi><mi>o</mi><mi>s</mi><mi>t</mi><mi>A</mi><mi>C</mi><msub><mi>A</mi><mrow><mn>2014</mn></mrow></msub><mo>&#x0002B;</mo><msub><mi>&#x003B2;</mi><mn>3</mn></msub><mi>D</mi><mi>a</mi><mi>y</mi><mi>s</mi><mi>L</mi><mi>o</mi><mi>s</mi><msub><mi>t</mi><mi>s</mi></msub><mo>&#x000B7;</mo><mi>B</mi><mi>I</mi><mi>T</mi><msub><mi>E</mi><mrow><mi>a</mi><mi>s</mi></mrow></msub><mo>&#x000B7;</mo><mi>P</mi><mi>o</mi><mi>s</mi><mi>t</mi><mi>A</mi><mi>C</mi><msub><mi>A</mi><mrow><mn>2014</mn></mrow></msub><mo>&#x0002B;</mo><msub><mi>&#x003B2;</mi><mn>4</mn></msub><msub><mi>X</mi><mrow><mi>i</mi><mi>t</mi></mrow></msub><mo>&#x0002B;</mo><msub><mi>&#x003B8;</mi><mi>t</mi></msub><mo>&#x0002B;</mo><msub><mi>&#x003B8;</mi><mrow><mi>a</mi><mi>s</mi></mrow></msub><mo>&#x0002B;</mo><msub><mi>&#x003B5;</mi><mrow><mi>i</mi><mi>a</mi><mi>s</mi><mi>t</mi></mrow></msub></mrow></math>

Equation (2) estimates the impact of the ACA and licensing regulation on the probability a worker is an EMT. The outcome <math xmlns="http://www.w3.org/1998/Math/MathML" display="inline"><mrow><mi>E</mi><mi>M</mi><msub><mi>T</mi><mrow><mi>i</mi><mi>a</mi><mi>s</mi><mi>t</mi></mrow></msub><mo>&#x0003D;</mo><mn>1</mn></mrow></math> if worker <math xmlns="http://www.w3.org/1998/Math/MathML" display="inline"><mrow><mi>i</mi></mrow></math>, in area <math xmlns="http://www.w3.org/1998/Math/MathML" display="inline"><mrow><mi>a</mi></mrow></math>, in state <math xmlns="http://www.w3.org/1998/Math/MathML" display="inline"><mrow><mi>s</mi></mrow></math>, in time <math xmlns="http://www.w3.org/1998/Math/MathML" display="inline"><mrow><mi>t</mi></mrow></math>, is an EMT and 0 if they choose another protective services profession. The interaction <math xmlns="http://www.w3.org/1998/Math/MathML" display="inline"><mrow><mi>B</mi><mi>I</mi><mi>T</mi><msub><mi>E</mi><mrow><mi>a</mi><mi>s</mi></mrow></msub><mo>&#x000D7;</mo><mi>P</mi><mi>o</mi><mi>s</mi><mi>t</mi><mi>A</mi><mi>C</mi><msub><mi>A</mi><mrow><mn>2014</mn></mrow></msub></mrow></math> represents the demand-side shock of the implementation of the ACA and depends on whether the state expanded Medicaid as reflected in Equation (1). The indicator <math xmlns="http://www.w3.org/1998/Math/MathML" display="inline"><mrow><mi>P</mi><mi>o</mi><mi>s</mi><mi>t</mi><mi>A</mi><mi>C</mi><msub><mi>A</mi><mrow><mn>2014</mn></mrow></msub><mo>&#x0003D;</mo><mn>1</mn></mrow></math> if the year is greater than or equal to 2014. The continuous variable <math xmlns="http://www.w3.org/1998/Math/MathML" display="inline"><mrow><mi>B</mi><mi>I</mi><mi>T</mi><msub><mi>E</mi><mrow><mi>a</mi><mi>s</mi></mrow></msub></mrow></math> depends on the state's adoption of the Medicaid expansion and the uninsured rate prior to 2013, as described previously. The continuous variable <math xmlns="http://www.w3.org/1998/Math/MathML" display="inline"><mrow><mi>D</mi><mi>a</mi><mi>y</mi><mi>s</mi><mi>L</mi><mi>o</mi><mi>s</mi><msub><mi>t</mi><mi>s</mi></msub></mrow></math> is the estimated days lost for a worker to obtain a license, as illustrated in Figure 2. Individual characteristics <math xmlns="http://www.w3.org/1998/Math/MathML" display="inline"><mrow><msub><mi>X</mi><mrow><mi>i</mi><mi>t</mi></mrow></msub></mrow></math> include age, education, sex, race, and ethnicity. Models either include year (<math xmlns="http://www.w3.org/1998/Math/MathML" display="inline"><mrow><msub><mi>&#x003B8;</mi><mi>t</mi></msub></mrow></math>) and CBSA fixed effects (<math xmlns="http://www.w3.org/1998/Math/MathML" display="inline"><mrow><msub><mi>&#x003B8;</mi><mrow><mi>a</mi><mi>s</mi></mrow></msub></mrow></math>), or State×Year and CBSA fixed effects (in which case the year effects are subsumed). Furthermore, in models with State×Year fixed effects, the coefficient <math xmlns="http://www.w3.org/1998/Math/MathML" display="inline"><mrow><msub><mi>&#x003B2;</mi><mn>2</mn></msub></mrow></math> cannot be separately estimated since the variation is at the state-year level. Standard errors are heteroscedasticity-robust and clustered by state, and individual sample weights are used in all specifications.

In addition, to explore some of the underlying assumptions of the DDD model, we estimate an event-study specification that includes interactions of the treatment variables with a full set of year effects, with 2013 being the base year. The model (with all years) takes the following form:
**Equation (3):**

<math xmlns="http://www.w3.org/1998/Math/MathML" display="block"><mtable columnalign="right left" columnspacing="0.15em" rowspacing="0.35em"><mtr><mtd><mrow><mi>E</mi><mi>M</mi><msub><mi>T</mi><mrow><mi>i</mi><mi>a</mi><mi>s</mi><mi>t</mi></mrow></msub></mrow></mtd><mtd><mrow><mo>=</mo><msub><mi>γ</mi><mn>0</mn></msub><mo>+</mo><msub><mi>γ</mi><mn>1</mn></msub><mi>B</mi><mi>I</mi><mi>T</mi><msub><mi>E</mi><mrow><mi>a</mi><mi>s</mi></mrow></msub><mo>·</mo><mi>Y</mi><msub><mn>2011</mn><mi>t</mi></msub><mo>+</mo><msub><mi>γ</mi><mn>2</mn></msub><mi>B</mi><mi>I</mi><mi>T</mi><msub><mi>E</mi><mrow><mi>a</mi><mi>s</mi></mrow></msub><mo>·</mo><mi>Y</mi><msub><mn>2012</mn><mi>t</mi></msub><mo>+</mo><msub><mi>γ</mi><mn>3</mn></msub><mi>B</mi><mi>I</mi><mi>T</mi><msub><mi>E</mi><mrow><mi>a</mi><mi>s</mi></mrow></msub><mo>·</mo><mi>Y</mi><msub><mn>2014</mn><mi>t</mi></msub><mo>+</mo><msub><mi>γ</mi><mn>4</mn></msub><mi>B</mi><mi>I</mi><mi>T</mi><msub><mi>E</mi><mrow><mi>a</mi><mi>s</mi></mrow></msub><mo>·</mo><mi>Y</mi><msub><mn>2015</mn><mi>t</mi></msub></mrow></mtd></mtr><mtr><mtd /><mtd><mrow><mo>+</mo><msub><mi>γ</mi><mn>5</mn></msub><mi>B</mi><mi>I</mi><mi>T</mi><msub><mi>E</mi><mrow><mi>a</mi><mi>s</mi></mrow></msub><mo>·</mo><mi>Y</mi><msub><mn>2016</mn><mi>t</mi></msub><mo>+</mo><msub><mi>γ</mi><mn>6</mn></msub><mi>B</mi><mi>I</mi><mi>T</mi><msub><mi>E</mi><mrow><mi>a</mi><mi>s</mi></mrow></msub><mo>·</mo><mi>Y</mi><msub><mn>2017</mn><mi>t</mi></msub><mo>+</mo><msub><mi>γ</mi><mn>7</mn></msub><mi>D</mi><mi>a</mi><mi>y</mi><mi>s</mi><mi>L</mi><mi>o</mi><mi>s</mi><msub><mi>t</mi><mi>s</mi></msub><mo>·</mo><mi>Y</mi><msub><mn>2011</mn><mi>t</mi></msub></mrow></mtd></mtr><mtr><mtd /><mtd><mrow><mo>+</mo><msub><mi>γ</mi><mn>8</mn></msub><mi>D</mi><mi>a</mi><mi>y</mi><mi>s</mi><mi>L</mi><mi>o</mi><mi>s</mi><msub><mi>t</mi><mi>s</mi></msub><mo>·</mo><mi>Y</mi><msub><mn>2012</mn><mi>t</mi></msub><mo>+</mo><msub><mi>γ</mi><mn>9</mn></msub><mi>D</mi><mi>a</mi><mi>y</mi><mi>s</mi><mi>L</mi><mi>o</mi><mi>s</mi><msub><mi>t</mi><mi>s</mi></msub><mo>·</mo><mi>Y</mi><msub><mn>2014</mn><mi>t</mi></msub><mo>+</mo><msub><mi>γ</mi><mrow><mn>10</mn></mrow></msub><mi>D</mi><mi>a</mi><mi>y</mi><mi>s</mi><mi>L</mi><mi>o</mi><mi>s</mi><msub><mi>t</mi><mi>s</mi></msub><mo>·</mo><mi>Y</mi><msub><mn>2015</mn><mi>t</mi></msub></mrow></mtd></mtr><mtr><mtd /><mtd><mrow><mo>+</mo><msub><mi>γ</mi><mrow><mn>11</mn></mrow></msub><mi>D</mi><mi>a</mi><mi>y</mi><mi>s</mi><mi>L</mi><mi>o</mi><mi>s</mi><msub><mi>t</mi><mi>s</mi></msub><mo>·</mo><mi>Y</mi><msub><mn>2016</mn><mi>t</mi></msub><mo>+</mo><msub><mi>γ</mi><mrow><mn>12</mn></mrow></msub><mi>D</mi><mi>a</mi><mi>y</mi><mi>s</mi><mi>L</mi><mi>o</mi><mi>s</mi><msub><mi>t</mi><mi>s</mi></msub><mo>·</mo><mi>Y</mi><msub><mn>2017</mn><mi>t</mi></msub><mo>+</mo><msub><mi>γ</mi><mrow><mn>13</mn></mrow></msub><mi>D</mi><mi>a</mi><mi>y</mi><mi>s</mi><mi>L</mi><mi>o</mi><mi>s</mi><msub><mi>t</mi><mi>s</mi></msub><mo>·</mo><mi>B</mi><mi>I</mi><mi>T</mi><msub><mi>E</mi><mrow><mi>a</mi><mi>s</mi></mrow></msub><mo>·</mo><mi>Y</mi><msub><mn>2011</mn><mi>t</mi></msub></mrow></mtd></mtr><mtr><mtd /><mtd><mrow><mo>+</mo><msub><mi>γ</mi><mrow><mn>14</mn></mrow></msub><mi>D</mi><mi>a</mi><mi>y</mi><mi>s</mi><mi>L</mi><mi>o</mi><mi>s</mi><msub><mi>t</mi><mi>s</mi></msub><mo>·</mo><mi>B</mi><mi>I</mi><mi>T</mi><msub><mi>E</mi><mrow><mi>a</mi><mi>s</mi></mrow></msub><mo>·</mo><mi>Y</mi><msub><mn>2012</mn><mi>t</mi></msub><mo>+</mo><msub><mi>γ</mi><mrow><mn>15</mn></mrow></msub><mi>D</mi><mi>a</mi><mi>y</mi><mi>s</mi><mi>L</mi><mi>o</mi><mi>s</mi><msub><mi>t</mi><mi>s</mi></msub><mo>·</mo><mi>B</mi><mi>I</mi><mi>T</mi><msub><mi>E</mi><mrow><mi>a</mi><mi>s</mi></mrow></msub><mo>·</mo><mi>Y</mi><msub><mn>2014</mn><mi>t</mi></msub></mrow></mtd></mtr><mtr><mtd /><mtd><mrow><mo>+</mo><msub><mi>γ</mi><mrow><mn>16</mn></mrow></msub><mi>D</mi><mi>a</mi><mi>y</mi><mi>s</mi><mi>L</mi><mi>o</mi><mi>s</mi><msub><mi>t</mi><mi>s</mi></msub><mo>·</mo><mi>B</mi><mi>I</mi><mi>T</mi><msub><mi>E</mi><mrow><mi>a</mi><mi>s</mi></mrow></msub><mo>·</mo><mi>Y</mi><msub><mn>2015</mn><mi>t</mi></msub><mo>+</mo><msub><mi>γ</mi><mrow><mn>17</mn></mrow></msub><mi>D</mi><mi>a</mi><mi>y</mi><mi>s</mi><mi>L</mi><mi>o</mi><mi>s</mi><msub><mi>t</mi><mi>s</mi></msub><mo>·</mo><mi>B</mi><mi>I</mi><mi>T</mi><msub><mi>E</mi><mrow><mi>a</mi><mi>s</mi></mrow></msub><mo>·</mo><mi>Y</mi><msub><mn>2016</mn><mi>t</mi></msub></mrow></mtd></mtr><mtr><mtd /><mtd><mrow><mo>+</mo><msub><mi>γ</mi><mrow><mn>18</mn></mrow></msub><mi>D</mi><mi>a</mi><mi>y</mi><mi>s</mi><mi>L</mi><mi>o</mi><mi>s</mi><msub><mi>t</mi><mi>s</mi></msub><mo>·</mo><mi>B</mi><mi>I</mi><mi>T</mi><msub><mi>E</mi><mrow><mi>a</mi><mi>s</mi></mrow></msub><mo>·</mo><mi>Y</mi><msub><mn>2017</mn><mi>t</mi></msub><mo>+</mo><msub><mi>γ</mi><mrow><mn>19</mn></mrow></msub><msub><mi>X</mi><mrow><mi>i</mi><mi>t</mi></mrow></msub><mo>+</mo><msub><mi>θ</mi><mi>t</mi></msub><mo>+</mo><msub><mi>θ</mi><mrow><mi>a</mi><mi>s</mi></mrow></msub><mo>+</mo><msub><mi>ε</mi><mrow><mi>i</mi><mi>a</mi><mi>s</mi><mi>t</mi></mrow></msub></mrow></mtd></mtr></mtable></math>
where <math xmlns="http://www.w3.org/1998/Math/MathML" display="inline"><mrow><mi>Y</mi><msub><mn>2011</mn><mi>t</mi></msub></mrow></math> through <math xmlns="http://www.w3.org/1998/Math/MathML" display="inline"><mrow><mi>Y</mi><msub><mn>2017</mn><mi>t</mi></msub></mrow></math> are indicators for whether year <math xmlns="http://www.w3.org/1998/Math/MathML" display="inline"><mrow><mi>t</mi></mrow></math> is 2011 through 2017, respectively. The tests for differential pretreatment trends (i.e., falsification tests) are provided by evaluating whether the coefficients on the treatment variables in the pretreatment years (<math xmlns="http://www.w3.org/1998/Math/MathML" display="inline"><mrow><msub><mi>&#x003B3;</mi><mn>1</mn></msub></mrow></math>, <math xmlns="http://www.w3.org/1998/Math/MathML" display="inline"><mrow><msub><mi>&#x003B3;</mi><mn>2</mn></msub></mrow></math>, <math xmlns="http://www.w3.org/1998/Math/MathML" display="inline"><mrow><msub><mi>&#x003B3;</mi><mn>7</mn></msub></mrow></math>, <math xmlns="http://www.w3.org/1998/Math/MathML" display="inline"><mrow><msub><mi>&#x003B3;</mi><mn>8</mn></msub></mrow></math>, <math xmlns="http://www.w3.org/1998/Math/MathML" display="inline"><mrow><msub><mi>&#x003B3;</mi><mrow><mn>13</mn></mrow></msub></mrow></math>, and <math xmlns="http://www.w3.org/1998/Math/MathML" display="inline"><mrow><msub><mi>&#x003B3;</mi><mrow><mn>14</mn></mrow></msub></mrow></math>) are equal to zero. Another advantage of the event study specification is that it allows us to distinguish between the effects of the ACA in 2014 and later years; given the relatively small barriers to entry, it is possible that any demand-side shocks are transitory.

## 5. RESULTS
### 5.1. Main results
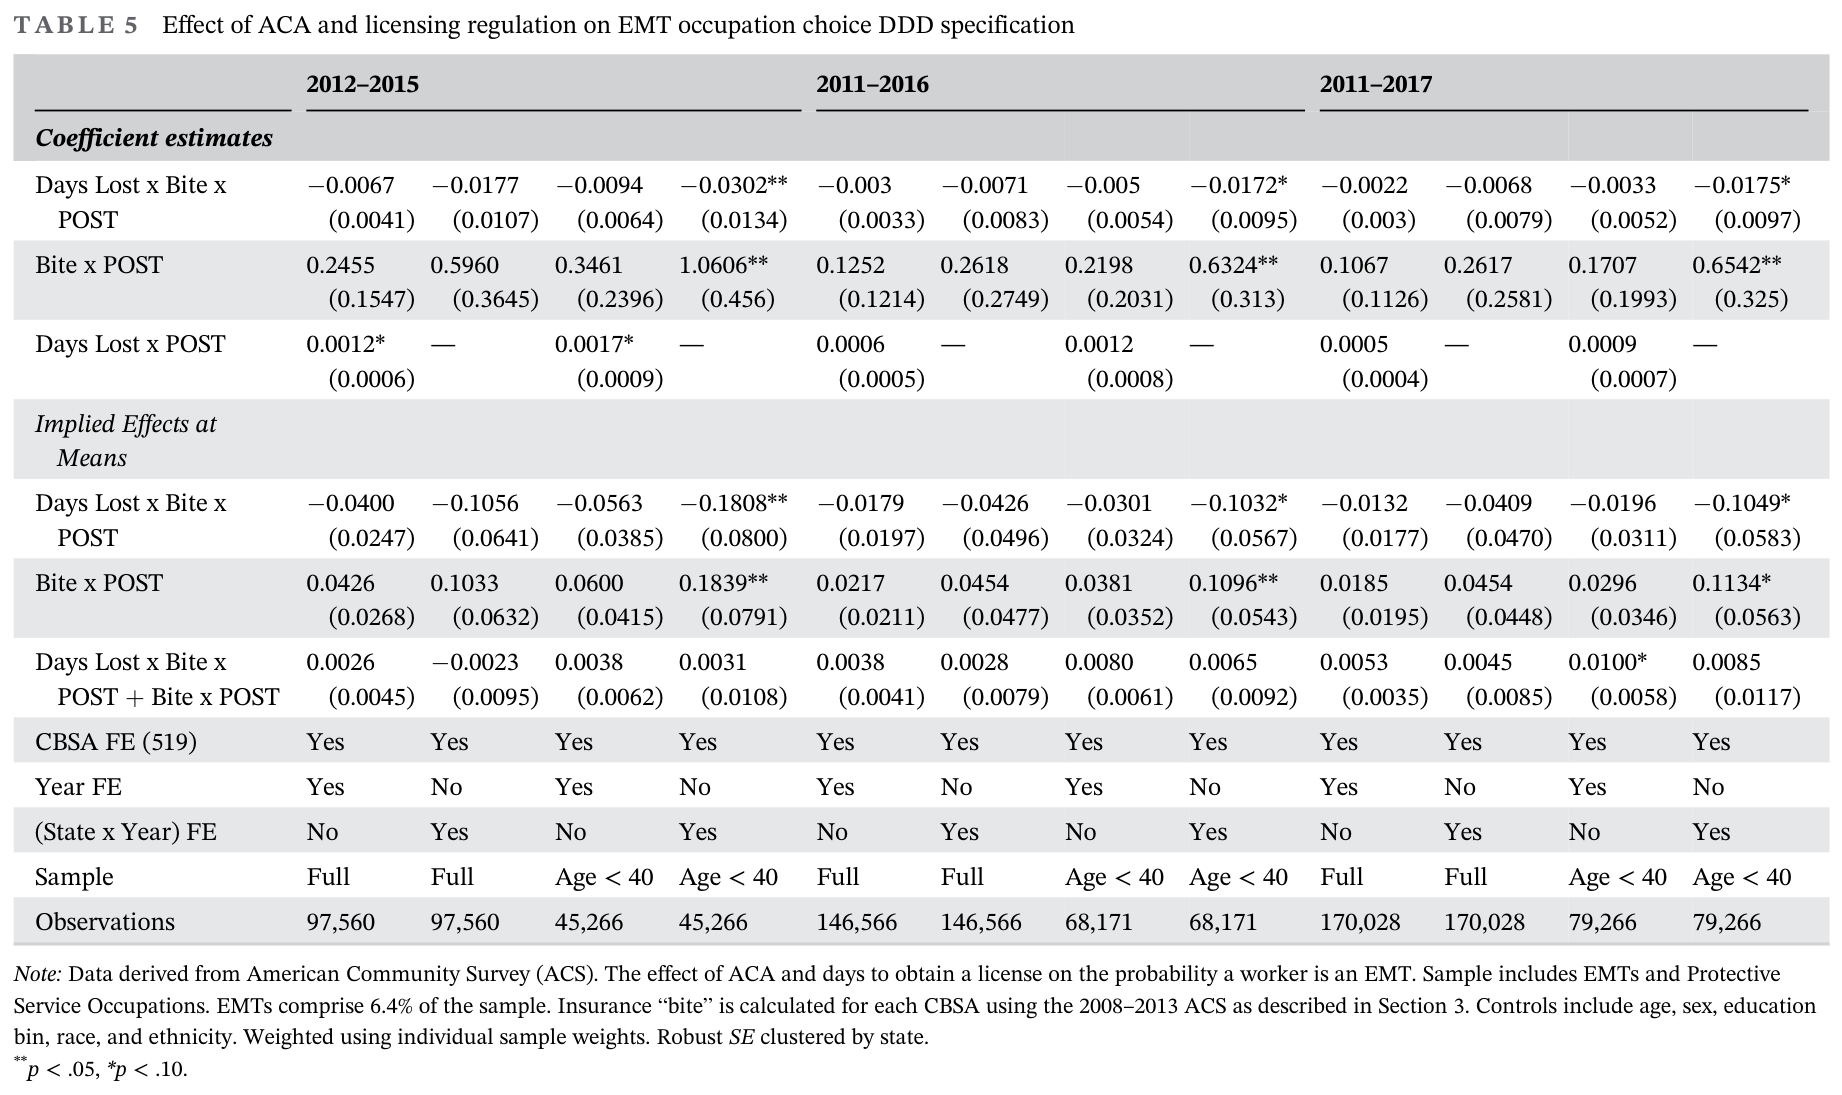
Table 5 shows estimates of key coefficients from several variants of the DDD model presented in Equation (2). The first four columns show findings from a narrow window —2012 to 2015 for the full sample as well as younger adults both (with and without State\*Year fixed effects) — while the final columns show wider windows from 2011 to 2016 and from 2011 to 2017. When including all ages and all years, the sample size exceeds 170,000 individuals, while the sample size for younger individuals is nearly 80,000. We present coefficient estimates on <math xmlns="http://www.w3.org/1998/Math/MathML" display="inline"><mrow><msub><mi>&#x003B2;</mi><mn>1</mn></msub></mrow></math>, <math xmlns="http://www.w3.org/1998/Math/MathML" display="inline"><mrow><msub><mi>&#x003B2;</mi><mn>2</mn></msub></mrow></math> (when applicable without State\*Year fixed effects), and <math xmlns="http://www.w3.org/1998/Math/MathML" display="inline"><mrow><msub><mi>&#x003B2;</mi><mn>3</mn></msub></mrow></math>. The top panel shows the coefficient estimates, while the bottom panel evaluates the implied effects at the average uninsured rate and days lost for the sample.<sup><a href="#source-note-4" aria-label="Source note 4">4</a></sup> For the narrow sample from 2012 to 2015, all coefficient estimates are suggestive of both entry effects from the ACA and moderating effects from licensing regulations. For all ages, the coefficient estimate on the demand-side shock, <math xmlns="http://www.w3.org/1998/Math/MathML" display="inline"><mrow><mi>B</mi><mi>I</mi><mi>T</mi><msub><mi>E</mi><mrow><mi>a</mi><mi>s</mi></mrow></msub></mrow></math> <math xmlns="http://www.w3.org/1998/Math/MathML" display="inline"><mrow><mi>P</mi><mi>o</mi><mi>s</mi><mi>t</mi><mi>A</mi><mi>C</mi><msub><mi>A</mi><mrow><mn>2014</mn></mrow></msub></mrow></math>, is 0.2455 ( p = .119), while the coefficient estimate on the moderating effect of licensing, <math xmlns="http://www.w3.org/1998/Math/MathML" display="inline"><mrow><mi>D</mi><mi>a</mi><mi>y</mi><mi>s</mi><mi>L</mi><mi>o</mi><mi>s</mi><msub><mi>t</mi><mi>s</mi></msub></mrow></math> <math xmlns="http://www.w3.org/1998/Math/MathML" display="inline"><mrow><mi>B</mi><mi>I</mi><mi>T</mi><msub><mi>E</mi><mrow><mi>a</mi><mi>s</mi></mrow></msub></mrow></math> <math xmlns="http://www.w3.org/1998/Math/MathML" display="inline"><mrow><mi>P</mi><mi>o</mi><mi>s</mi><mi>t</mi><mi>A</mi><mi>C</mi><msub><mi>A</mi><mrow><mn>2014</mn></mrow></msub></mrow></math> is - 0.0067 (p = .112). The implied effect, evaluated at a pretreatment uninsured rate of 17.3% and average days loss of 34.5 days leads to approximately a 4.3 percentage point supply-side increase in EMTs from the demand-side shock, and a 4.0 percentage point reduction from the occupational licensing restrictions. Taken together, the total effects results in virtually no change in the relative choice to be an EMT. For the full sample, the 95% confidence interval rules out effect sizes outside - 0.7 to 1.1 percentage points. The second and fourth columns include State\*Year effects and estimate the model on the full sample as well as younger individuals. For the full sample, the implied effects are again marginally significant but larger in absolute terms—where the ACA demand-side shock leads to a 10.3 percentage point supply-side increase (p = .109), which is completely offset by the 10.6 percentage point ( p = .106) moderating effect from the occupational licensing regulations.

### Table 5. Effect of ACA and licensing regulation on EMT occupation choice DDD specification

<figure><a href="/files/publications/ay-ja-5i36oi7xhlxlv4el-assets/table-5.png"><img alt="Table 5: triple-difference estimates of ACA and licensing effects on EMT occupation choice across three sample periods, with coefficient estimates, implied effects, fixed effects and observation counts." height="1095" loading="lazy" src="/files/publications/ay-ja-5i36oi7xhlxlv4el-assets/table-5.png" width="1842"/></a><figcaption>Table 5. <a href="/files/publications/ay-ja-5i36oi7xhlxlv4el-assets/table-5.png">Open full-resolution image</a>.</figcaption></figure>

The second and fourth columns address the concern that choice of occupation with respect to a demand-side shock may be sensitive to the life cycle; one might expect younger individuals to be more responsive to new opportunities or barriers to entry in a career choice. For the younger sample —in a model that includes State\*Year fixed effects in the fourth column, both the demand-side shock and the moderating effect of occupational licensing laws are significant.

The coefficient estimate from the demand-side shock 1.0606 ( p = .024), when evaluated at the pre-treatment uninsured rate, yields an 18.4 percentage point increase in the likelihood of choosing to become an EMT relative to other protective services occupations. However, the coefficient on the moderating effect from licensing - 0.0302 ( p = .028), when evaluated at the mean uninsured rate and days lost, yields an 18.1 percentage point reduction. As a consequence, much like the full sample, the overall impact on entry into the EMT occupation is virtually zero. For the younger sample, the 95% confidence interval on the net effect rules out effect sizes exceeding - 1.9 to 2.4 percentage points. Thus, the net effect masks two sizable effects going in opposite directions.

The final sets of columns expand the sample to a longer time frame (either 2011 –2016 or 2011–2017). Although the overall findings remain similar to the narrower window, the results and statistical significance are somewhat weaker than before. For example, for younger individuals in the most carefully controlled specifications, the demand side shock significantly increases entry by ~11 percentage points (rather than 18 percentage points), but this entry effect is completely offset by higher barriers to entry from occupational licensing (~10 percentage points). One possible interpretation is that the demand-side shock —large insurance gains in 2014 and 2015 —led to immediate adjustment in the EMT market (both the direct supply-side adjustment and the moderating effects), but over longer windows the impacts of those short-run demand-side shocks diminish.

### 5.2. Sensitivity checks
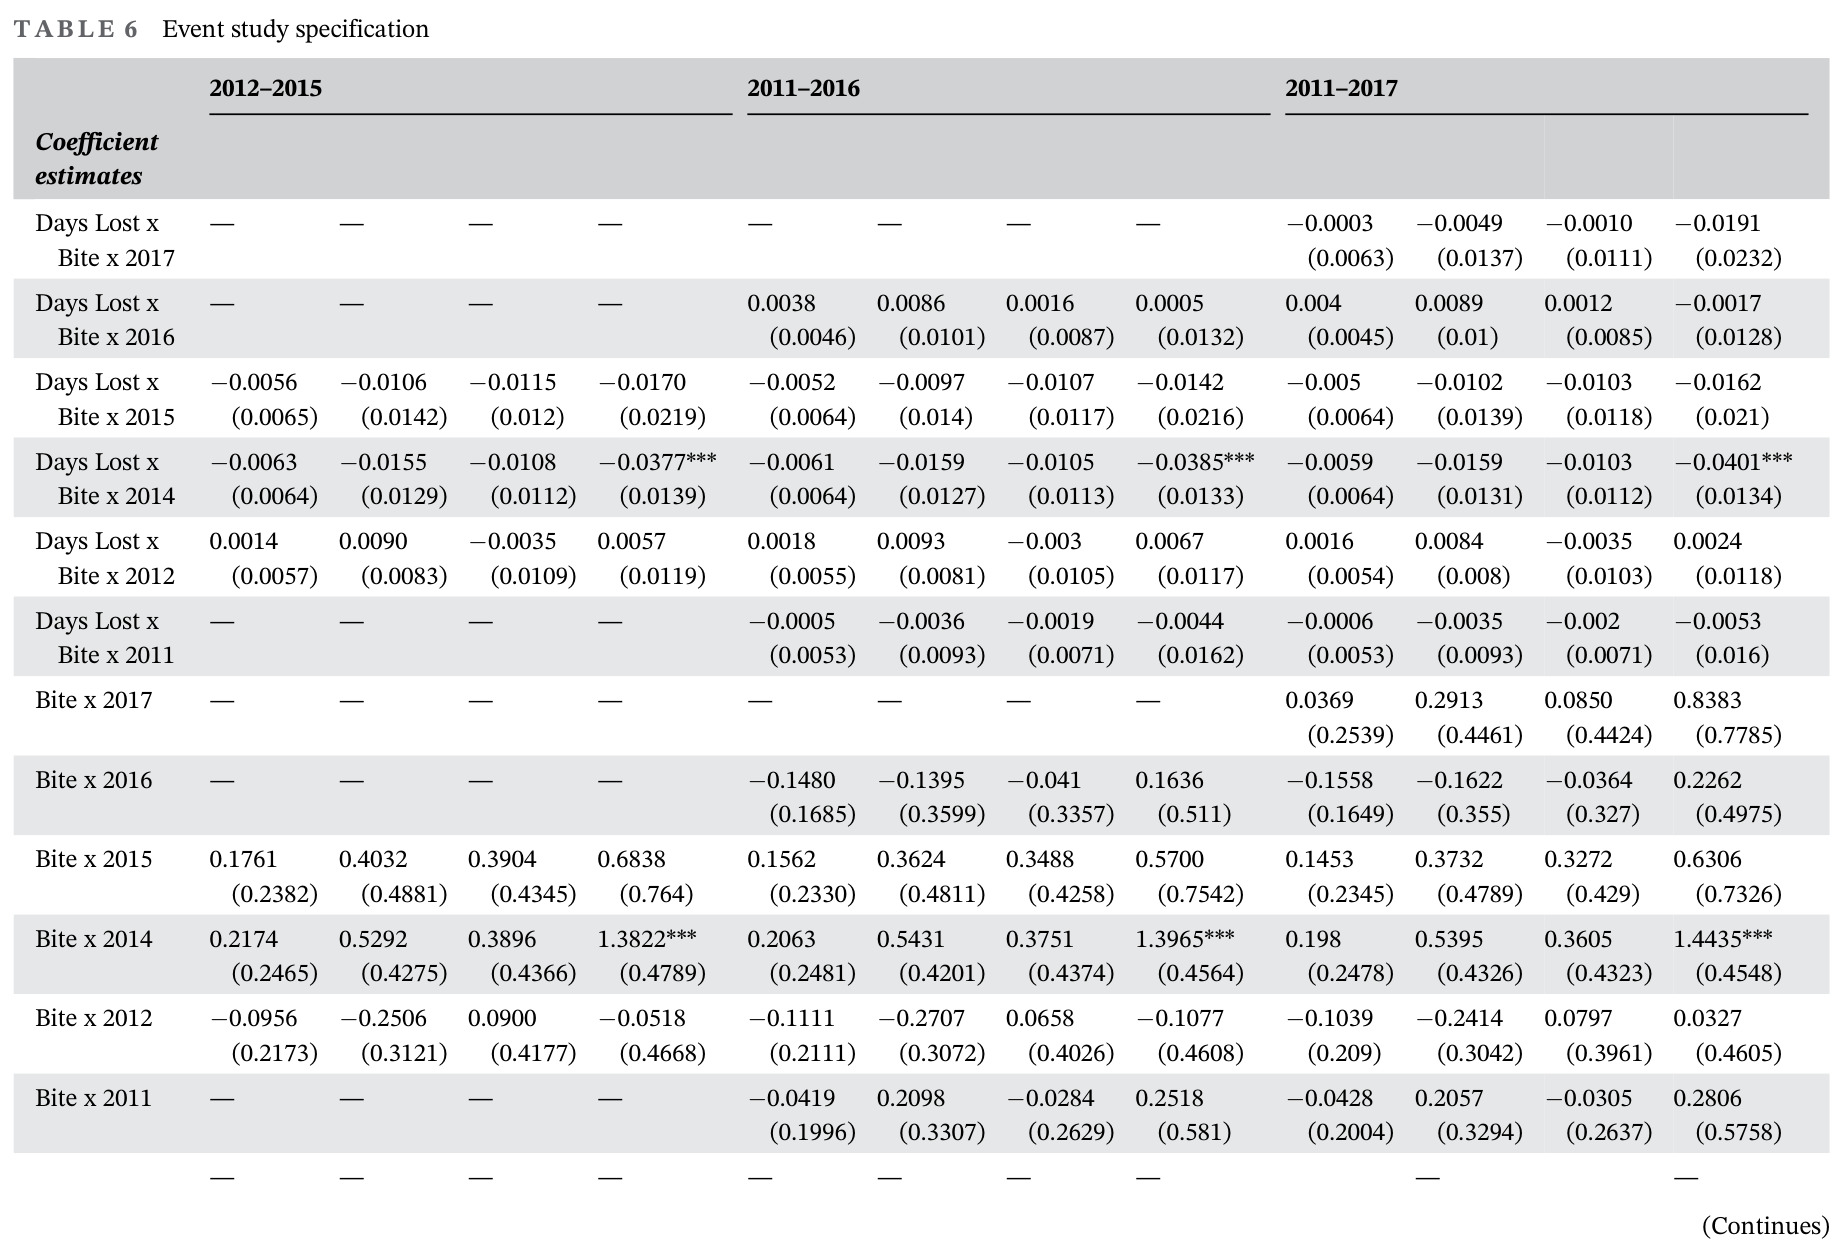
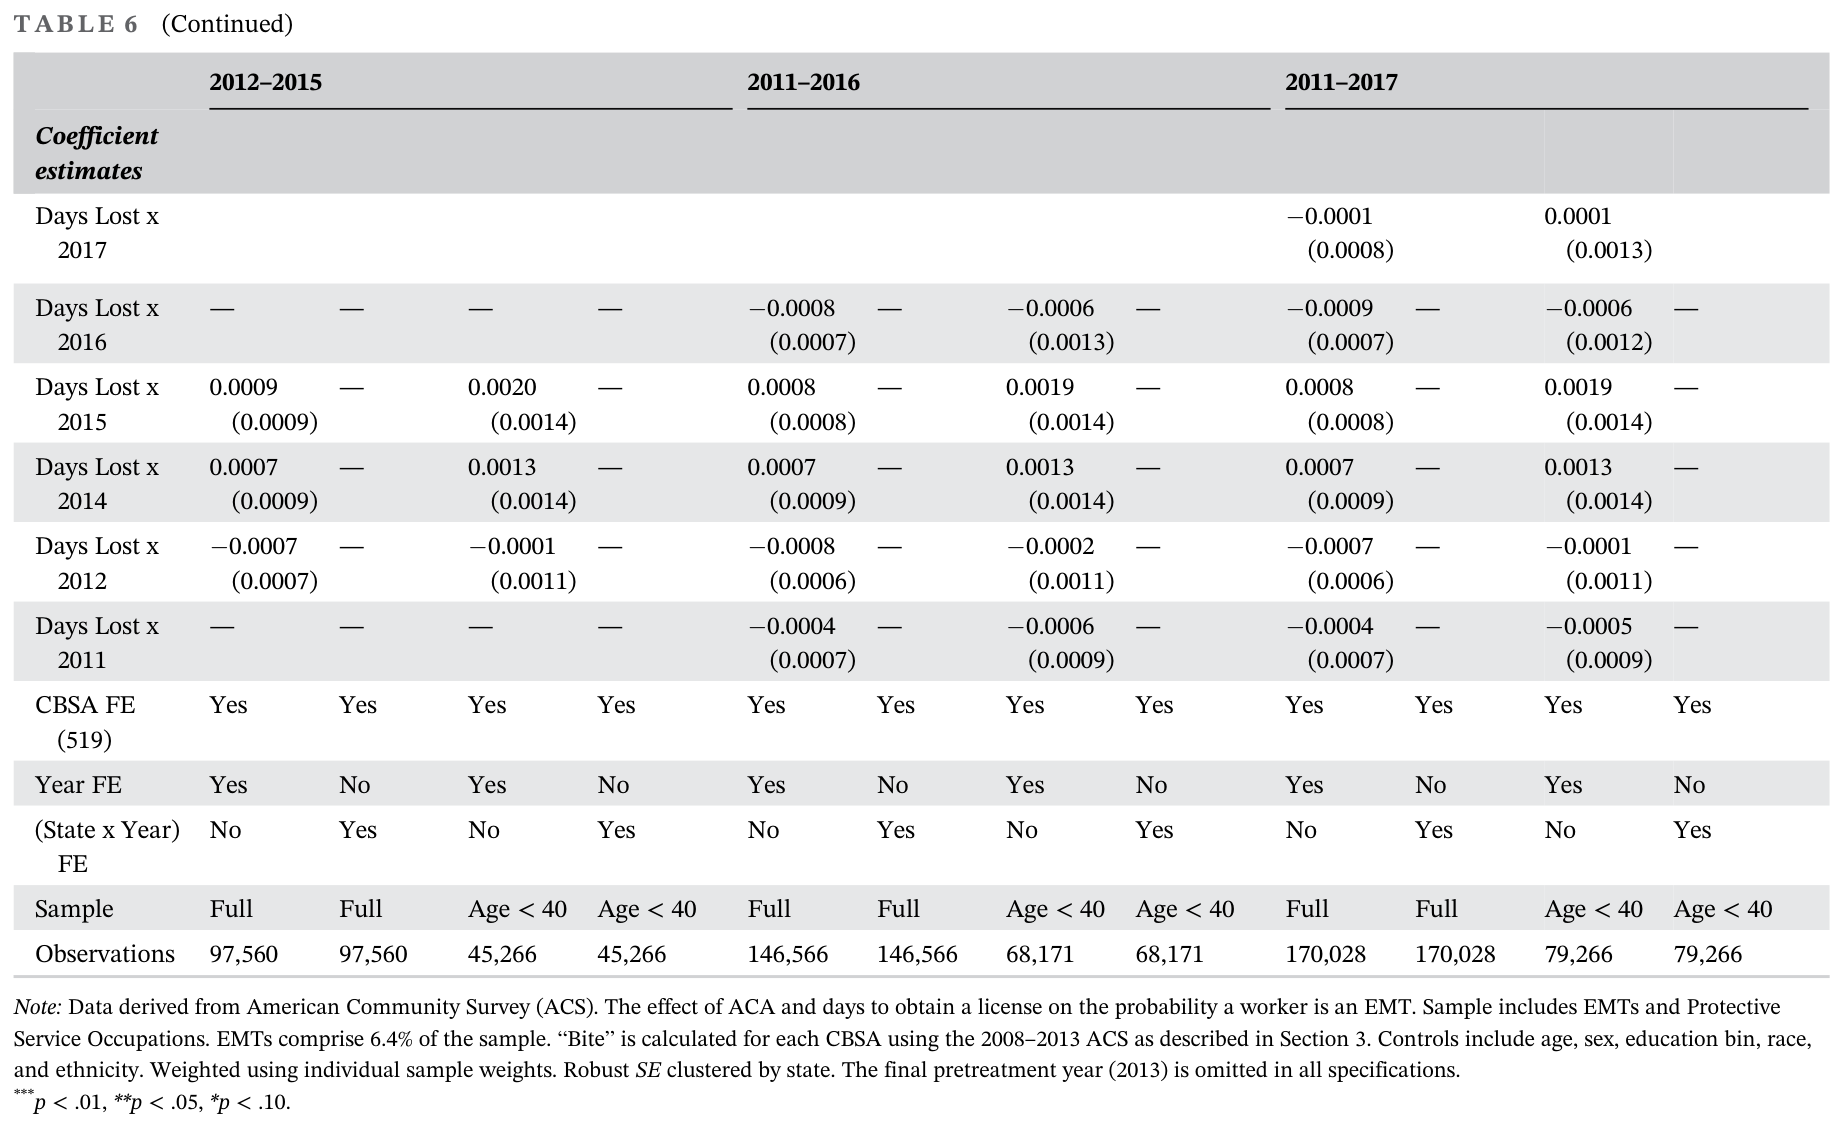
We explore the sensitivity of the results in a variety of ways. First, Table 6 presents the event-study specification for the same samples, using the estimation framework in Equation (3). One key concern in any DDD framework (e.g., Courtemanche et al., 2017) is that there are pre-trends in the treatment variables. In the table, across 12 regression specifications there are a total of 50 falsification tests (involving the interactions with the years 2011 and 2012). In none of the specifications are any of these coefficients significant at conventional levels.<sup><a href="#source-note-5" aria-label="Source note 5">5</a></sup>

An important finding does emerge from the coefficient estimates from 2014 onward. As before, the effects of the ACA demand-side shock and moderating effect of occupational licensing shows up strongly for younger individuals, but appears to transitorily affect the labor market decisions in 2014, but not in other post-treatment years. The coefficient estimates for the interactions with the 2014 year are remarkably stable to the selection of time period. Our finding is consistent with the thinking in Courtemanche et al. (2019), who note
If demand for ambulance services increased as a result of the ACA, there are several reasons to suspect that the supply-side response may have been muted, particularly in the short run. First, emergency medical service (EMS) personnel require considerable education and training, as well as certification, and there is evidence that shortages of these personnel existed even before the ACA took effect.

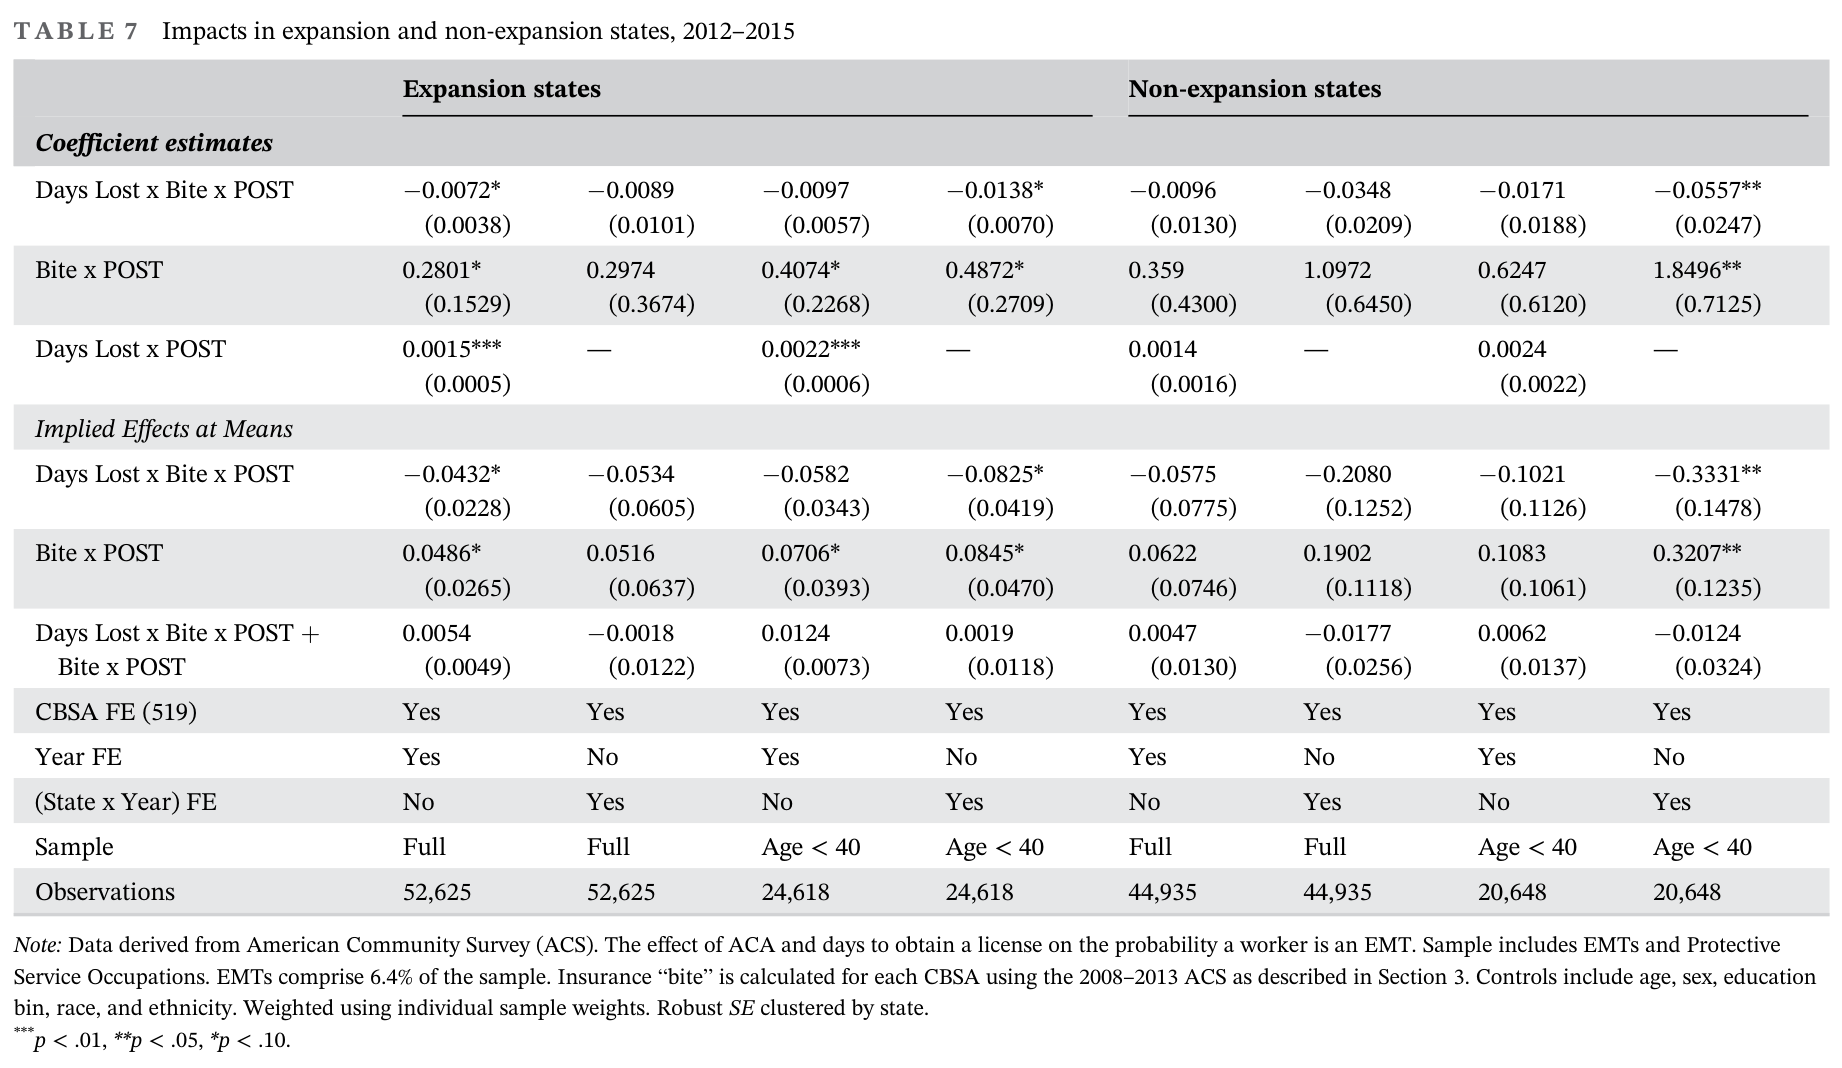
Second, we explore our parameterization of the <math xmlns="http://www.w3.org/1998/Math/MathML" display="inline"><mrow><mi>B</mi><mi>I</mi><mi>T</mi><msub><mi>E</mi><mrow><mi>a</mi><mi>s</mi></mrow></msub></mrow></math> variable from Equation (1). This time-invariant, localized, CBSA-level variable is meant to represent the demand-side shock from ACA implementation from 2014 onward. As noted previously, we would expect larger impact in states that more broadly expanded coverage via the Medicaid expansion, since uninsured individuals between 0 and 100% of the FPL also qualify for essentially free insurance. Courtemanche et al. (2019) note that both Medicaid and Marketplace insurance plans cover emergency ambulance services; at the same time, Medicaid plans often reimburse health care providers at lower rates than private plans. Thus, a similar-sized <math xmlns="http://www.w3.org/1998/Math/MathML" display="inline"><mrow><mi>B</mi><mi>I</mi><mi>T</mi><msub><mi>E</mi><mrow><mi>a</mi><mi>s</mi></mrow></msub></mrow></math> likely creates a more profitable demand-size opportunity in non-expansion states. Table 7 explores whether the EMT – entry effects are similar in expansion and non-expansion
states for the 2012 2015 period (where localized variation in <math xmlns="http://www.w3.org/1998/Math/MathML" display="inline"><mrow><mi>B</mi><mi>I</mi><mi>T</mi><msub><mi>E</mi><mrow><mi>a</mi><mi>s</mi></mrow></msub></mrow></math> continues to provide identification for the coefficients). Although we observe significant entry effects and moderating effects of occupational licensing, the effects are much stronger in non-expansion states, consistent with a larger implicit demand-side shock from higher reimbursement rates. Evaluated at the means for the uninsured rate and days lost, the demand-side shock results in a 32 percentage point increase in the relative decision to become an EMT in non-expansion states, compared with only an 8 percentage point increase in expansion states. As before, more stringent occupational licensing laws essentially completely offset these entry effects.

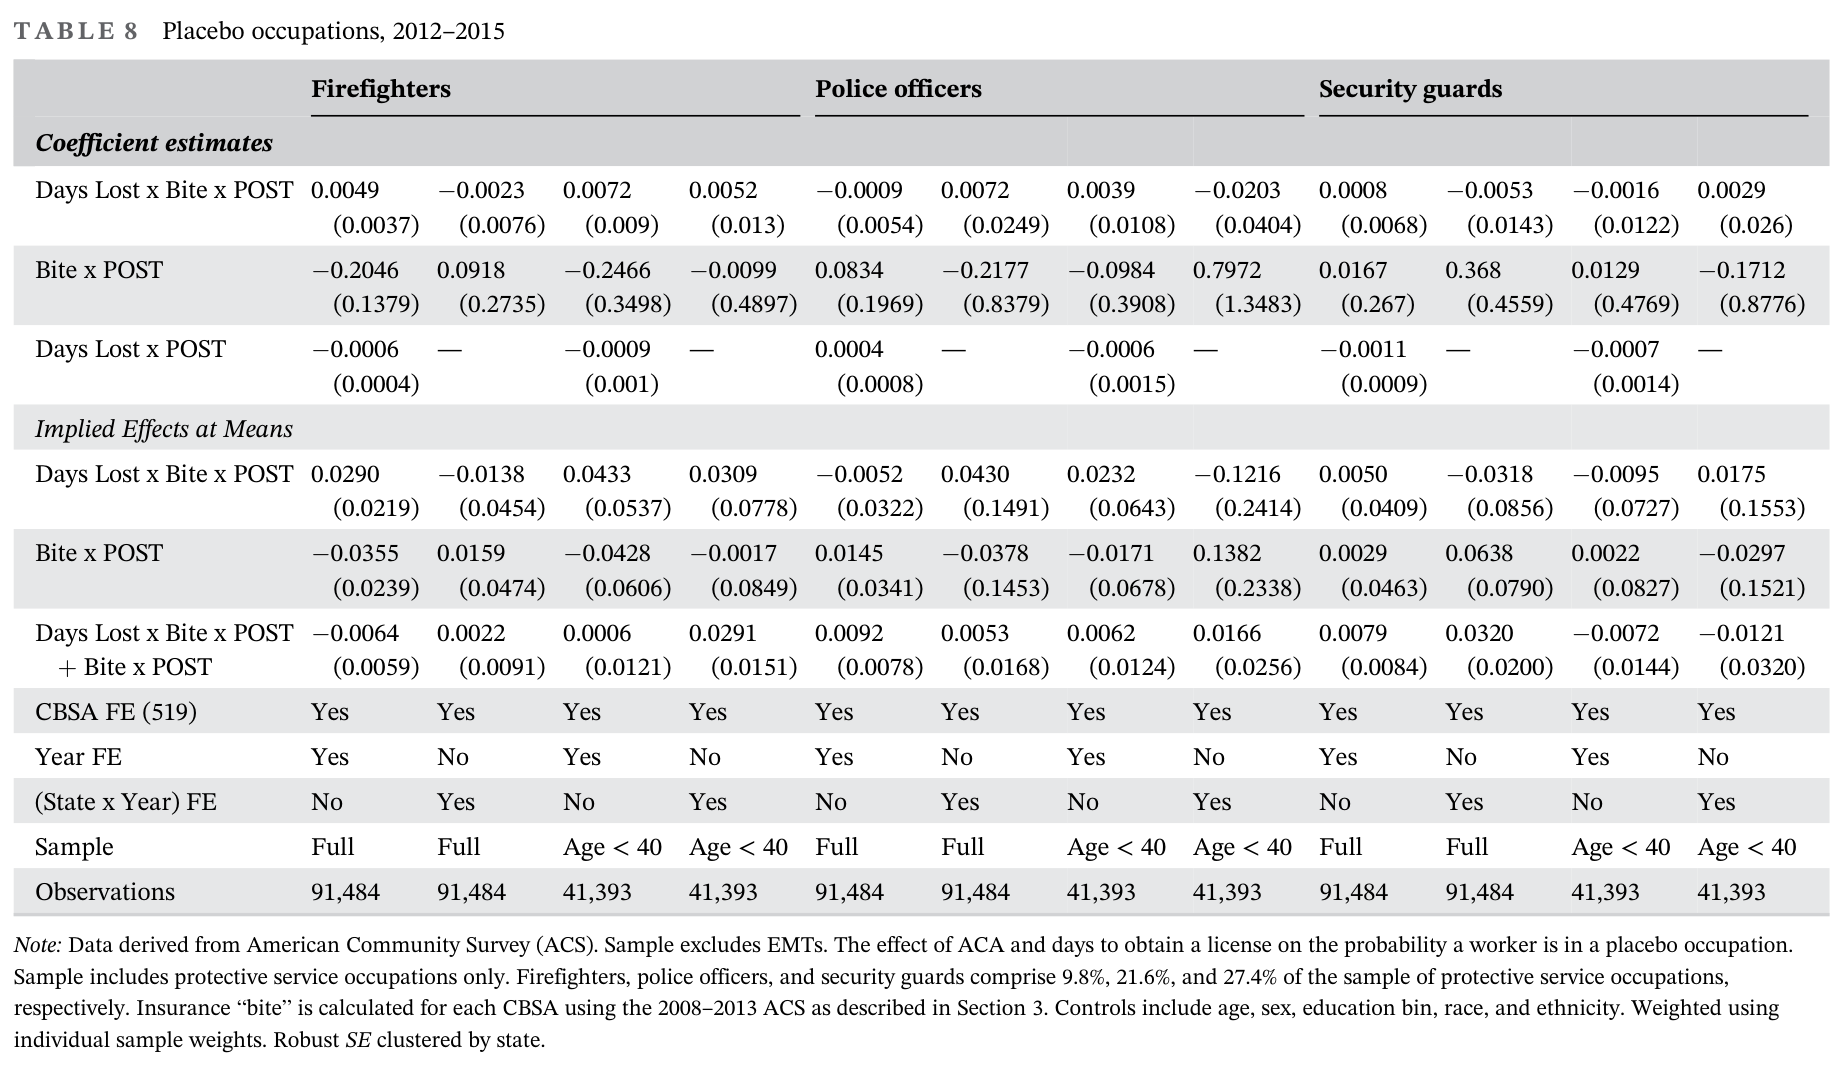
Finally, Table 8 performs “placebo” tests by omitting EMTs from the sample (leaving only protective service occupations), and explore whether a similar empirical specification to Equation (2) affects the choice to become a firefighter, police officer, or security guard in the 2012–2015 period (thus, leaving 91,484 of an initial sample of 97,560). These occupations were chosen because they represent 9.8%, 21.6%, and 27.4% of the remaining protective service occupations.

### Table 6. Event study specification

<figure><a href="/files/publications/ay-ja-5i36oi7xhlxlv4el-assets/table-6-first-part.png"><img alt="Table 6, first part: event-study coefficients for licensing days, insurance bite and year interactions across the 2012–2015, 2011–2016 and 2011–2017 samples; the table continues in the following image." height="1254" loading="lazy" src="/files/publications/ay-ja-5i36oi7xhlxlv4el-assets/table-6-first-part.png" width="1842"/></a><figcaption>Table 6, first part. <a href="/files/publications/ay-ja-5i36oi7xhlxlv4el-assets/table-6-first-part.png">Open full-resolution image</a>.</figcaption></figure><figure><a href="/files/publications/ay-ja-5i36oi7xhlxlv4el-assets/table-6-continued.png"><img alt="Table 6, continuation: licensing-day/year coefficients, fixed effects, full and under-40 samples, observation counts and estimation notes; 2013 is the omitted pretreatment year." height="1131" loading="lazy" src="/files/publications/ay-ja-5i36oi7xhlxlv4el-assets/table-6-continued.png" width="1842"/></a><figcaption>Table 6, continued. <a href="/files/publications/ay-ja-5i36oi7xhlxlv4el-assets/table-6-continued.png">Open full-resolution image</a>.</figcaption></figure>

### Table 7. Impacts in expansion and non-expansion states, 2012 –2015

<figure><a href="/files/publications/ay-ja-5i36oi7xhlxlv4el-assets/table-7.png"><img alt="Table 7: ACA and licensing effects on EMT occupation choice in Medicaid expansion versus non-expansion states, 2012–2015; includes implied effects and full/under-40 specifications." height="1068" loading="lazy" src="/files/publications/ay-ja-5i36oi7xhlxlv4el-assets/table-7.png" width="1842"/></a><figcaption>Table 7. <a href="/files/publications/ay-ja-5i36oi7xhlxlv4el-assets/table-7.png">Open full-resolution image</a>.</figcaption></figure>

### Table 8. Placebo occupations, 2012 –2015

<figure><a href="/files/publications/ay-ja-5i36oi7xhlxlv4el-assets/table-8.png"><img alt="Table 8: placebo occupation tests for firefighters, police officers and security guards, 2012–2015; includes coefficients, implied effects, fixed effects, sample counts and estimation notes." height="1068" loading="lazy" src="/files/publications/ay-ja-5i36oi7xhlxlv4el-assets/table-8.png" width="1842"/></a><figcaption>Table 8. <a href="/files/publications/ay-ja-5i36oi7xhlxlv4el-assets/table-8.png">Open full-resolution image</a>.</figcaption></figure>

Our expectation is that the “bite” from the demand-side shock from the ACA should not affect these occupations that are otherwise substitutes for EMTs, since they are not related to health care (and reimbursement from the ACA). This intuition is confirmed: none of the occupations has significant effects, and the overall magnitudes are relatively small.
## 6. CONCLUSION
The ACA led to large increases in coverage and utilization. This demand-side shock has been shown in other contexts to increase strain on the use of ambulances. In this paper, we examine whether there were supply-side reactions to the increased demand by examining EMTs, and whether occupational licensing laws moderate that reaction. We find suggestive evidence of both; taken together, occupational licensing laws virtually eliminated what would have otherwise been a sizable increase in the choice to become an EMT. The evidence suggests that areas that experienced the largest increase in insurance coverage also saw the greatest increase in EMTs. However, the ability of medical services to respond to an increase in demand depends on the entry barriers for labor
supply. Higher licensing entry barriers resulted in less EMT entry and fewer emergency medical service providers.

These results also highlight the fact that small barriers can matter, and to some degree, in a myopic way. An additional $500 of licensing costs should be negligible with respect to the lifetime earnings adjustment for switching professions. The typical EMT entrant appears to be an impatient, younger, male, influenced by these costs. Like other protective service occupations these entrants have less formal education and do not mind a physical, fast-paced environment. The flexibility of the EMT labor market should not be too much of a surprise though, given that the job of an EMT is to quickly respond to emergencies and dynamic situations. These entrants are likely making their decisions based on conversations within their network about the current labor
market demand and the difficulty and cost of the EMT coursework.
The cost of licensing in this analysis is the estimated days required to get the license. As shown in Table 4 these costs are highly correlated with the tuition cost to obtain the license but other associated costs may bias the estimates. To the degree that these costs are correlated with the time required to get a license, the entrants may be less responsive to specific changes to the required days, since these costs represent broader costs to licensing. It is also not known whether the EMT entrants are paying the tuition costs themselves. Compared with other professions, however, there does not appear to be anecdotal evidence that EMT courses are covered by scholarships, either on the educator's websites or in
the EMT guidebooks. Unlike other medical professions though, EMTs do not increase their lifetime earnings by getting a degree in a medical field or obtaining graduate-level medical training.

Another potential concern is that EMTs are not responding to the demand incentives in states with more licensing due to bottlenecks in the number of EMT schools providing training. This does not appear to be the case. While collecting the tuition data we identified 1814 EMT schools in the United States. This can be compared with the ~23 optometry colleges in the United States and 172 medical schools.<sup><a href="#source-note-6" aria-label="Source note 6">6</a></sup>

Our “days lost” measure cannot disentangle “better training” from “wasteful red tape.” The estimates highlight the degree to which entrants are responding to labor demand and entry costs. Some of the additional education is likely valuable in preparing EMTs, before they start on-the-job training. We find these costs matter in the short-term decision of a worker to enter the profession, particularly for a dynamic profession with minimal formal education requirements.

An important topic in the current pandemic is whether the U.S. regulatory framework inhibits supply-side responses from surges in health care demand. Our evidence—entirely before the current coronavirus pandemic—suggests the answer is yes, and that reduced regulatory burden could lead to much larger supply-side responses.
## ACKNOWLEDGMENTS
We thank participants at the “Reforming Healthcare Markets” conference in June 2020, supported by the Institute for Humane Studies and the Institute for the Study of Free Enterprise at University of Kentucky. In addition, Ed Timmons, Conor Lennon, John Garen, and Charles Courtemanche provided valuable feedback.
## References
- Anderson, M.D., Brown, R., Charles, K. & Rees, D. (2020) Occupational licensing and maternal health: evidence from early midwifery Laws. Journal of Political Economy, 128(11), 4337–4383.
- Angrist, J.D. & Guryan, J. (2008) Does teacher testing raise teacher quality? Evidence from state certification requirements. Economics of Education Review, 27(5), 483–503.
- Barrero, J.M., Bloom, N. & Davis, S.J. (2020) Covid-19 is a reallocation shock. Working paper [27137]. Cambridge, MA: NBER.
- Blackman, K. (2016) Telehealth and licensing interstate providers. National Conference of State Legislatures, Health Research, 24(25). https://www.ncsl.org/research/health/telehealth-and-licensing-interstate-providers.aspx
- Blair, P.Q. & Chung, B.W. (2018) How much of barrier to entry is occupational licensing? Working paper [No. 25262]. Cambridge, MA: NBER.
- BLS. (2020). Occupational Outlook Handbook, EMTs and Paramedics. Available at https://www.bls.gov/ooh/healthcare/emts-and-paramedics.htm
- Cannon, M.F. (2017) Health care regulation. Cato Handbook for Policymakers: Eighth Edition, 35, 343–366.
- Carpenter, D.M., Knepper, L., Sweetland, K. & McDonald, J. (2017) License to work: a National Study of burdens from occupational licensing, 2d edition. Arlington, VA: Institute for Justice. https://ij.org/report/license-work-2/
- Coughlin, C. (2018) EMT crash course, 2d edition. New Jersey: Research & Education Association.
- Council of Economic Advisors (2020). Deregulation Sparks Dramatic Telehealth Increase During the COVID-19 Response. https://www.whitehouse.gov/articles/deregulation-sparks-dramatic-telehealth-increase-covid-19-response/
- Courtemanche, C., Friedson, A., Koller, A.P. & Rees, D.I. (2019) The affordable care act and ambulance response times. Journal of Health Economics, 67, 102213.
- Courtemanche, C., Friedson, A.I. & Rees, D.I. (2019) Association of ambulance use in New York City with the implementation of the patient protection and affordable care act. JAMA Network Open, 2(6), e196419– e196419. https://doi.org/10.1001/jamanetworkopen.2019.6419
- Courtemanche, C., Marton, J., Ukert, B., Yelowitz, A. & Zapata, D. (2017) Early impacts of the affordable care act on health insurance coverage in Medicaid expansion and non-expansion states. Journal of Policy Analysis and Management, 36(1), 178–210. https://doi.org/10.1002/pam.21961
- Courtemanche, C., Marton, J., Ukert, B., Yelowitz, A. & Zapata, D. (2018a) Early effects of the affordable care act on health care access, risky health behaviors, and self-assessed health. Southern Economic Journal, 84(3), 660–691. https://doi.org/10.1002/soej.12245

- Courtemanche, C., Marton, J., Ukert, B., Yelowitz, A. & Zapata, D. (2018b) Effects of the affordable care act on health care access and self-assessed health after 3 years. INQUIRY: The Journal of Health Care Organization, Provision, and Financing, 55, 0046958018796361. https://doi.org/10.1177/0046958018796361
- Courtemanche, C., Marton, J., Ukert, B., Yelowitz, A. & Zapata, D. (2019) Effects of the affordable care act on health behaviors after 3 years. Eastern Economic Journal, 45(1), 7–33. https://doi.org/10.1057/s41302-018-0119-4
- Courtemanche, C., Marton, J., Ukert, B., Yelowitz, A. & Zapata, D. (2020) The impact of the ACA on health care access and self-assessed health in the trump era (2017-2018). Health Services Research, 55(S2), 841–850. https://doi.org/10.1111/1475-6773.13549
- Courtemanche, C., Marton, J., Ukert, B., Yelowitz, A., Zapata, D. & Fazlul, I. (2019) The three-year impact of the affordable care act on disparities in insurance coverage. Health Services Research, 54(S1), 307–316. https://doi.org/10.1111/1475-6773.13077
- Courtemanche, C., Marton, J. & Yelowitz, A. (2016) Who gained insurance coverage in 2014, the first year of full ACA implementation? Health Economics, 25(6), 778–784. https://doi.org/10.1002/hec.3349
- Dillender, M. (2020) How do Medicaid expansions affect demand for health care workers? Evidence from vacancy postings. Journal of Human Resources, 719, 10340R1.
- Finkelstein, A. (2007) The aggregate effects of health insurance: evidence from the introduction of Medicare. The Quarterly Journal of Economics, 122(1), 1–37. https://doi.org/10.1162/qjec.122.1.1
- Frean, M., Gruber, J. & Sommers, B.D. (2017) Premium subsidies, the mandate, and Medicaid expansion: coverage effects of the affordable care act. Journal of Health Economics, 53, 72–86. https://doi.org/10.1016/j.jhealeco.2017.02.004
- Friedman, M., Kuznets, S. (1945). Income from independent professional practice. National Bureau of Economic Research.
- Garrett, B., Gangopadhyaya, A. (2016). Who Gained Health Insurance Coverage under the ACA, and Where Do They Live? Available at https://www.urban.org/research/publication/who-gained-health-insurance-coverage-under-aca-and-where-do-they-live
- Gold, R., Bailey, S.R., O'Malley, J.P., Hoopes, M.J., Cowburn, S., Marino, M. et al. (2014) Estimating demand for care after a Medicaid expansion: lessons from Oregon. The Journal of Ambulatory Care Management, 37(4), 282–292.
- Greenberg, D. (2020). States respond to coronavirus with occupational licensing reforms. U.S. Department of Labor Blog. https://blog.dol.gov/2020/05/19/states-respond-to-coronavirus-with-occupational-licensing-reforms
- Gruber, J. & Sommers, B.D. (2019) The affordable care Act's effects on patients, providers, and the economy: what We've learned so far. Journal of Policy Analysis and Management, 38(4), 1028–1052. https://doi.org/10.1002/pam.22158
- Harris, E. & Mok, S. (2015) How CBO estimates the effects of the affordable care act on the labor market. Working paper [No. 2015-09]. Washington, DC: Congressional Budget Office.
- Hentze, I. (2020). COVID-19: Occupational Licensing During Public Emergencies. National Conference of State Legislatures. https://www.ncsl.org/research/labor-and-employment/covid-19-occupational-licensing-in-public-emergencies.aspx
- Ingram, S.J. (2019) Occupational licensing and the earnings premium in the United States: updated evidence from the current population survey. British Journal of Industrial Relations, 57(4), 732–763.
- Ingram, S.J. & Yelowitz, A. (Forthcoming) Real estate agent dynamism and licensing entry barriers. Journal of Entrepreneurship and Public Policy. https://doi.org/10.1108/jepp-07-2019-0063
- Kaestner, R., Garrett, B., Chen, J., Gangopadhyaya, A. & Fleming, C. (2017) Effects of ACA Medicaid expansions on health insurance coverage and labor supply. Journal of Policy Analysis and Management, 36(3), 608–642. https://doi.org/10.1002/pam.21993
- Kirch, D.G., Henderson, M.K. & Dill, M.J. (2012) Physician workforce projections in an era of health care reform. Annual Review of Medicine, 63, 435–445.
- Kleiner, M.M. (2006) Licensing occupations: ensuring quality or restricting competition?. Kalamazoo, MI: W.E. Upjohn Institute for Employment Research.
- Kleiner, M.M. & Kudrle, R. (2000) Does regulation affect economic outcomes? The case of dentistry. The Journal of Law and Economics., 43(2), 547–582.

- Kleiner, M.M., Marier, A., Park, K.W. & Wing, C. (2016) Relaxing occupational licensing requirements: analyzing wages and prices for a medical service. The Journal of Law and Economics, 59(2), 261–291.
- Koumenta, M. & Pagliero, M. (2016) Measuring prevalence and labour market impacts of occupational regulation in the EU. Research Report to the European Commission, 1, 1–142. https://ec.europa.eu/growth/content/measuring-prevalence-and-labour-market-impacts-occupational-regulation-eu-0_en
- Leung, P. & Mas, A. (2018) Employment effects of the affordable care act Medicaid expansions. Industrial Relations, 57(2), 206–234.
- McMichael, B.J. (2017) The demand for healthcare regulation: the effect of political spending on occupational licensing Laws. Southern Economic Journal, 84(1), 297–316.
- Miller, S. (2012) The effect of insurance on emergency room visits: an analysis of the 2006 Massachusetts health reform. Journal of Public Economics, 96(11), 893–908.
- Mulligan, C.B. & Gallen, T.S. (2013) Wedges, Wages, and Productivity Under the Affordable Care Act. Working paper [No. 19771]. Cambridge, MA: NBER.
- Ostermayer, D.G., Brown, C.A., Fernandez, W.G. & Couvillon, E. (2017) Areas of potential impact of the patient protection and affordable care act on EMS: a synthesis of the literature. The Western Journal of Emergency Medicine, 18(3), 446–453.
- Ruiz, B. (2013). The EMT handbook: become the best possible EMT while preparing for your future. E-book ed., Kindle.
- Soileau, J.S., Usrey, S.C. & Webb, T.Z. (2017) Sitting requirements and the CPA exam. Issues in Accounting Education, 32(1), 1–15.
- Spetz, J., Frogner, B.K., Lucia, L. & Jacobs, K. (2012) The impact of the affordable care act on new jobs: San Francisco, CA: Healthforce Center at UCSF. https://healthforce.ucsf.edu/publications
- Svorny, S. (2017) Liberating telemedicine: options to eliminate the state-licensing roadblock. Cato Institute Policy Analysis, 826, 1–24.
- Timmons, E. J., Bayne, E., Norris, C. (2020). A primer on emergency occupational licensing reforms for combating COVID-19. Mercatus Center Policy Brief March 26, 2020. https://www.mercatus.org/publications/covid-19-policy-brief-series
- Timmons, E.J. & Thornton, R.J. (2008) There and back again: the de-licensing and re-licensing of barbers in Alabama. British Journal of Industrial Relations, 57(4), 764–790.
- Timmons, E.J. & Thornton, R.J. (2019) The effects of licensing on the wages of radiologic technologists. Journal of Labor Research, 29, 333–346.
- Zapletal, M. (2019) The effects of occupational licensing: evidence from business-level data. British Journal of Industrial Relations, 57(4), 894–918.

---

## Notes

<p id="source-note-1"><strong>1.</strong> Bureau of Labor Statistics “Employed persons by detailed occupation, sex, race, and Hispanic or Latino ethnicity” https://www.bls.gov/cps/tables.htm</p>

<p id="source-note-2"><strong>2.</strong> https://www.shadac.org/publications/defining-family-studies-health-insurance-coverage</p>

<p id="source-note-3"><strong>3.</strong> Note less than 1% of our ACS sample has less than a high school degree. Virginia and Ohio licensing information: https://www.vdh.virginia.gov/emergency-medical-services/education-certification/how-to-become-an-emergency-medical-services-provider-in-virginia/i-hold-no-state-or-national-ems-credential/ See https://www.ems.ohio.gov/education-faq.aspx#provider.</p>

<p id="source-note-4"><strong>4.</strong> The coefficients are evaluated with Stata's Lincom command.</p>

<p id="source-note-5"><strong>5.</strong> This finding is also consistent with Courtemanche, Friedson, Koller, and Rees (2019a, footnote 28), who find no clear trend for anticipatory supply-side responses for ambulance service workers in event study models.</p>

<p id="source-note-6"><strong>6.</strong> These are the number of schools listed on the Association of Schools and Colleges of Optometry and Association of American Medical Colleges websites respectively.</p>